
ETF Tracker StatSheet
You can view the latest version here.
WHEN BAD NEWS IS GOOD NEWS
- Moving the markets
The eagerly awaited May jobs report surprised us with another “miss,” but it was not as dreadful as April’s result. The BLS reported that 559k jobs were added, which was a big improvement from last month’s revised 278k, but it fell short of expectations of 671k.
Traders interpreted this reading as a “goldilocks” scenario, meaning that the number was not “hot” enough to cause Fed intervention, yet good enough to not have to worry about the economy. As a result, the bulls got their way, and up we went.
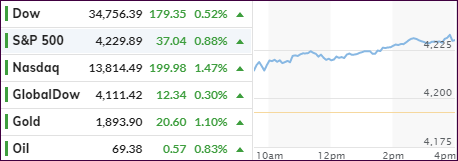
The three major indexes scored solid gains, for a change led by the lagging Nasdaq, which notched a 1.47% advance. Today, it was a victory for “growth” over “value” with Small Caps (VBK) adding 1.01%.
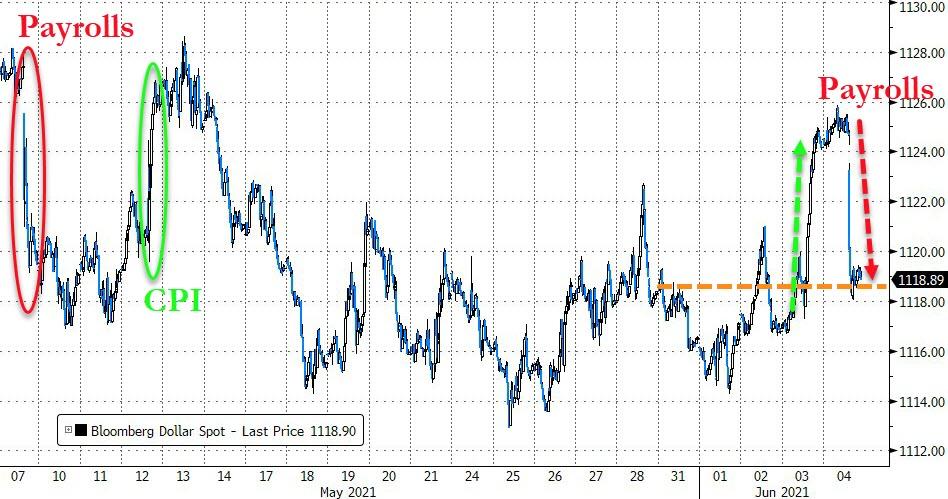
Bond yields took a big tumble with the 10-year dropping below the 1.56% level, its second lowest yield since early March, as ZeroHedge pointed out. After yesterday’s spike, the US Dollar was beaten back down to reality and plunged sharply.
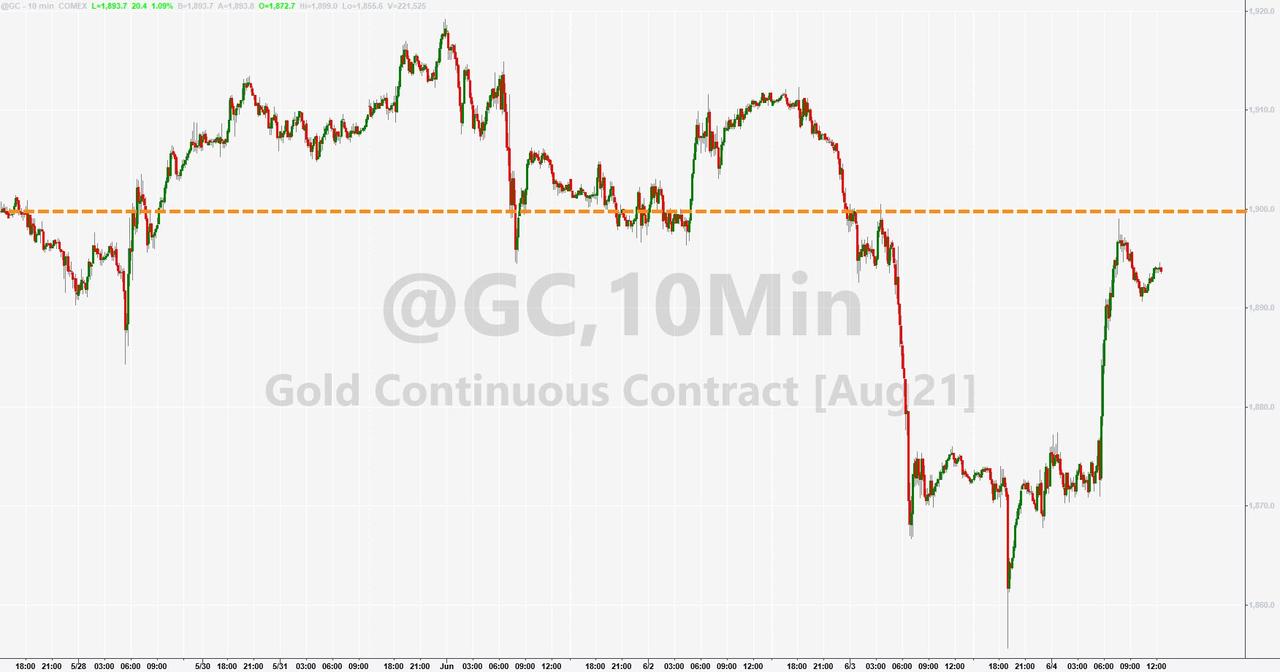
This combination of a falling dollar and bond yields enabled Gold to stage a nice comeback of 1.11% after yesterday’s drubbing, but it was not enough to reclaim the $1,900 level.
I have talked about the potential of moving back into a stagflation scenario like what we saw in the late 70s. Some indicators are out of whack and support this possibility.
ZeroHedge, via Bloomberg, posted this chart while pondering the question “which way will the jaws snap shut?”
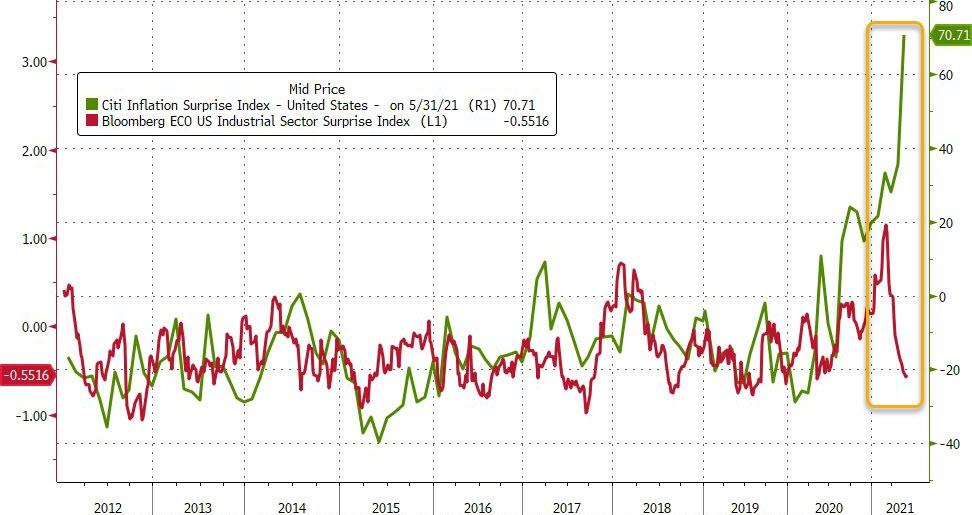
2. ETFs in the Spotlight
In case you missed the announcement and description of this section, you can read it here again.
It features some of the 10 broadly diversified domestic and sector ETFs from my HighVolume list as posted every Saturday. Furthermore, they are screened for the lowest MaxDD% number meaning they have been showing better resistance to temporary sell offs than all others over the past year.
The below table simply demonstrates the magnitude with which these ETFs are fluctuating above or below their respective individual trend lines (%+/-M/A). A break below, represented by a negative number, shows weakness, while a break above, represented by a positive percentage, shows strength.
For hundreds of ETF choices, be sure to reference Thursday’s StatSheet.
For this current domestic “Buy” cycle, here’s how some our candidates have fared:
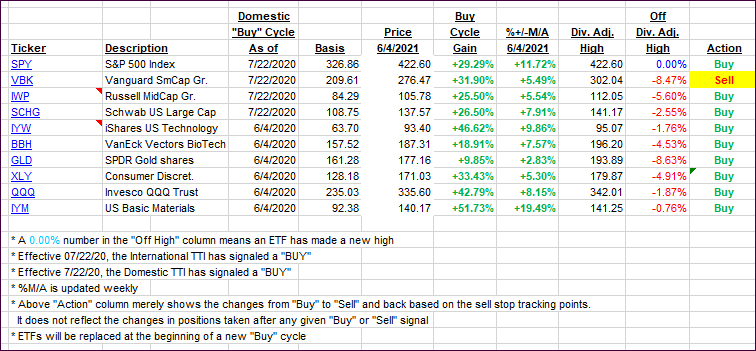
Click image to enlarge.
Again, the %+/-M/A column above shows the position of the various ETFs in relation to their respective long-term trend lines, while the trailing sell stops are being tracked in the “Off High” column. The “Action” column will signal a “Sell” once the -8% point has been taken out in the “Off High” column. For more volatile sector ETFs, the trigger point is -10%.
3. Trend Tracking Indexes (TTIs)
Our TTIs slipped a tad despite a broad market advance.
This is how we closed 06/04/2021:
Domestic TTI: +16.93% above its M/A (prior close +17.34%)—Buy signal effective 07/22/2020.
International TTI: +15.85% above its M/A (prior close +16.13%)—Buy signals effective 07/22/2020.
Disclosure: I am obliged to inform you that I, as well as my advisory clients, own some of the ETFs listed in the above table. Furthermore, they do not represent a specific investment recommendation for you, they merely show which ETFs from the universe I track are falling within the specified guidelines.
All linked charts above are courtesy of Bloomberg via ZeroHedge.
———————————————————-
WOULD YOU LIKE TO HAVE YOUR INVESTMENTS PROFESSIONALLY MANAGED?
Do you have the time to follow our investment plans yourself? If you are a busy professional who would like to have his portfolio managed using our methodology, please contact me directly or get more details here.
———————————————————
Back issues of the ETF Tracker are available on the web.
Contact Ulli