
- Moving the markets
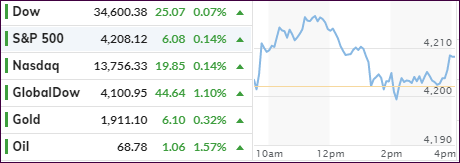
In a repeat performance from yesterday, the major indexes rocketed higher right after the opening but then lost their mojo, headed below their respective unchanged lines but managed to eke out a small gain.
The S&P 500 hovers less than 1% from its record high in May and is having trouble breaking through that glass ceiling. The Dow and Nasdaq are also positioned within striking distance of their record levels with the former needing a 1.5% rally, while the latter has some 3.5% to go before reaching that lofty point.
Inflation fears and the uneven economic reopening seem to be keeping a lid on further advances, as is Friday’s upcoming big jobs report. After last month’s disaster, expectations are for 671k new nonfarm payrolls, considerably higher than April’s 266k, for which the whisper number was close to 1 million.
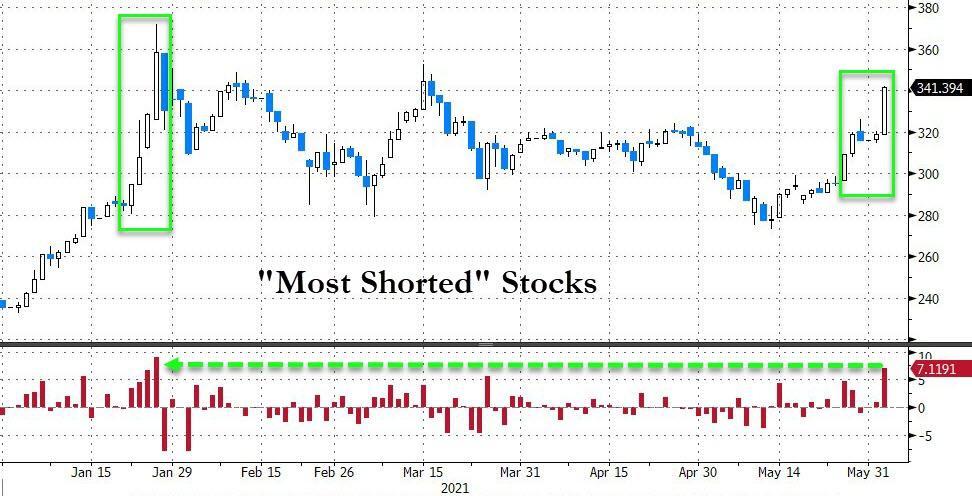
The most shorted stocks were subjected to an epic squeeze, their biggest since the chaos with GME in January, according to ZeroHedge. Small Caps rode another roller coaster and ended slightly in the red (VBK), while “value” again outperformed “growth.”
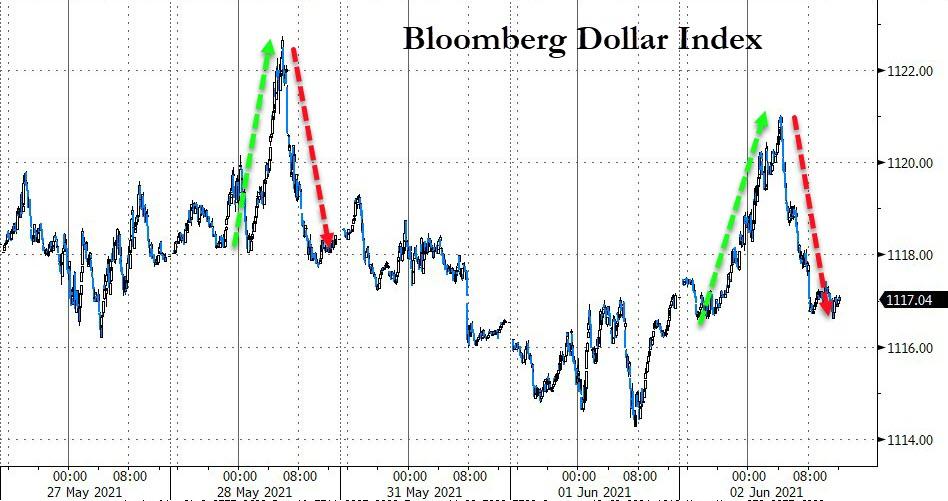
The US Dollar index was stuck in a world of its own with an early rip followed by a mid-day dip back to the unchanged line. Bond yields slid with the 10-year slipping to the 1.59% area. This allowed Gold to rise moderately and solidly its position above its recently conquered $1,900 level.
I expect more of the same tomorrow with trader’s being focused on Friday’s jobs report.
2. ETFs in the Spotlight
In case you missed the announcement and description of this section, you can read it here again.
It features some of the 10 broadly diversified domestic and sector ETFs from my HighVolume list as posted every Saturday. Furthermore, they are screened for the lowest MaxDD% number meaning they have been showing better resistance to temporary sell offs than all others over the past year.
The below table simply demonstrates the magnitude with which these ETFs are fluctuating above or below their respective individual trend lines (%+/-M/A). A break below, represented by a negative number, shows weakness, while a break above, represented by a positive percentage, shows strength.
For hundreds of ETF choices, be sure to reference Thursday’s StatSheet.
For this current domestic “Buy” cycle, here’s how some our candidates have fared:
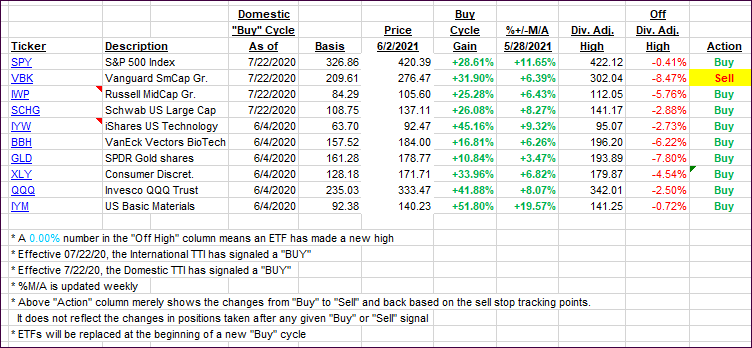
Click image to enlarge.
Again, the %+/-M/A column above shows the position of the various ETFs in relation to their respective long-term trend lines, while the trailing sell stops are being tracked in the “Off High” column. The “Action” column will signal a “Sell” once the -8% point has been taken out in the “Off High” column. For more volatile sector ETFs, the trigger point is -10%.
3. Trend Tracking Indexes (TTIs)
Our TTIs moved up, with especially the International one showing more upside momentum.
This is how we closed 06/02/2021:
Domestic TTI: +17.51% above its M/A (prior close +17.43%)—Buy signal effective 07/22/2020.
International TTI: +16.44% above its M/A (prior close +15.86%)—Buy signals effective 07/22/2020.
Disclosure: I am obliged to inform you that I, as well as my advisory clients, own some of the ETFs listed in the above table. Furthermore, they do not represent a specific investment recommendation for you, they merely show which ETFs from the universe I track are falling within the specified guidelines.
All linked charts above are courtesy of Bloomberg via ZeroHedge.
Contact Ulli