Weekly StatSheet For The ETF Tracker Newsletter – Updated Through 06/10/2021

Ulli ETF StatSheet Contact

ETF Data updated through Thursday, June 10, 2021
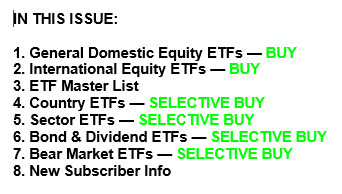
Methodology/Use of this StatSheet:

1. From the universe of over 1,800 ETFs, I have selected only those with a trading volume of over $5 million per day (HV ETFs), so that liquidity and a small bid/ask spread are assured.

2. Trend Tracking Indexes (TTIs)

Buy or Sell decisions for Domestic and International ETFs (section 1 and 2), are made based on the respective TTI and its position either above or below its long-term M/A (Moving Average). A crossing of the trend line from below accompanied by some staying power above constitutes a “Buy” signal. Conversely, a clear break below the line constitutes a “Sell” signal. Additionally, I use an 8% trailing stop loss on all positions in these categories to control downside risk.

3. All other investment arenas do not have a TTI and should be traded based on the position of the individual ETF relative to its own respective trend line (%M/A). That’s why those signals are referred to as a “Selective Buy.” In other words, if an ETF crosses its own trendline to the upside, a “Buy” signal is generated. Since these areas tend to be more volatile, I recommend a wider trailing sell stop of 8%-10% depending on your risk tolerance.

If you are unfamiliar with some of the terminology, please see Glossary of Terms and new subscriber information in section 9.     

1. DOMESTIC EQUITY ETFs: BUY — since 07/22/2020
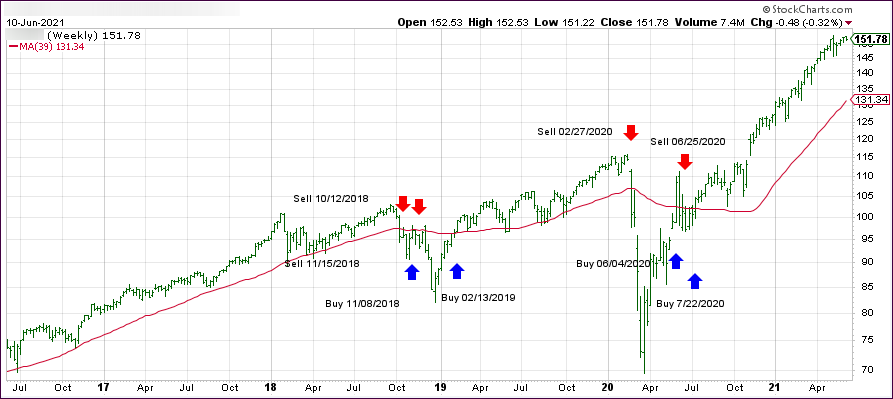
Click on chart to enlarge

Our main directional indicator, the Domestic Trend Tracking Index (TTI-green line in the above chart) has now rallied above its long-term trend line (red) by +16.57% and remains in “BUY” mode as posted.

Read More
Shrugging Off Inflation Anxieties

Ulli Market Commentary Contact

[Chart courtesy of MarketWatch.com]

  1. Moving the markets

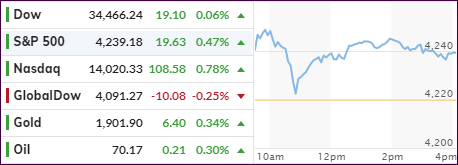
Despite consumer prices accelerating at their fastest pace since mid-2008, with the Consumer Price Index (CPI) rising 5% YoY, you would not have known that by today’s market reaction. Apparently, the investment crowd has bought the theme spewed about by the Fed that inflation is or will be “transitory.”

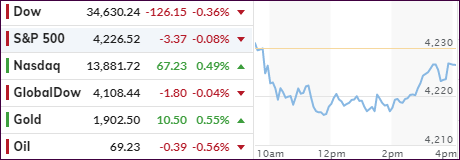
The markets shrugged off any inflation concerns, and the S&P 500 promptly scored another intra-day record by touching the 4,249 level before pulling back into the close. All three major indexes, despite bobbing and weaving all day, recovered from an early dip, and closed in the green led by the Nasdaq with a +0.78% gain.

Today’s flip-flopping pattern included Small Caps, which eked out a gain after an early drop with VBK adding +0.57%, while the value based RPV slid again and gave back -0.87%, but YTD, the latter remains the king of the hill.

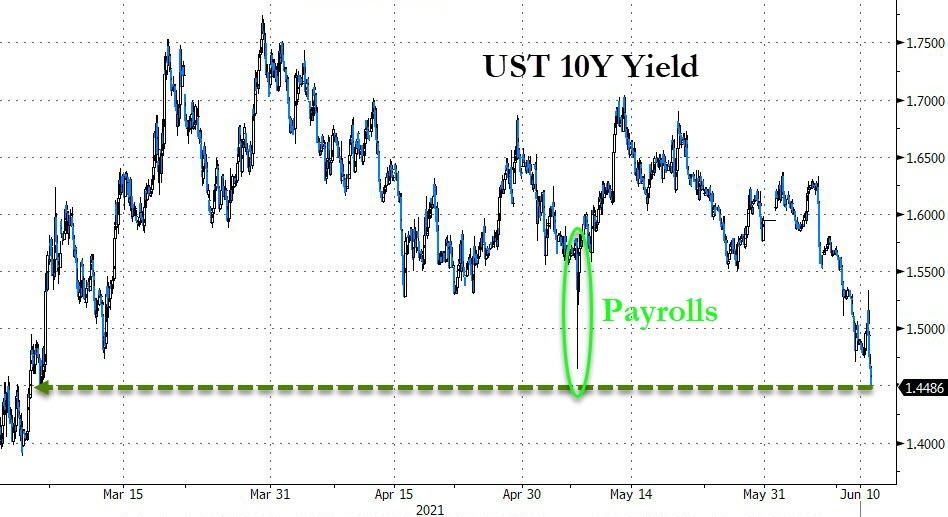
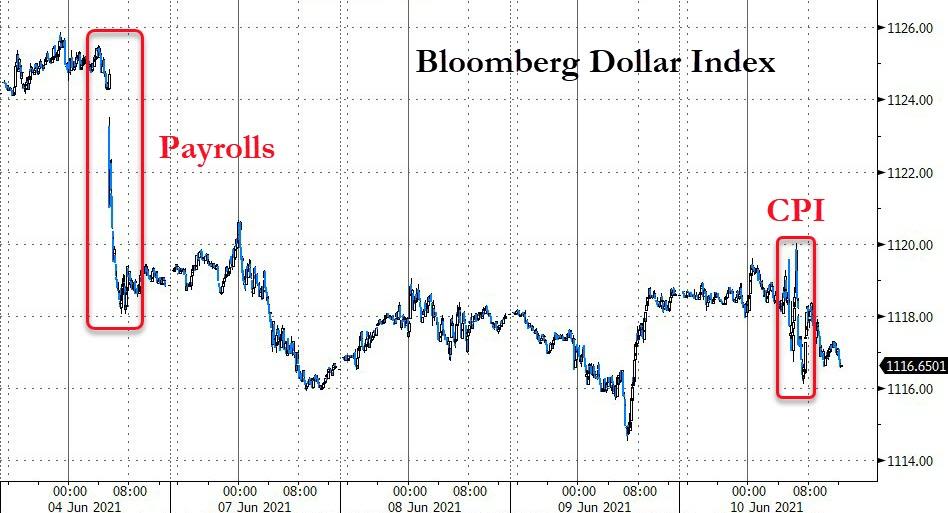
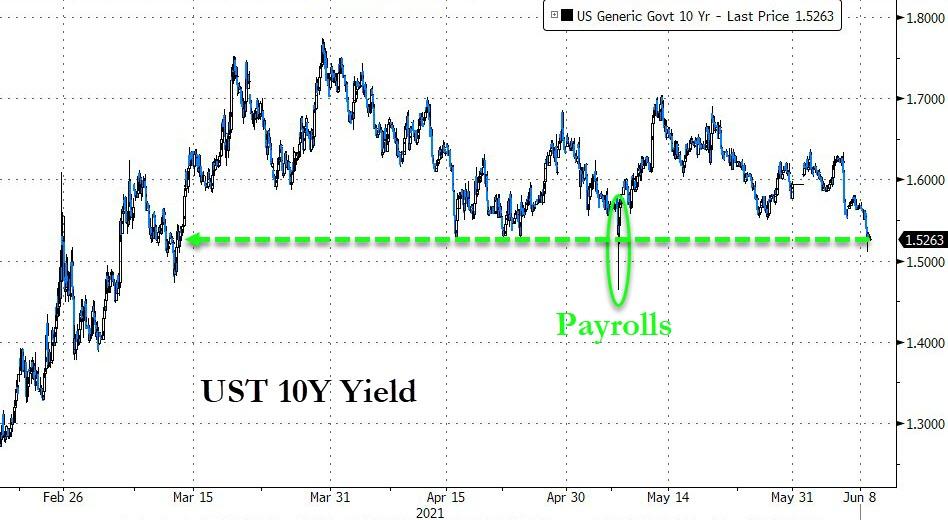
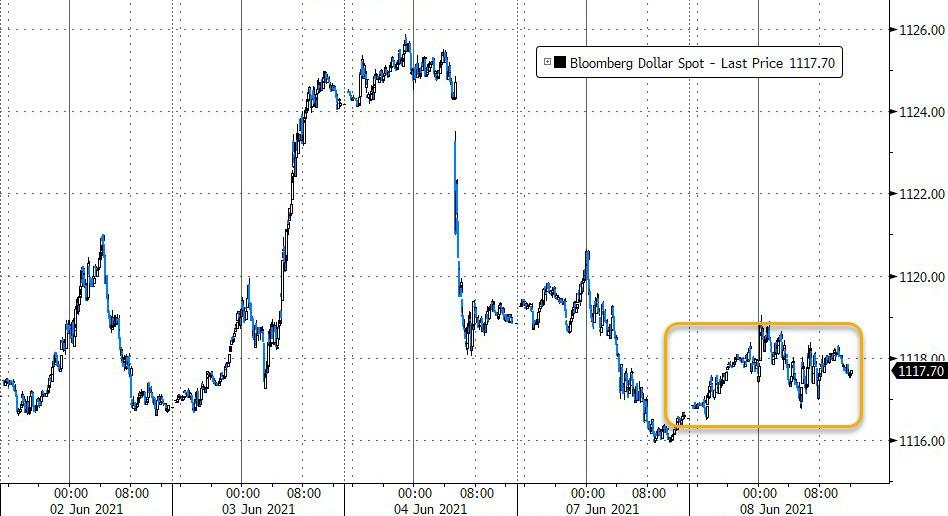
Interestingly, in light of the surging CPI number, bond yields slid with the 10-year down below the 1.5% level, at 1.45%, thereby touching its lowest point since March 14. The US Dollar Index pumped and dumped all day and ending the session lower.   

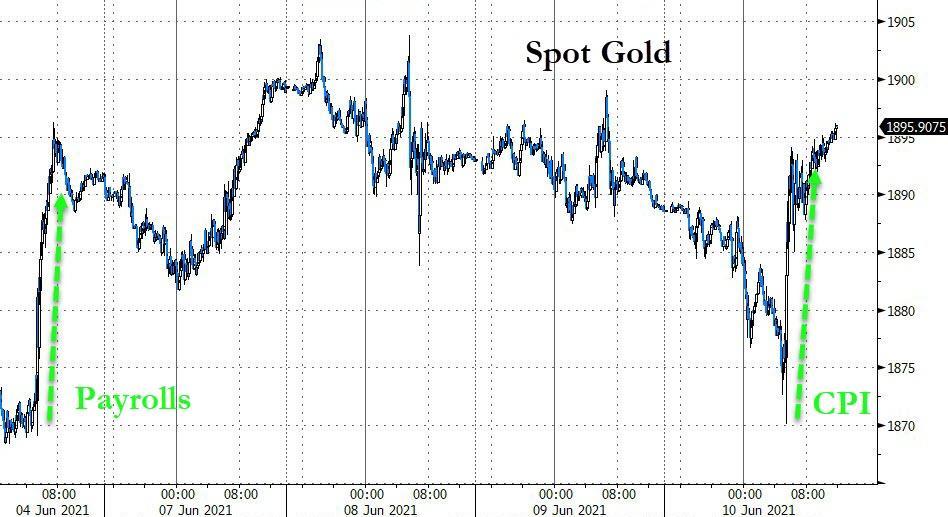
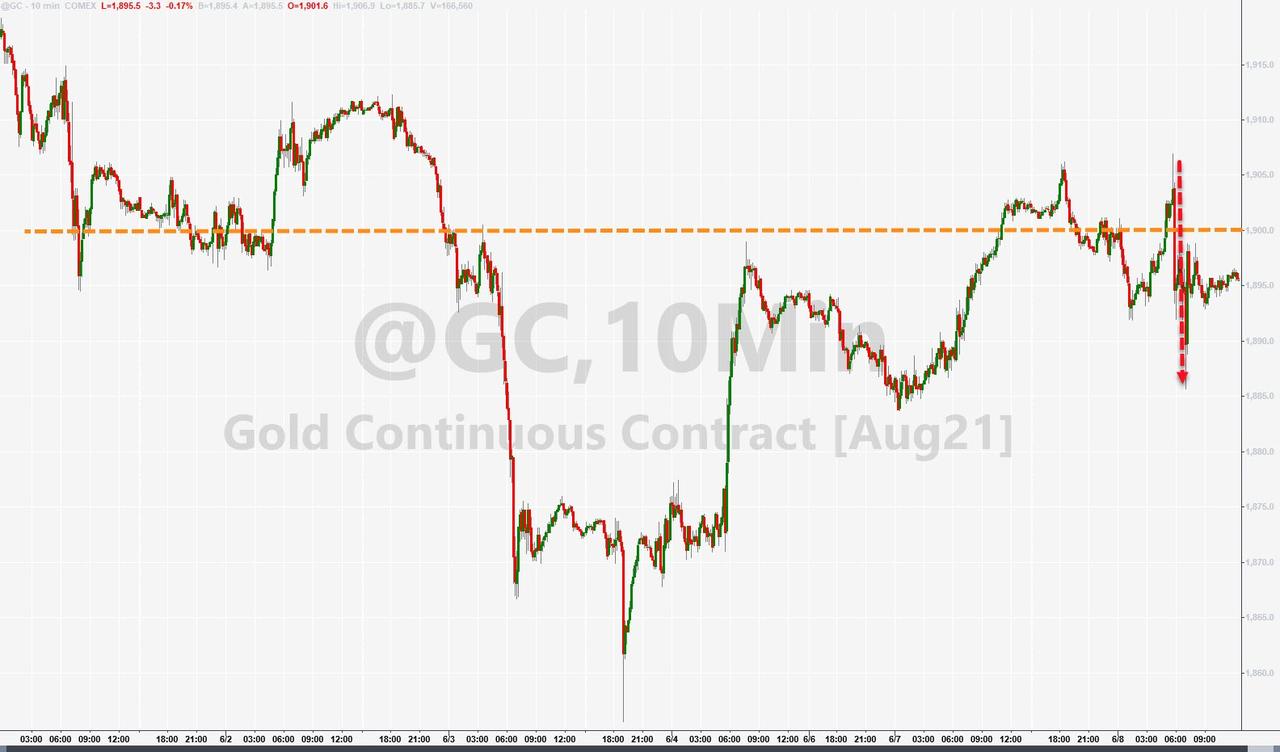
Needless to say, the CPI number gave an assist to Gold, which rallied a modest +0.30% but was not able to recapture its $1,900 level.

Added ZeroHedge:

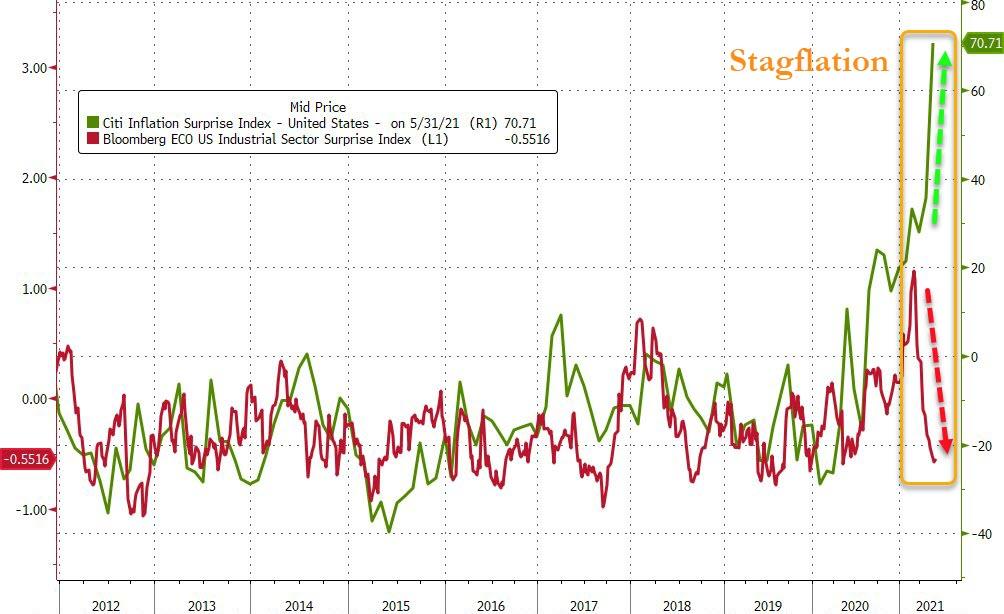
Today’s big upside inflation surprise piles on the stagflationary evidence as production expectations remain too optimistic…

This chart makes this abundantly clear.

Read More

No Market Commentary

Ulli Uncategorized Contact

A few business commitments are keeping me out of the office again, so there will be no commentary today. Regular posting will resume tomorrow.

Ulli…

Digging A Hole And Climbing Out Of It

Ulli Market Commentary Contact

[Chart courtesy of MarketWatch.com]

  1. Moving the markets

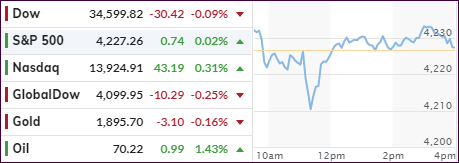
An early upswing for the major indexes ran out of steam mid-morning with all three of them plunging into the red. This dip below the unchanged line did not last very long, and a slow but steady recovery pulled the indexes out of that early hole and back into green territory.

However, only the Nasdaq managed a noteworthy recovery of +0.31%, while the other two more or less ended up hugging their flat lines. Not much gained and not much lost sums up this session best, as the S&P continues to hover near its record close.

On the economic front, we learned that job openings in April rose to a new record high showing an amazing 9.3 million vacancies, as high numbers quit their jobs contributing to the supply-demand mismatch resulting from overly generous unemployment benefits.

Added ZeroHedge:

Separately, in yet another indication of the record surge in demand for labor since the collapse last April when there were 18.1 million more unemployed workers than there are job openings – the biggest gap on record – the gap has since shrunk dramatically to just 526K in April, down from 1.4 million in March. Yes: despite the covid shock, there are just half a million more unemployed people than there are job openings!

How this is going to end is anyone’s guess, but it is sad situation in this environment that firms are having a hard time filling open positions. On the other hand, what do you expect when people get paid more staying at home than going to work?

While the tech sector moved moderately higher, this day belonged to Small Caps with VBK adding a solid +1.17% thereby outperforming the rest of the space. Bond yields retreated with the 10-year closing at 1.54%, its lowest since March.

While that should have assisted Gold, it did not, as the US Dollar found some upward momentum and gained a moderate 0.18%.

Mused ZeroHedge:

Finally, we wonder just what will happen when all these couch-sitters actually run out of benefits? Record job openings… and near-record people soaking up government handouts rather than apply for a job.

Read More

Struggling For Direction

Ulli Market Commentary Contact

[Chart courtesy of MarketWatch.com]

  1. Moving the markets

The Dow and S&P 500 lost their early upward impetus and slid most of the day besides not being able to pierce overhead resistance, despite hovering within striking distance of new all-time highs. For a change, the Nasdaq showed more strength and ended the session moderately to the upside.

Some analysts see the economic recovery as well-balanced, but only as long as signs of rising inflation are interpreted by the Fed to be “transitory.” I do not share that transitory viewpoint, because inflation potential, once unleashed to the degree it has, will not suddenly disappear on its own.

For today, however, the Biotech sector took top billing, while the broader market was treading water. The 10-year bond yield pumped and dumped and ended in proximity of where it started. The US Dollar index continued Friday’s slide, which allowed Gold to build on recent gains and break back above its $1,900 level, supported by a +0.56% gain.  

The big dog on deck will be Thursday’s CPI release, which DB’s Jim Reid explains as follows:

Consensus estimates for May currently expect both the headline and core rate to rise +0.4% month-on-month which would lift the YoY rate to 4.7% and 3.4% respectively, which will be the highest since late 2008 and 1993 which would be a pretty impressive feat especially on the core. This will undoubtedly be the most watched data release this year so far.

For sure, these are numbers that can’t be ignored forever and eventually will unearth a response from the Fed that may not be market friendly.

Read More

ETFs On The Cutline – Updated Through 06/04/2021

Ulli ETFs on the Cutline Contact

Below, please find the latest High-Volume ETF Cutline report, which shows how far above or below their respective long-term trend lines (39-week SMA) my currently tracked ETFs are positioned.

This report covers the HV ETF Master List from Thursday’s StatSheet and includes 312 High Volume ETFs, defined as those with an average daily volume of more than $5 million, of which currently 258 (last week 256) are hovering in bullish territory. The yellow line separates those ETFs that are positioned above their trend line (%M/A) from those that have dropped below it.

Take a look:                                                                   

The HV ETF Master Cutline Report

In case you are not familiar with some of the terminology used in the reports, please read the Glossary of Terms. If you missed the original post about the Cutline approach, you can read it here.