Diving And Thriving

Ulli Market Commentary Contact

[Chart courtesy of MarketWatch.com]

  1. Moving the markets

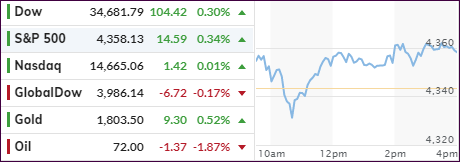
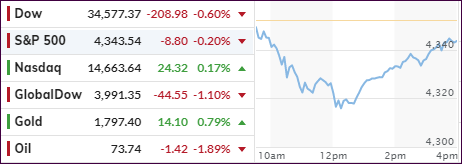
An initial bounce hit a brick wall and turned into a sudden dive with early gains being eradicated in a hurry. But, as we’ve seen many times before, a late morning rally pulled the major indexes out of a deep hole and pushed them back into the green with the Nasdaq lagging and barely reaching its unchanged line.

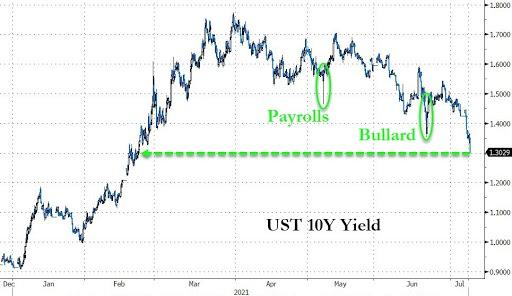
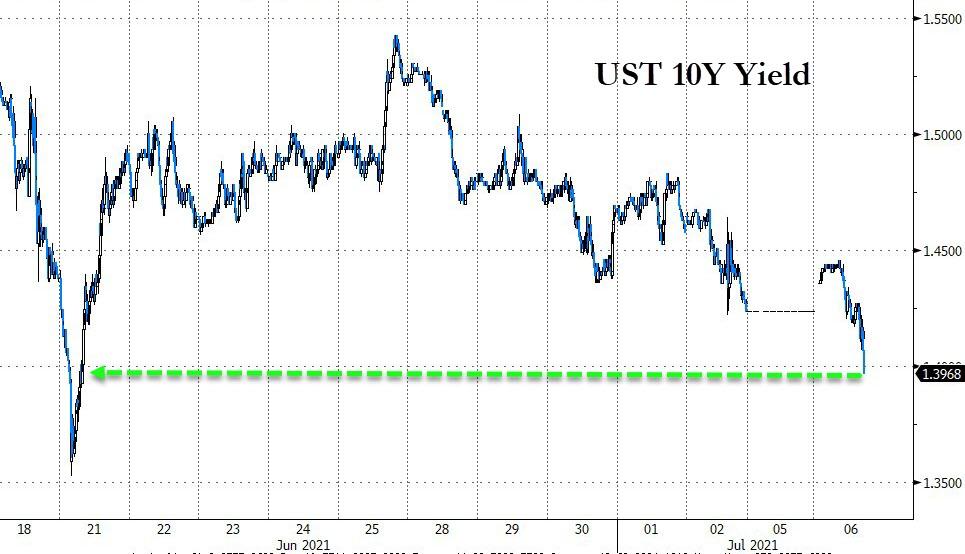
The S&P 500 touched new record territory but backed off into the close. In defiance of many predictions by “experts,” bond yields continued to tank, as the meme, that “peak economic growth” might have already happened, continued, with the 10-year yield now closing at 1.316%, its lowest level since February 19th.

On the economic front, we learned that, even though Job Openings hit a new record, there are still some 11 million Americans, who are collecting various pandemic emergency unemployment claims, as ZH indicated. Go figure…

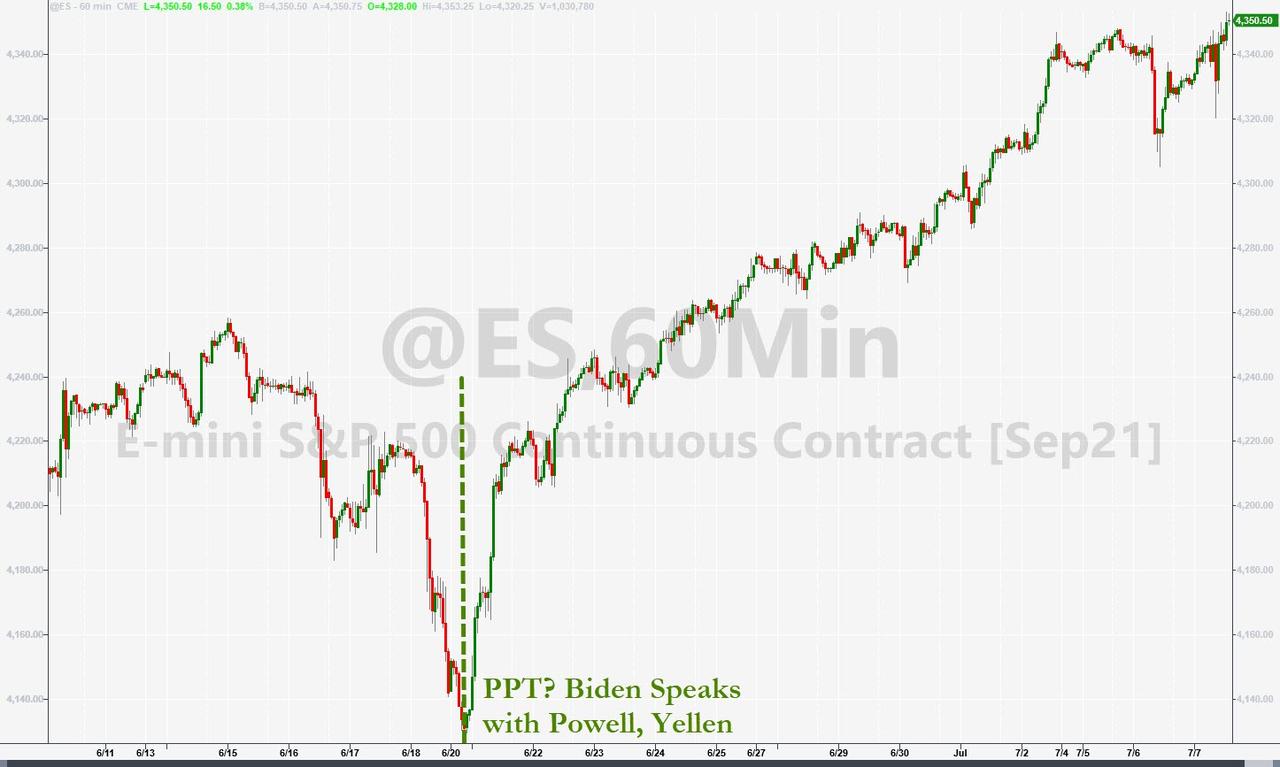
Why did the markets stage a ferocious rebound? While no one has a conclusive answer, ZeroHedge, most likely tongue in cheek, pointed to this graphic explanation.

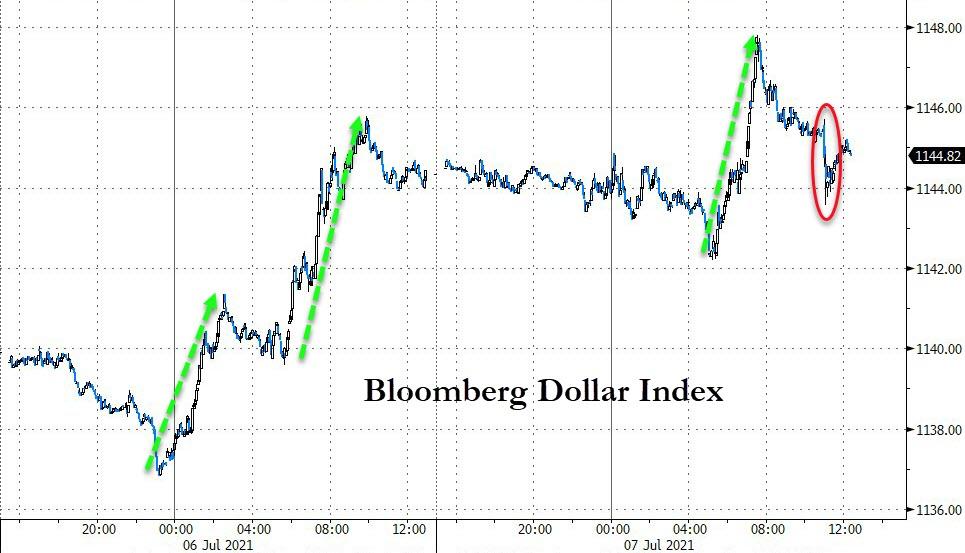
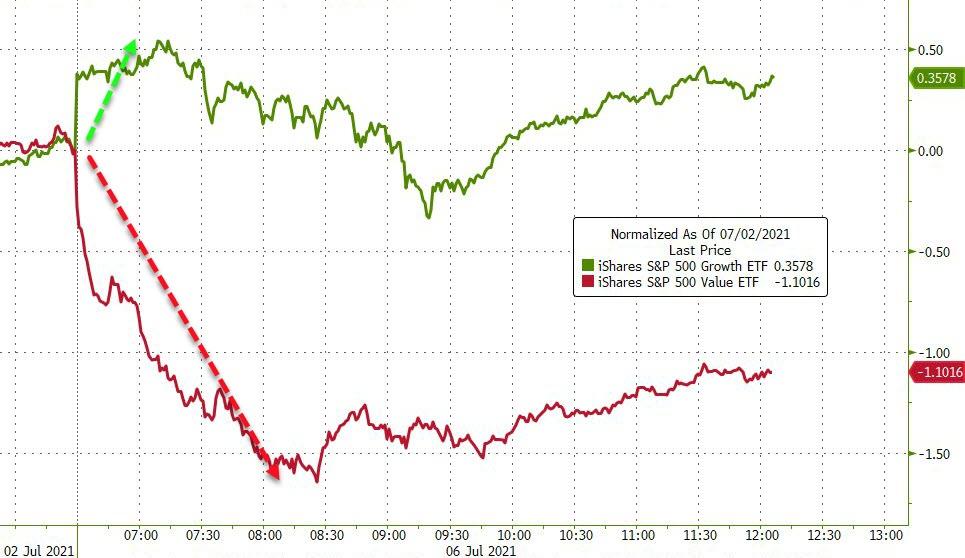
As big tech rallied early on, SmallCaps were again the loser, while “value” stopped the recent bleeding by just about closing unchanged. The US Dollar was engaged in his own roller coaster ride and ended slightly higher.

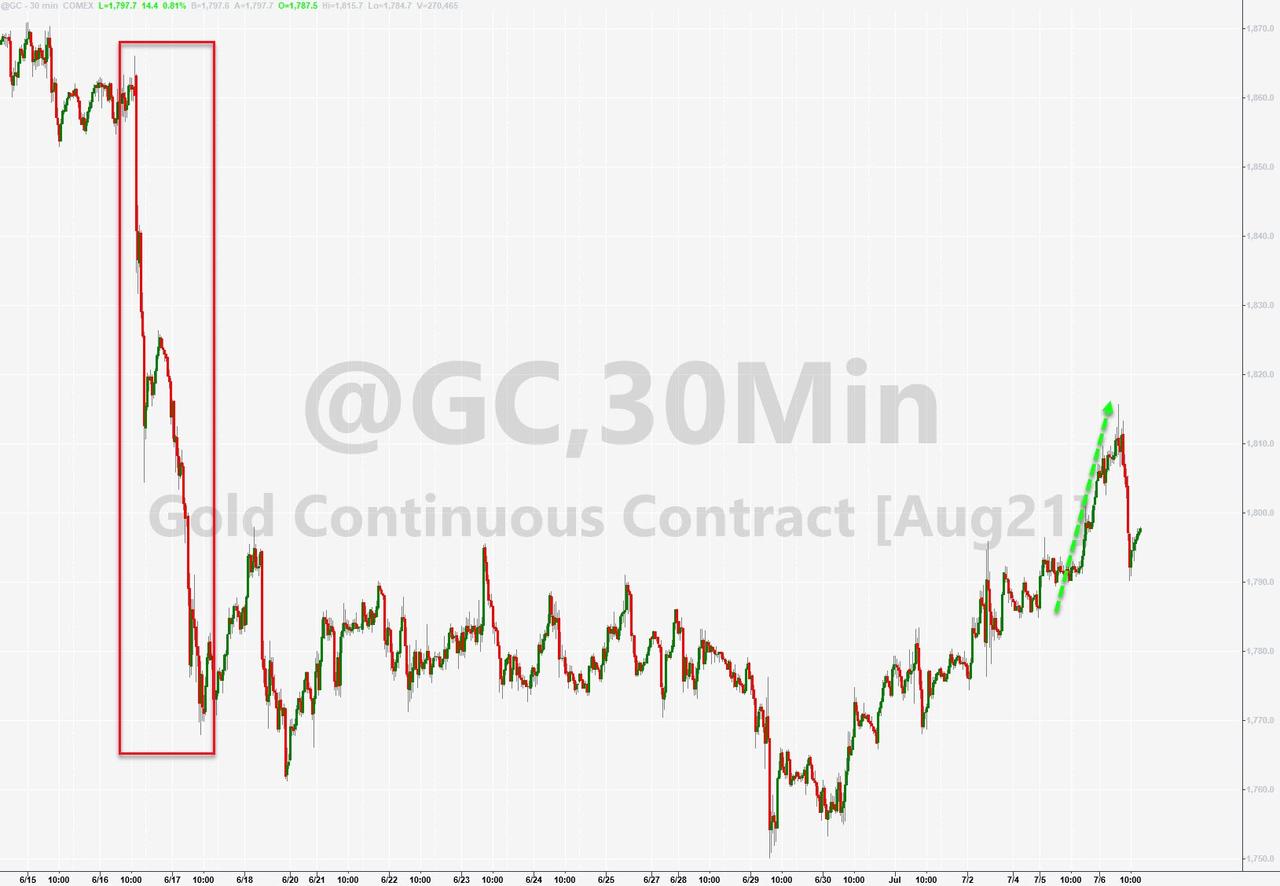
Lower bond yields and a fairly stable US Dollar allowed Gold to not only register a second consecutive day of gains, but also reclaim its $1,800 level, although by only a small margin.

I think the elephant in the room continues to be inflation, but more importantly, once acknowledged by the Fed, what will be their plan of action? Right now, they appear to simply let things ride. But for how long?

Be aware that in the initial stages of an inflationary cycle, equities will benefit. But there comes a point in time, when the rug will be pulled out from under them and show that nothing but hot air has supported this bubble.

Read More
Losing Altitude

Ulli Market Commentary Contact

[Chart courtesy of MarketWatch.com]

  1. Moving the markets

The bullish move into July hit a brick wall this Tuesday, as some sense of reality set in, namely that all good things must come to an end, such as the S&P’s 7-day winning streak, even if only on a temporary basis. Such was the case today, as the major indexes took a dive right after the opening with only the Nasdaq showing signs of strength, which eventually gave way to bearish sentiment.

Nevertheless, the tech sector held up best, while “value” and SmallCaps were clobbered with especially the former taking the brunt of the beating. After this Holiday weekend, concerns rose that we may have seen the best of the economic recovery and that the future may look less bright.

Supporting that view was the Services Index’s (ISM) data tumbling this morning indicating the potential of stagflation, a period defined of higher prices and no growth. This had a huge effect on bond yields with the 10-year diving below the 1.4% level thereby confirming the much-dread “S” word.  

Added CNBC:

Investors are juggling several signs that the rapid economic growth from the depths of the pandemic could be peaking. The ISM Services index, a major gauge of the services sector, slowed to 60.1 in June from a record in the prior month, data released Tuesday showed. Economists polled by Dow Jones expected a print of 63.5. This follows Friday’s jobs report, which showed the unemployment rate rose back up to 5.9% against the 5.6% expectation.

Amusingly, the always optimistic crowd on Wall Street currently has a year-end consensus target of 4,276 for the S&P 500, which represents an approximate 2% loss from current levels. Huh? But these folks have been wrong before, so this symbolizes nothing but groupthink.

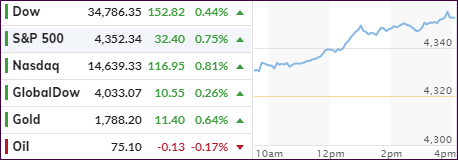
In the end, it was only the Nasdaq, which managed to crawl back above its unchanged line, while the S&P and Dow sported only modest losses after they rebounded off their intra-day lows. Nothing saved SmallCaps and “value.” They simply had a bad day with “growth” clearly coming out on top thanks to crashing bond yields.

Gold had a good day with a +0.79% gain, as the weakness in bond yields overpowered the strength in the US dollar and helped the precious metal to rally but not quite enough to reclaim its $1,800 level.

Read More

ETFs On The Cutline – Updated Through 07/02/2021

Ulli ETFs on the Cutline Contact

Below, please find the latest High-Volume ETF Cutline report, which shows how far above or below their respective long-term trend lines (39-week SMA) my currently tracked ETFs are positioned.

This report covers the HV ETF Master List from Thursday’s StatSheet and includes 312 High Volume ETFs, defined as those with an average daily volume of more than $5 million, of which currently 249 (last week 254) are hovering in bullish territory. The yellow line separates those ETFs that are positioned above their trend line (%M/A) from those that have dropped below it.

Take a look:                                                                   

The HV ETF Master Cutline Report

In case you are not familiar with some of the terminology used in the reports, please read the Glossary of Terms. If you missed the original post about the Cutline approach, you can read it here.      

ETF Tracker Newsletter For July 2, 2021

Ulli ETF Tracker Contact

ETF Tracker StatSheet          

You can view the latest version here.

STORMING INTO JULY

[Chart courtesy of MarketWatch.com]

  1. Moving the markets

After the month of June successfully did not validate the adage held my many investors “sell in May and go away,” the major indexes gathered steam and stormed into July setting more records in the process.

On deck today was the jobs report with the headline number showing that 850k of new positions were added during last month. That was better than the expected 706k and ousted the disappointing 559k number from May.

Looking under the hood, it turns out that more than 50% of all job gains were bartenders and teachers, which collectively added 463k seasonally adjusted jobs, as ZeroHedge pointed out.

Traders did not care but simply interpreted this number as an accelerating recovery for the labor market and pushed the S&P 500 to a new all-time high. The tech sector contributed with Apple and Salesforce adding over 1%.

A strategist at Edward Jones saw it this way:

I think it was one of these goldilocks-type of reports, because hiring accelerated — which is a positive sign for the second half and the recovery — but not so much that it would trigger a reaction of an accelerated timeline for the Federal Reserve to start tapering.

In the end, the markets liked today’s numbers, and the bulls were clearly in charge assuming this “not too hot and not too cold” report will not create an environment that could cause the Fed to take away the liquidity punch bowl, as ZH called it.

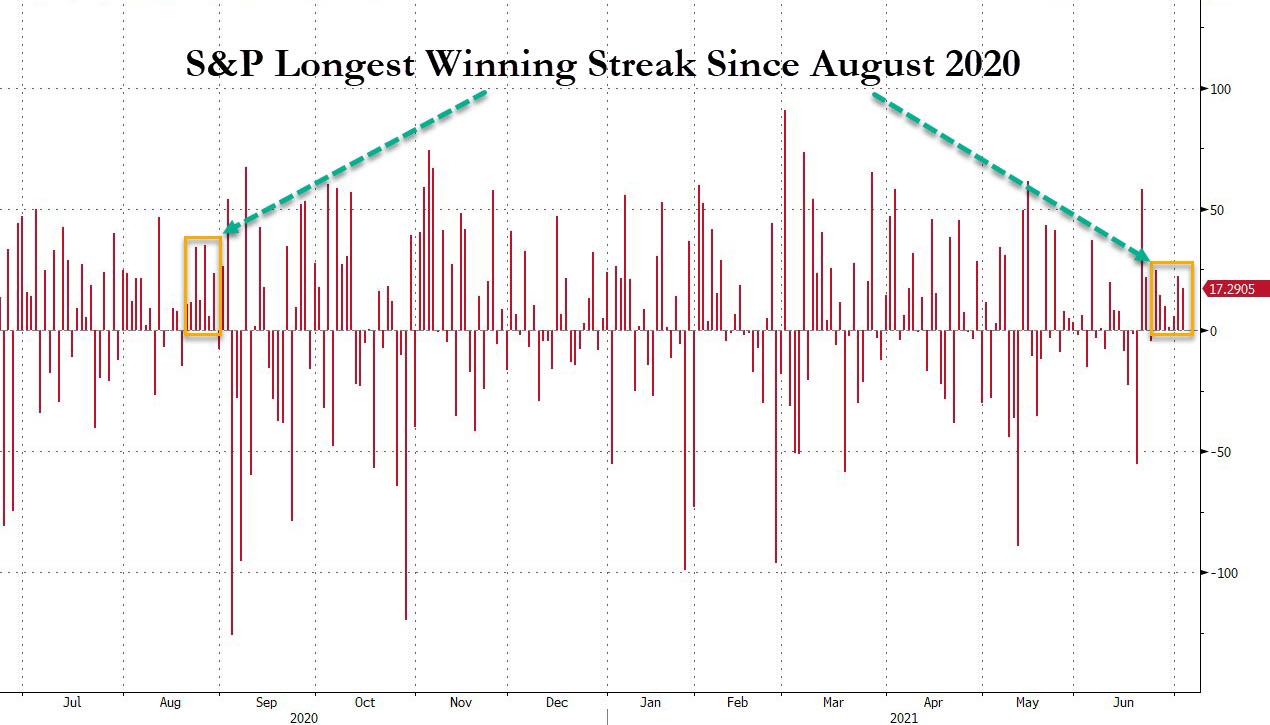
As a result, the S&P 500 rose for a seventh consecutive day, which was its longest winning streak since last August.

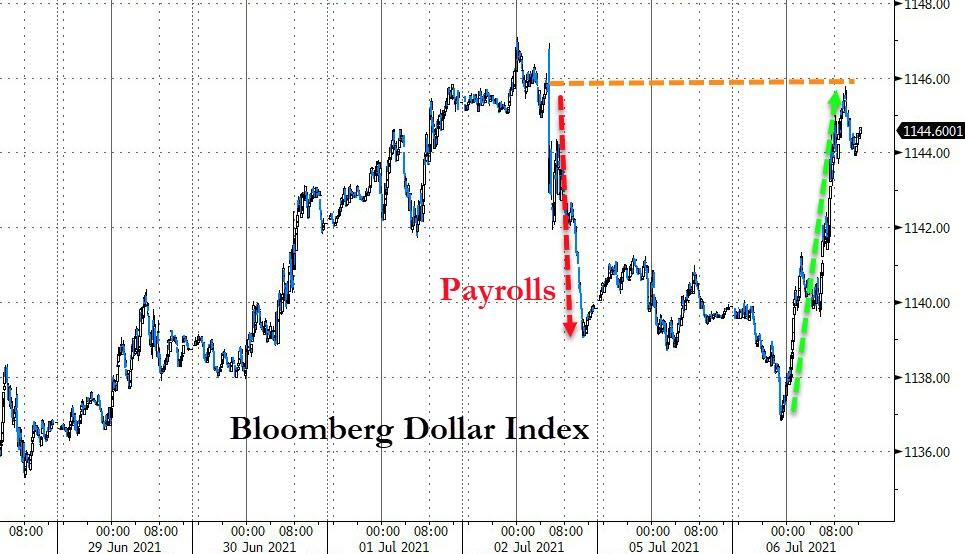
Bond yields continued to drift with the 10-year bouncing off its lows and ending up at 1.437%. The US Dollar Index took a dive, thereby giving Gold a much overdue assist with the precious metal gaining +0.65% but not being able to recover its $1,800 level.

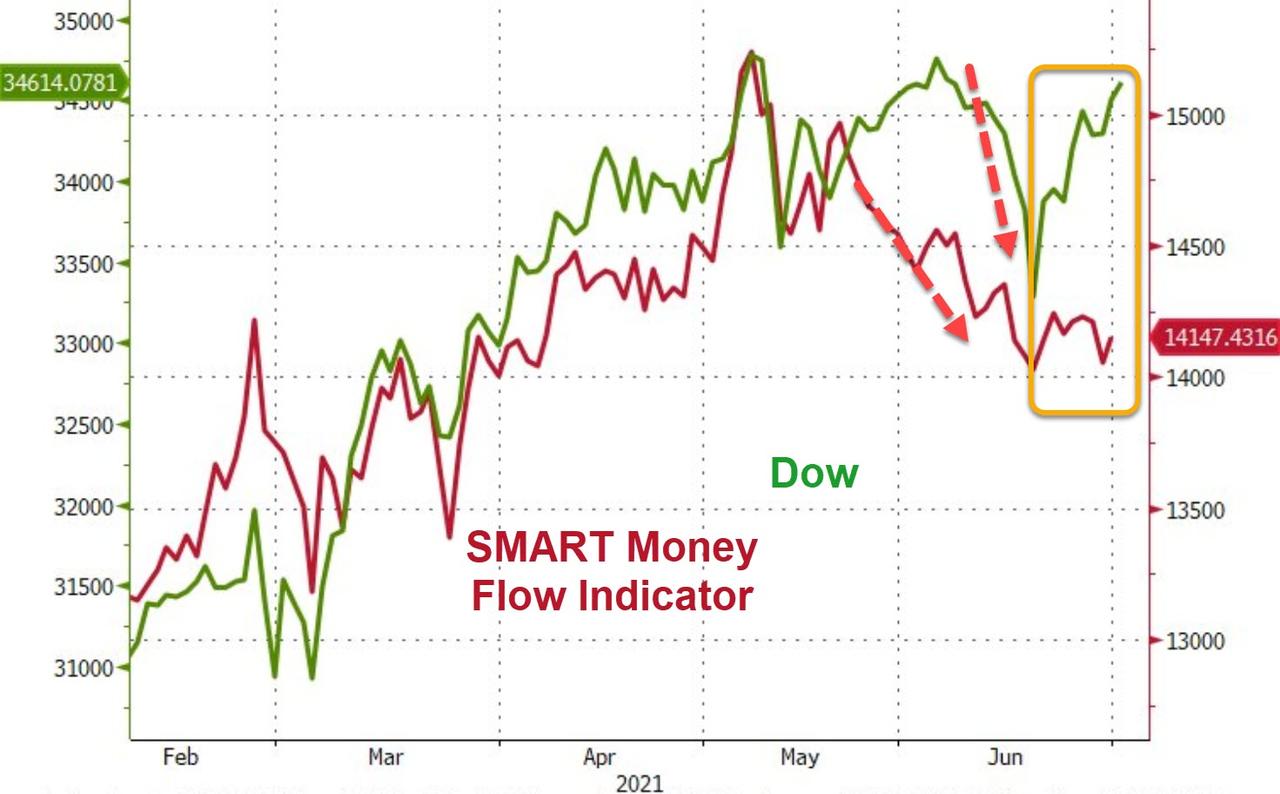
Right now, the bulls are dominating, but for some reason the “smart money” is not participating.

Read More

Weekly StatSheet For The ETF Tracker Newsletter – Updated Through 07/01/2021

Ulli ETF StatSheet Contact

ETF Data updated through Thursday, July 1, 2021

Methodology/Use of this StatSheet:

1. From the universe of over 1,800 ETFs, I have selected only those with a trading volume of over $5 million per day (HV ETFs), so that liquidity and a small bid/ask spread are assured.

2. Trend Tracking Indexes (TTIs)

Buy or Sell decisions for Domestic and International ETFs (section 1 and 2), are made based on the respective TTI and its position either above or below its long-term M/A (Moving Average). A crossing of the trend line from below accompanied by some staying power above constitutes a “Buy” signal. Conversely, a clear break below the line constitutes a “Sell” signal. Additionally, I use an 8% trailing stop loss on all positions in these categories to control downside risk.

3. All other investment arenas do not have a TTI and should be traded based on the position of the individual ETF relative to its own respective trend line (%M/A). That’s why those signals are referred to as a “Selective Buy.” In other words, if an ETF crosses its own trendline to the upside, a “Buy” signal is generated. Since these areas tend to be more volatile, I recommend a wider trailing sell stop of 8%-10% depending on your risk tolerance.

If you are unfamiliar with some of the terminology, please see Glossary of Terms and new subscriber information in section 9.     

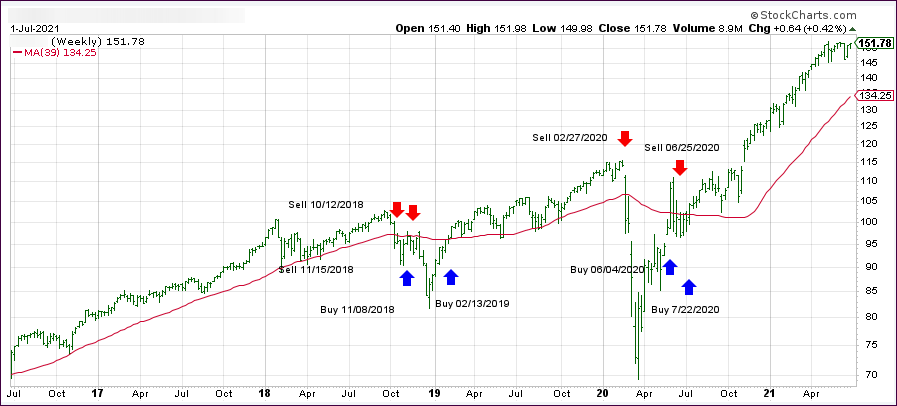
1. DOMESTIC EQUITY ETFs: BUY — since 07/22/2020

Click on chart to enlarge

Our main directional indicator, the Domestic Trend Tracking Index (TTI-green line in the above chart) has now rallied above its long-term trend line (red) by +14.01% and remains in “BUY” mode as posted.

Read More

No Market Commentary

Ulli Uncategorized Contact

I am tied up with a few appointments today and will not able to write the commentary. Regular posting will resume tomorrow.

Ulli…