
- Moving the markets
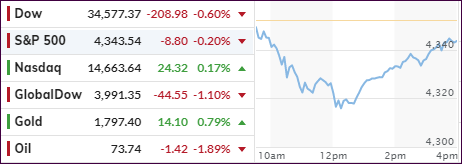
The bullish move into July hit a brick wall this Tuesday, as some sense of reality set in, namely that all good things must come to an end, such as the S&P’s 7-day winning streak, even if only on a temporary basis. Such was the case today, as the major indexes took a dive right after the opening with only the Nasdaq showing signs of strength, which eventually gave way to bearish sentiment.
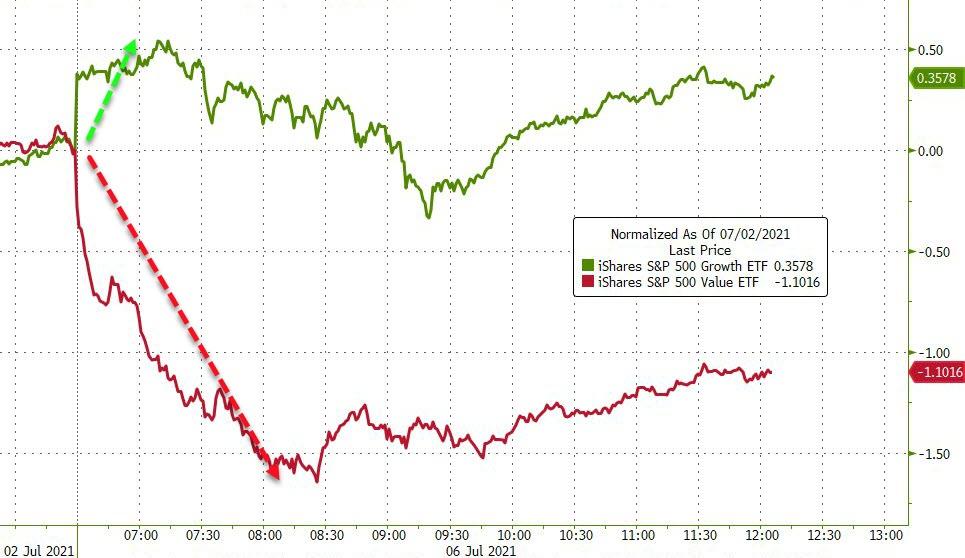
Nevertheless, the tech sector held up best, while “value” and SmallCaps were clobbered with especially the former taking the brunt of the beating. After this Holiday weekend, concerns rose that we may have seen the best of the economic recovery and that the future may look less bright.
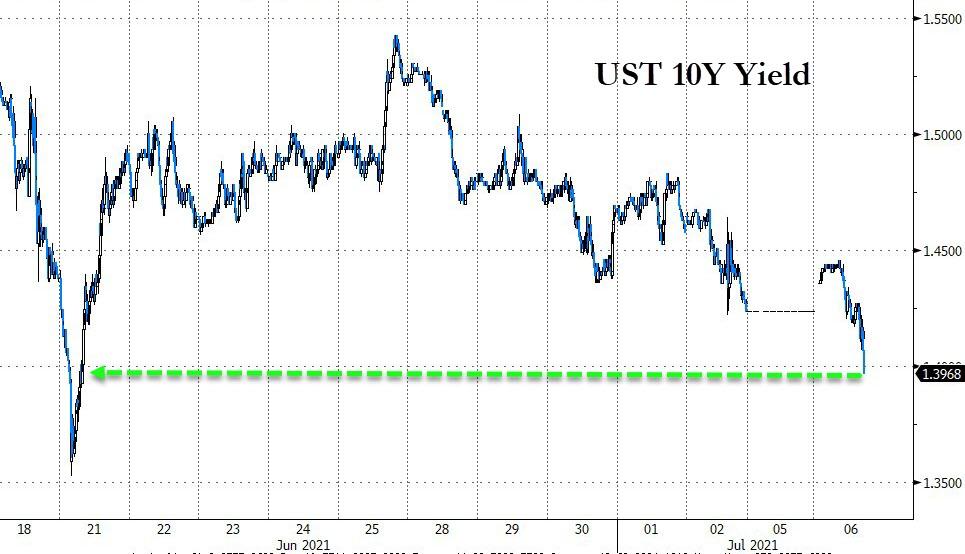
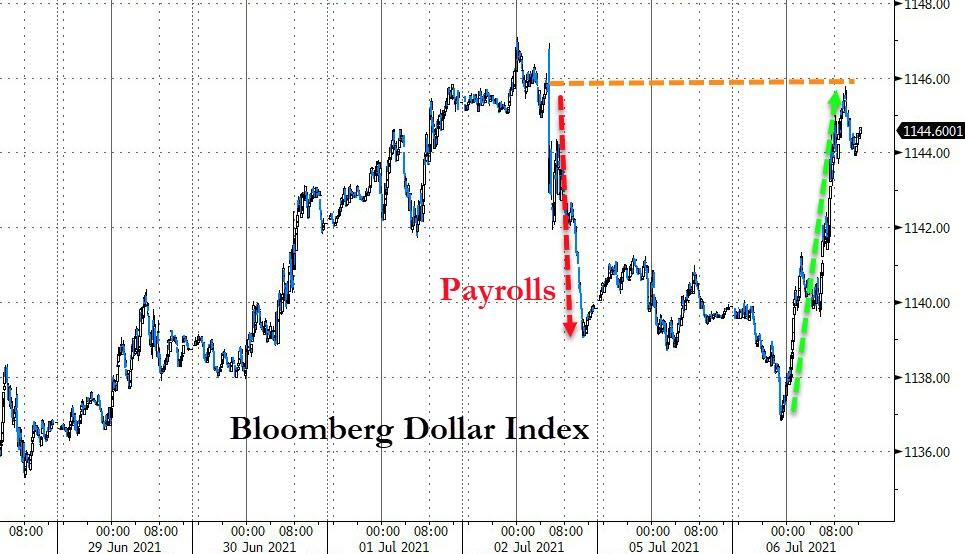
Supporting that view was the Services Index’s (ISM) data tumbling this morning indicating the potential of stagflation, a period defined of higher prices and no growth. This had a huge effect on bond yields with the 10-year diving below the 1.4% level thereby confirming the much-dread “S” word.
Added CNBC:
Investors are juggling several signs that the rapid economic growth from the depths of the pandemic could be peaking. The ISM Services index, a major gauge of the services sector, slowed to 60.1 in June from a record in the prior month, data released Tuesday showed. Economists polled by Dow Jones expected a print of 63.5. This follows Friday’s jobs report, which showed the unemployment rate rose back up to 5.9% against the 5.6% expectation.
Amusingly, the always optimistic crowd on Wall Street currently has a year-end consensus target of 4,276 for the S&P 500, which represents an approximate 2% loss from current levels. Huh? But these folks have been wrong before, so this symbolizes nothing but groupthink.
In the end, it was only the Nasdaq, which managed to crawl back above its unchanged line, while the S&P and Dow sported only modest losses after they rebounded off their intra-day lows. Nothing saved SmallCaps and “value.” They simply had a bad day with “growth” clearly coming out on top thanks to crashing bond yields.
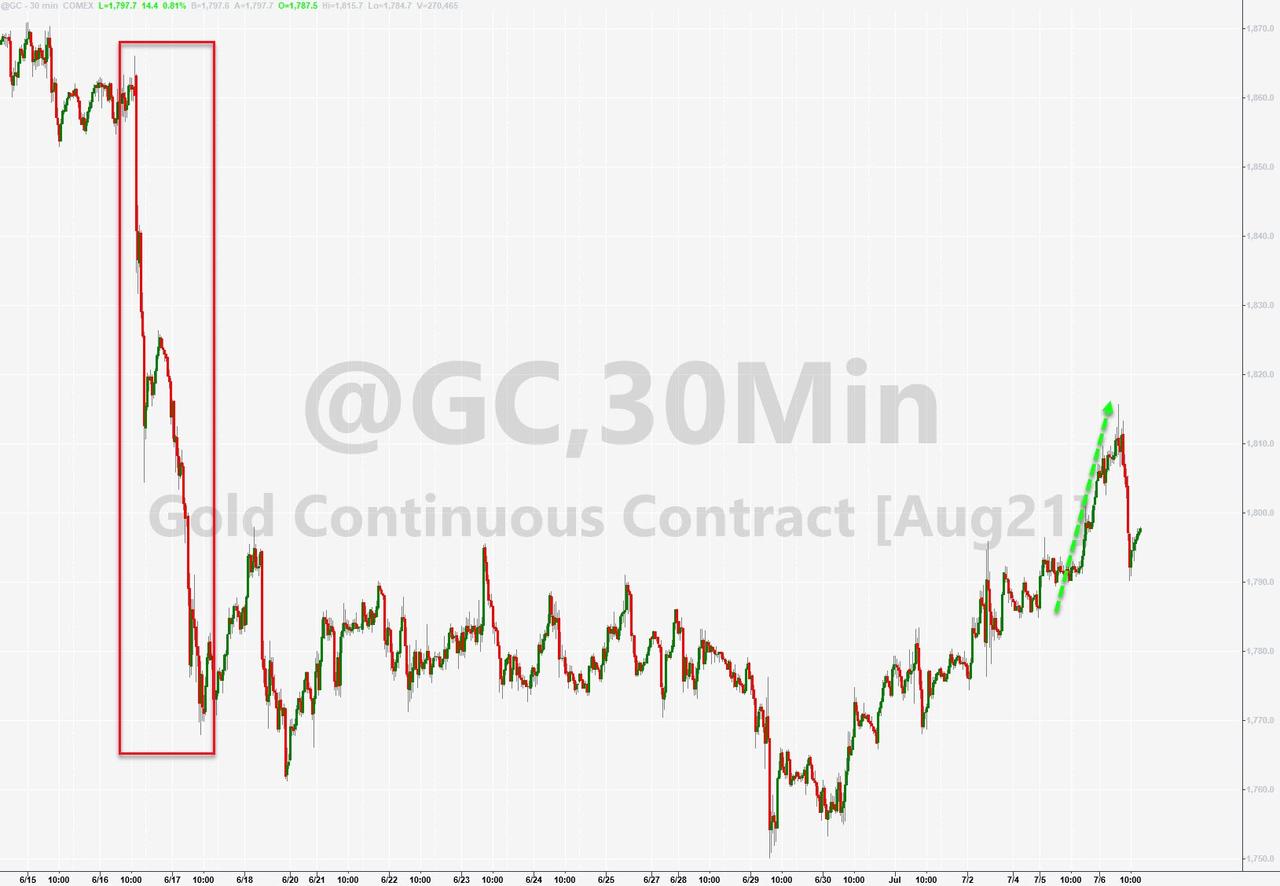
Gold had a good day with a +0.79% gain, as the weakness in bond yields overpowered the strength in the US dollar and helped the precious metal to rally but not quite enough to reclaim its $1,800 level.
2. ETFs in the Spotlight
In case you missed the announcement and description of this section, you can read it here again.
It features some of the 10 broadly diversified domestic and sector ETFs from my HighVolume list as posted every Saturday. Furthermore, they are screened for the lowest MaxDD% number meaning they have been showing better resistance to temporary sell offs than all others over the past year.
The below table simply demonstrates the magnitude with which these ETFs are fluctuating above or below their respective individual trend lines (%+/-M/A). A break below, represented by a negative number, shows weakness, while a break above, represented by a positive percentage, shows strength.
For hundreds of ETF choices, be sure to reference Thursday’s StatSheet.
For this current domestic “Buy” cycle, here’s how some our candidates have fared:
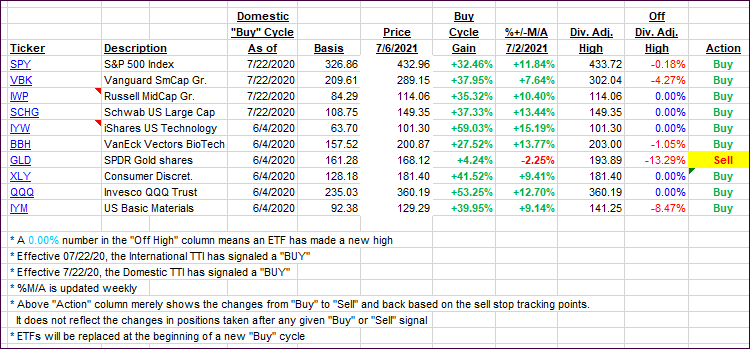
Click image to enlarge.
Again, the %+/-M/A column above shows the position of the various ETFs in relation to their respective long-term trend lines, while the trailing sell stops are being tracked in the “Off High” column. The “Action” column will signal a “Sell” once the -8% point has been taken out in the “Off High” column. For more volatile sector ETFs, the trigger point is -10%.
3. Trend Tracking Indexes (TTIs)
Our TTIs retreated with the broad market.
This is how we closed 07/6/2021:
Domestic TTI: +12.39% above its M/A (prior close +13.38%)—Buy signal effective 07/22/2020.
International TTI: +9.18% above its M/A (prior close +10.33%)—Buy signals effective 07/22/2020.
Disclosure: I am obliged to inform you that I, as well as my advisory clients, own some of the ETFs listed in the above table. Furthermore, they do not represent a specific investment recommendation for you, they merely show which ETFs from the universe I track are falling within the specified guidelines.
All linked charts above are courtesy of Bloomberg via ZeroHedge.
Contact Ulli