
- Moving the markets
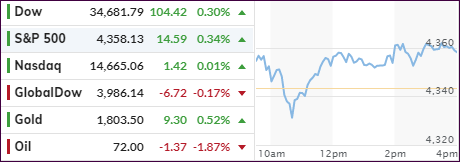
An initial bounce hit a brick wall and turned into a sudden dive with early gains being eradicated in a hurry. But, as we’ve seen many times before, a late morning rally pulled the major indexes out of a deep hole and pushed them back into the green with the Nasdaq lagging and barely reaching its unchanged line.
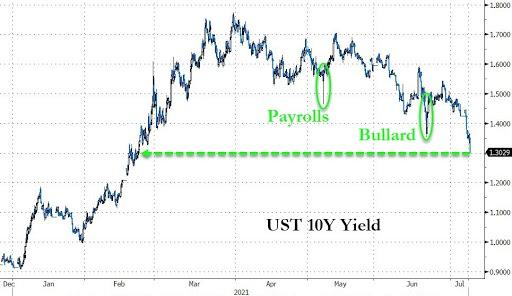
The S&P 500 touched new record territory but backed off into the close. In defiance of many predictions by “experts,” bond yields continued to tank, as the meme, that “peak economic growth” might have already happened, continued, with the 10-year yield now closing at 1.316%, its lowest level since February 19th.
On the economic front, we learned that, even though Job Openings hit a new record, there are still some 11 million Americans, who are collecting various pandemic emergency unemployment claims, as ZH indicated. Go figure…
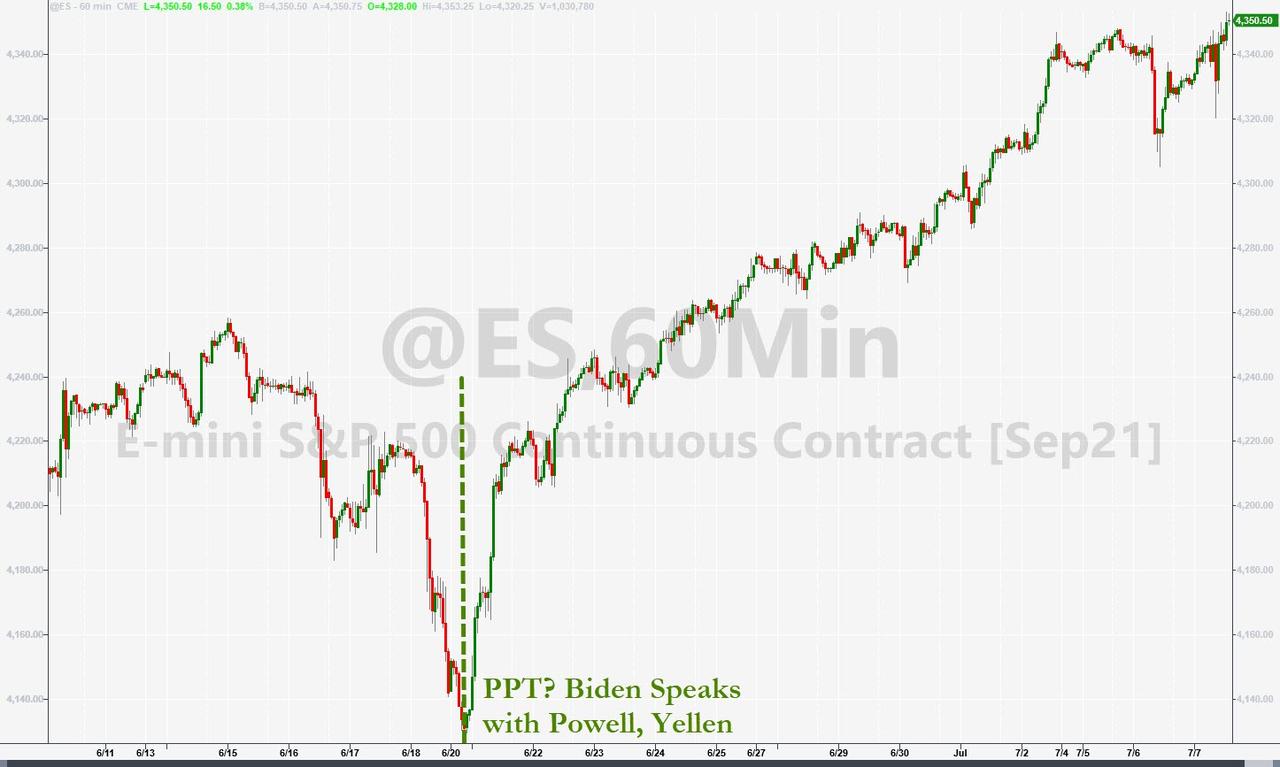
Why did the markets stage a ferocious rebound? While no one has a conclusive answer, ZeroHedge, most likely tongue in cheek, pointed to this graphic explanation.
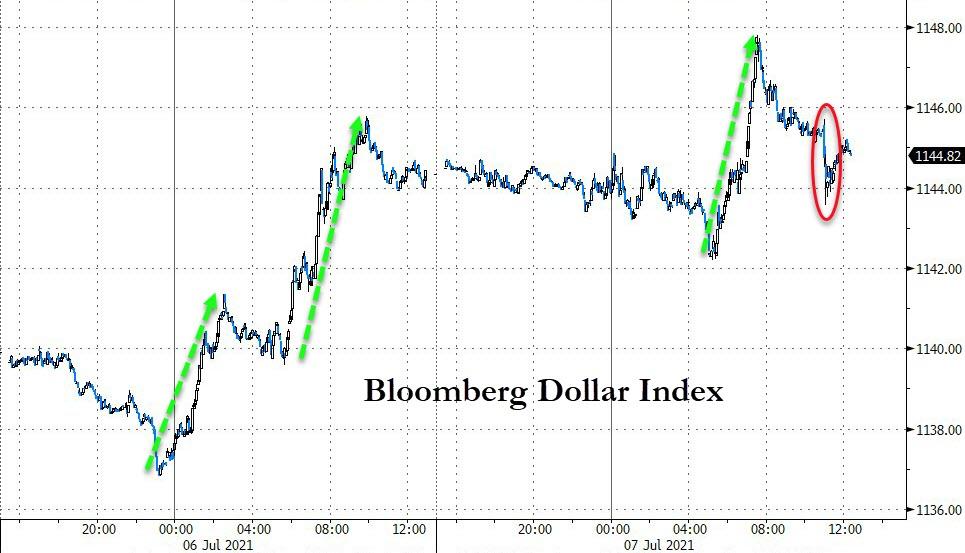
As big tech rallied early on, SmallCaps were again the loser, while “value” stopped the recent bleeding by just about closing unchanged. The US Dollar was engaged in his own roller coaster ride and ended slightly higher.
Lower bond yields and a fairly stable US Dollar allowed Gold to not only register a second consecutive day of gains, but also reclaim its $1,800 level, although by only a small margin.
I think the elephant in the room continues to be inflation, but more importantly, once acknowledged by the Fed, what will be their plan of action? Right now, they appear to simply let things ride. But for how long?
Be aware that in the initial stages of an inflationary cycle, equities will benefit. But there comes a point in time, when the rug will be pulled out from under them and show that nothing but hot air has supported this bubble.
2. ETFs in the Spotlight
In case you missed the announcement and description of this section, you can read it here again.
It features some of the 10 broadly diversified domestic and sector ETFs from my HighVolume list as posted every Saturday. Furthermore, they are screened for the lowest MaxDD% number meaning they have been showing better resistance to temporary sell offs than all others over the past year.
The below table simply demonstrates the magnitude with which these ETFs are fluctuating above or below their respective individual trend lines (%+/-M/A). A break below, represented by a negative number, shows weakness, while a break above, represented by a positive percentage, shows strength.
For hundreds of ETF choices, be sure to reference Thursday’s StatSheet.
For this current domestic “Buy” cycle, here’s how some our candidates have fared:
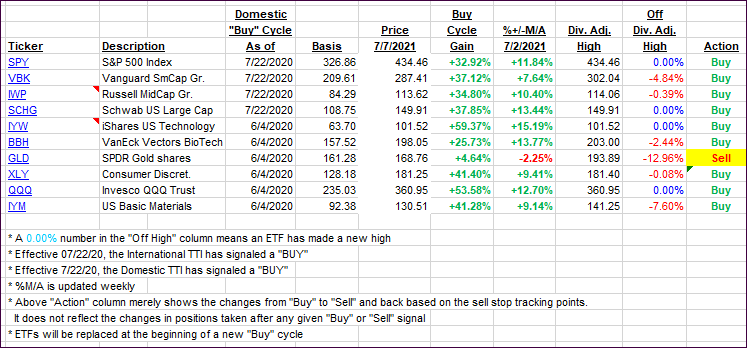
Click image to enlarge.
Again, the %+/-M/A column above shows the position of the various ETFs in relation to their respective long-term trend lines, while the trailing sell stops are being tracked in the “Off High” column. The “Action” column will signal a “Sell” once the -8% point has been taken out in the “Off High” column. For more volatile sector ETFs, the trigger point is -10%.
3. Trend Tracking Indexes (TTIs)
Our TTIs offered a mixed picture with the Domestic one gaining and the International one fading.
This is how we closed 07/7/2021:
Domestic TTI: +12.65% above its M/A (prior close +12.39%)—Buy signal effective 07/22/2020.
International TTI: +9.05% above its M/A (prior close +9.18%)—Buy signals effective 07/22/2020.
Disclosure: I am obliged to inform you that I, as well as my advisory clients, own some of the ETFs listed in the above table. Furthermore, they do not represent a specific investment recommendation for you, they merely show which ETFs from the universe I track are falling within the specified guidelines.
All linked charts above are courtesy of Bloomberg via ZeroHedge.
Contact Ulli