Inflation Fears Dominate Strong Earnings

Ulli Market Commentary Contact

[Chart courtesy of MarketWatch.com]

  1. Moving the markets

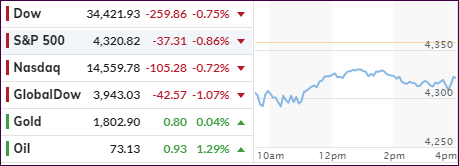
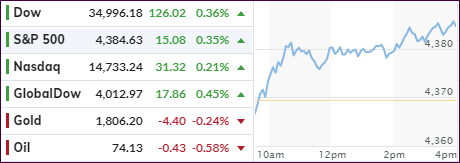
An early trounce was followed by quick bounce, but upward momentum could not be sustained, and the impact of the inflation report proved to be stronger than some of the positive early earnings results. The three major indexes all closed on the red, albeit by a small percentage.

For sure, the inflation numbers turned out to be hotter-than-expected with the CPI increasing by 5.4% in June from a year ago, which was its fastest increase in 13 years, according to the Labor Department.

The Core CPI, excluding food and energy, leaped 4.5%, its sharpest move since 1991, exceeding its estimate of 3.8%. Adding insult to injury were used car prices, which rocketed higher by an amazing 45% YoY.

Of course, as I expected, word on the street spread that all of this will prove to be temporary. Yeah right!

These numbers overshadowed blowout earnings by big banks and PepsiCo and may keep the markets on a leash for the time being, with bond yields getting hit hard as the 10-year spiked to 1.417%.

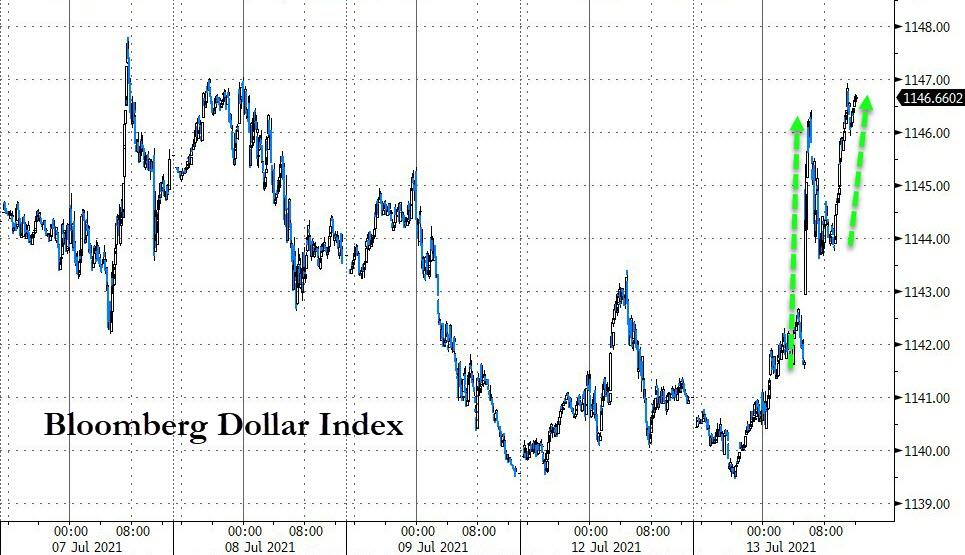
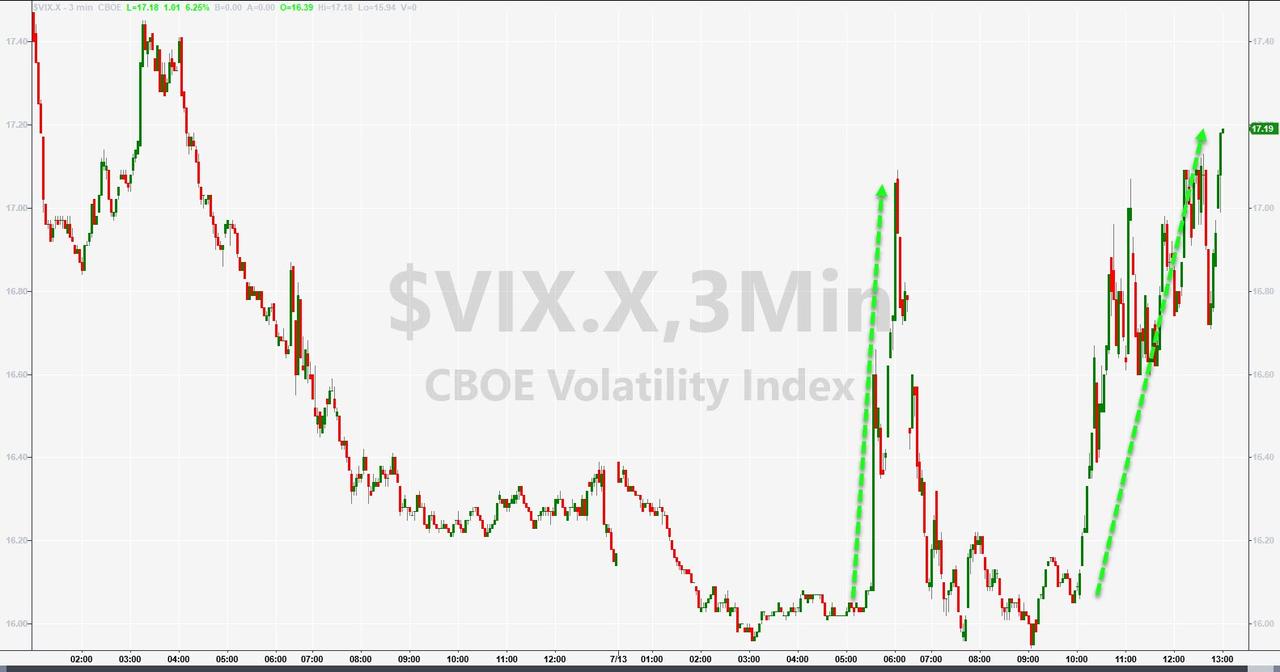
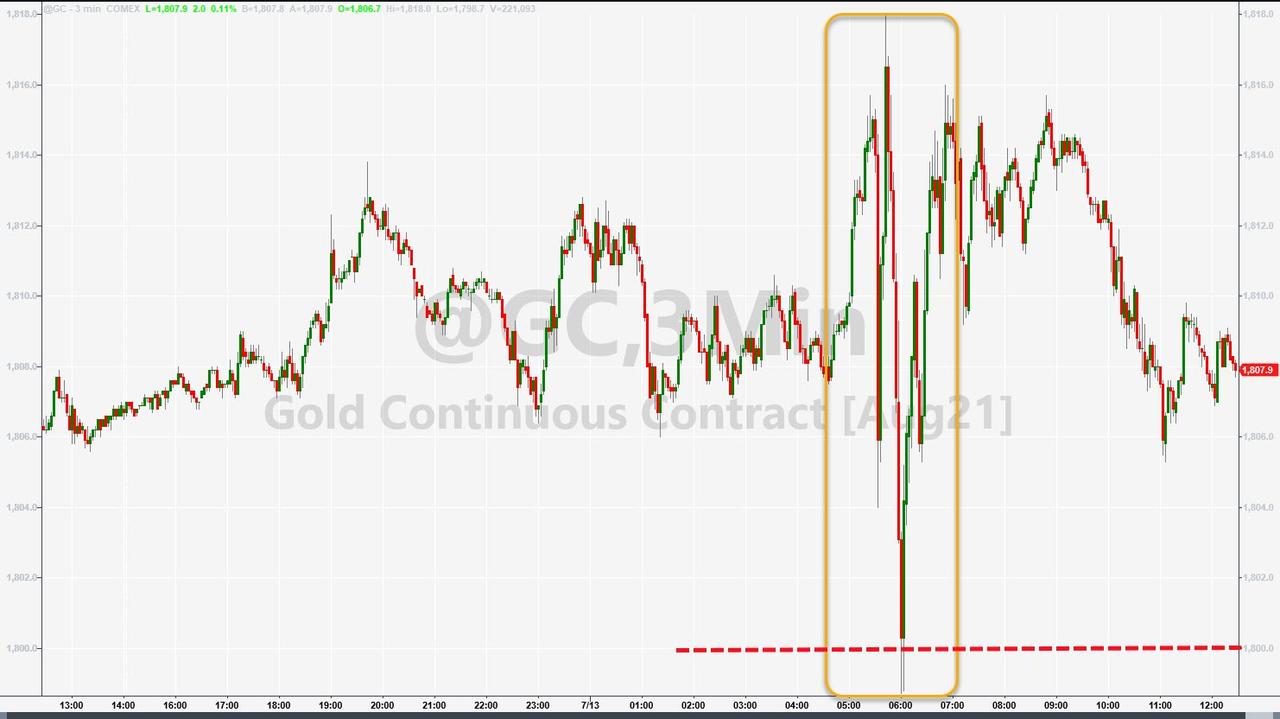
The US Dollar Index surged, dropped, and surged again, as volatility rose and Gold whipsawed. The precious metal ended the session with a slight gain and remained above its $1,800 level.

It was a wild day and created a tug-of-war via opinions that favored inflation to be “transitory” vs. those that see it as a “permanent” companion. My bet is on the latter.

Read More
Maintaining Momentum

Ulli Market Commentary Contact

[Chart courtesy of MarketWatch.com]

  1. Moving the markets

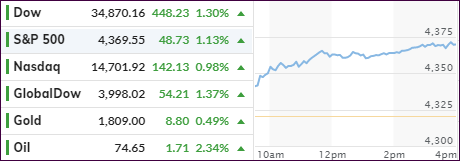
Despite a downside opening, the major indexes regained their upward momentum rather quickly and once climbed above their respective unchanged lines, continued their path to score another winning session.

Support came from positive expectations of the upcoming earnings season, which will start later this week. For sure, some analysts are counting on blockbuster earnings results, but even more important will be the outlook discussion as to what the future might bring.

However, keep in mind, when comparing Q2 earnings of last year with this year, there better be a huge improvement given the pandemic slowdown during 2020. We might see a record growth rate, but it’s a distorted measure due to comparing a now growing economy to one that was in shutdown mode.

We will also have to face important economic data such as key readings on inflation mid-week followed by June retail sales on Friday.

The results were mixed today with value (+0.54%) sprinting ahead of Small Caps (-0.28%), while the Financials (XLF) outperformed the broad indexes with a gain of +0.98%.

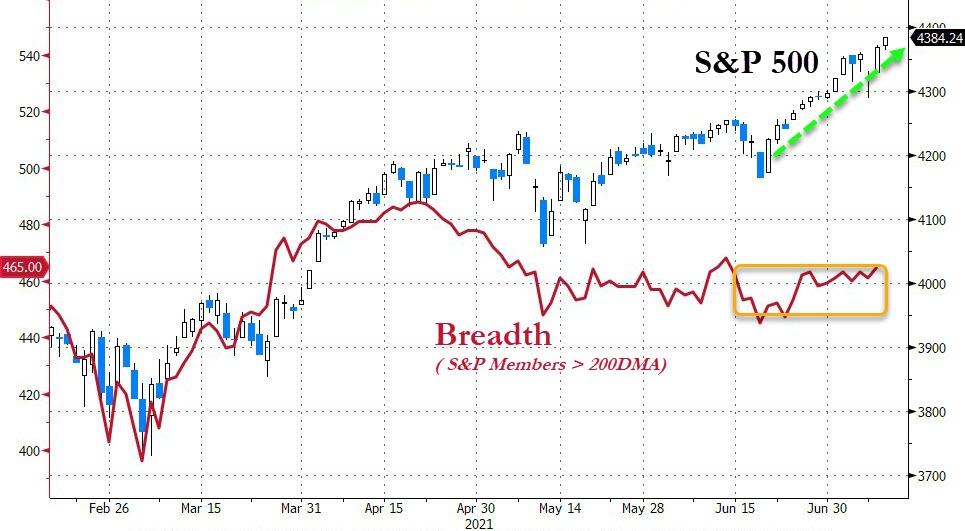
As far as the S&P is concerned, some analysts are seeing warnings signs, as breadth severely lags, meaning that only a minority number of stocks are carrying the load to drive the index higher.

Bond yields and the US Dollar went predominantly sideways with not much gained. Gold slipped slightly but managed to hang on to its $1,800 level.

Read More

ETFs On The Cutline – Updated Through 07/09/2021

Ulli ETFs on the Cutline Contact

Below, please find the latest High-Volume ETF Cutline report, which shows how far above or below their respective long-term trend lines (39-week SMA) my currently tracked ETFs are positioned.

This report covers the HV ETF Master List from Thursday’s StatSheet and includes 312 High Volume ETFs, defined as those with an average daily volume of more than $5 million, of which currently 250 (last week 249) are hovering in bullish territory. The yellow line separates those ETFs that are positioned above their trend line (%M/A) from those that have dropped below it.

Take a look:                                                                   

The HV ETF Master Cutline Report

In case you are not familiar with some of the terminology used in the reports, please read the Glossary of Terms. If you missed the original post about the Cutline approach, you can read it here.      

ETF Tracker Newsletter For July 9, 2021

Ulli ETF Tracker Contact

ETF Tracker StatSheet          

You can view the latest version here.

RIP ROARING INTO THE WEEKEND

[Chart courtesy of MarketWatch.com]

  1. Moving the markets

Despite weakness during this Holiday shortened week, stocks found their upside momentum again, right after the opening bell, and went on a rampage thereby leaving the bears in the dust by scoring solid gains across the board.

The major indexes not only recovered but notched record closes leaving previous losses as nothing but a vanishing point in the rearview mirror. The Dow led the charge, and the Nasdaq lagged for the session.

All former concerns, like slumping bond yields because of reduced economic activity, the Delta Covid variant, as well as a slowdown in the labor market were either ignored, brushed aside or simply forgotten, and no longer mattered, at least on this week-ending Friday.

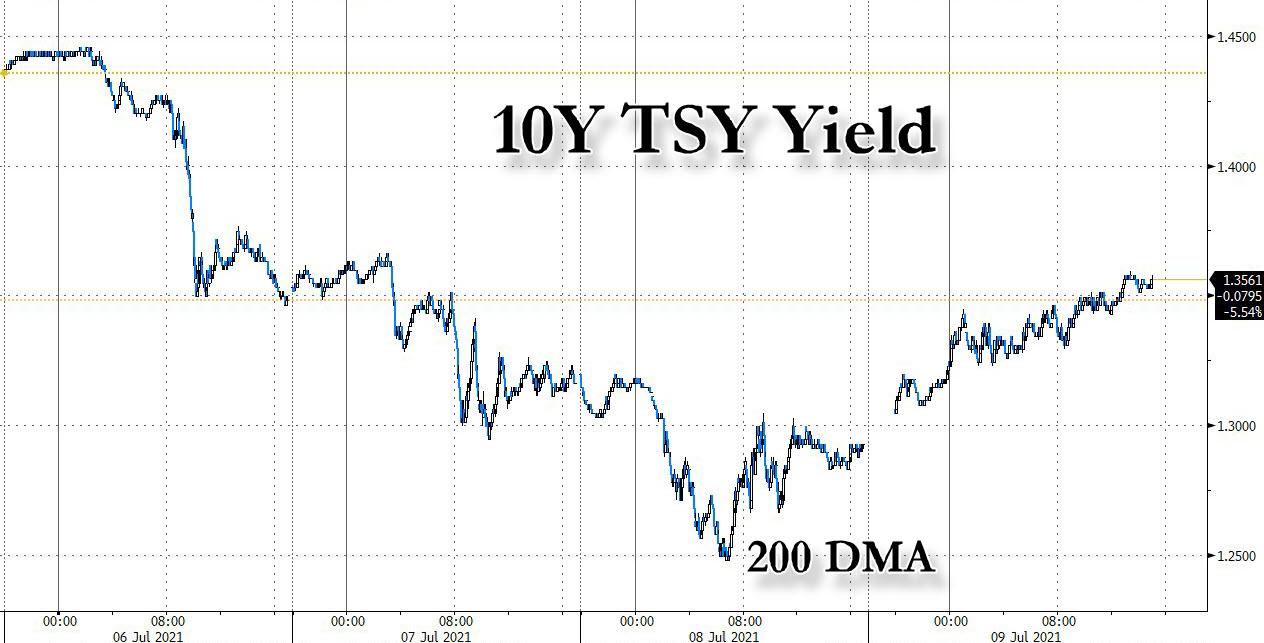
Helping stocks surge was the rebound in yields with the 10-year moving higher and closing at 1.36%, which is 10 basis points off yesterday’s lows. Also helping markets was a dovish announcement by China that the PBOC would cut rates by 0.5 basis points offsetting fears of continued deleveraging, as Zero Hedge explained it.

The US Dollar index slipped -0.34% and helped gold to score another win of +0.49%, which kept the precious metal above its $1,800 resistance level, but only by a small margin.

This topsy turvy week is in the books, and the major indexes managed to crawl back into the plus after having taken a licking on Thursday. If economic forecasts remain positive, we might see a continuation of this rebound effort.

Read More

Weekly StatSheet For The ETF Tracker Newsletter – Updated Through 07/08/2021

Ulli ETF StatSheet Contact

ETF Data updated through Thursday, July 8, 2021

Methodology/Use of this StatSheet:

1. From the universe of over 1,800 ETFs, I have selected only those with a trading volume of over $5 million per day (HV ETFs), so that liquidity and a small bid/ask spread are assured.

2. Trend Tracking Indexes (TTIs)

Buy or Sell decisions for Domestic and International ETFs (section 1 and 2), are made based on the respective TTI and its position either above or below its long-term M/A (Moving Average). A crossing of the trend line from below accompanied by some staying power above constitutes a “Buy” signal. Conversely, a clear break below the line constitutes a “Sell” signal. Additionally, I use an 8% trailing stop loss on all positions in these categories to control downside risk.

3. All other investment arenas do not have a TTI and should be traded based on the position of the individual ETF relative to its own respective trend line (%M/A). That’s why those signals are referred to as a “Selective Buy.” In other words, if an ETF crosses its own trendline to the upside, a “Buy” signal is generated. Since these areas tend to be more volatile, I recommend a wider trailing sell stop of 8%-10% depending on your risk tolerance.

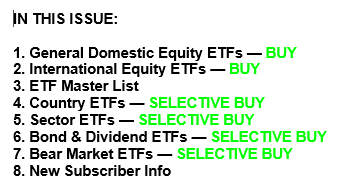
If you are unfamiliar with some of the terminology, please see Glossary of Terms and new subscriber information in section 9.     

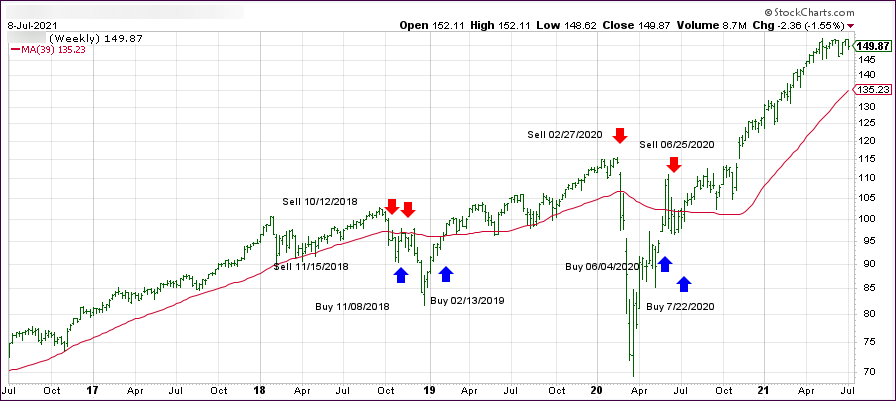
1. DOMESTIC EQUITY ETFs: BUY — since 07/22/2020

Click on chart to enlarge

Our main directional indicator, the Domestic Trend Tracking Index (TTI-green line in the above chart) has now rallied above its long-term trend line (red) by +11.62% and remains in “BUY” mode as posted.

Read More

Battling For Direction

Ulli Market Commentary Contact

[Chart courtesy of MarketWatch.com]

  1. Moving the markets

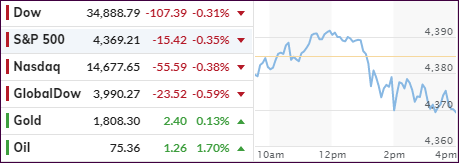
The markets dumped right after the opening as concerns about the economic recovery losing steam went mainstream. No surprise here, as I had mentioned that issue in recent posts and more evidence surfaced this morning.  

Losses accelerated as Japan declared a state of emergency in Tokyo for the upcoming Olympics, and other countries had to deal with a rebound in cases due to Covid variants.

On the economic side, the latest Jobless Data were a downer with the numbers coming in at 373k, higher than expected, and thereby adding to the issue of a slowdown in the labor picture. On the other hand, as I posted yesterday, Job Openings are at a record high, so those without one simply need to get up and apply.

Added one investment advisor:

The market has been in one of those ‘Goldilocks’ stretches when economic growth was accelerating while inflation and interest rates remained low. Increased Covid cases, particularly Delta Variants have caused concerns that the economic acceleration will slow. A few weeks ago, the porridge was too hot, now it seems it is too cold. With markets at all-time highs and some valuations stretched there is little room for economic slowdown in this market.

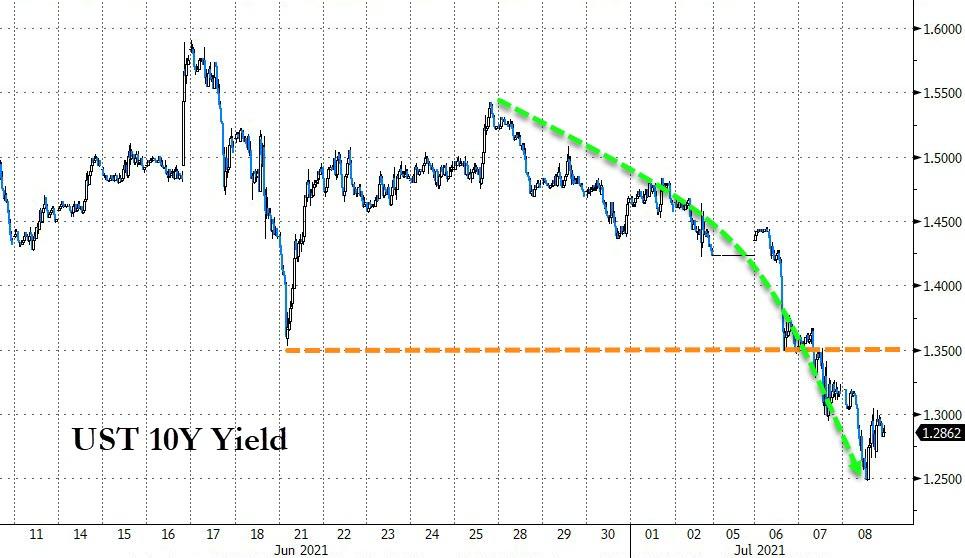
As a result of a potential slowdown, bond yields continued to slip with the 10-year dropping below the 1.30% level, thereby catching a lot of shorts by surprise. Many pros had bet on rising bond yields and not falling ones. Covering those short positions by buying them back created a vicious cycle by pushing yields even lower.

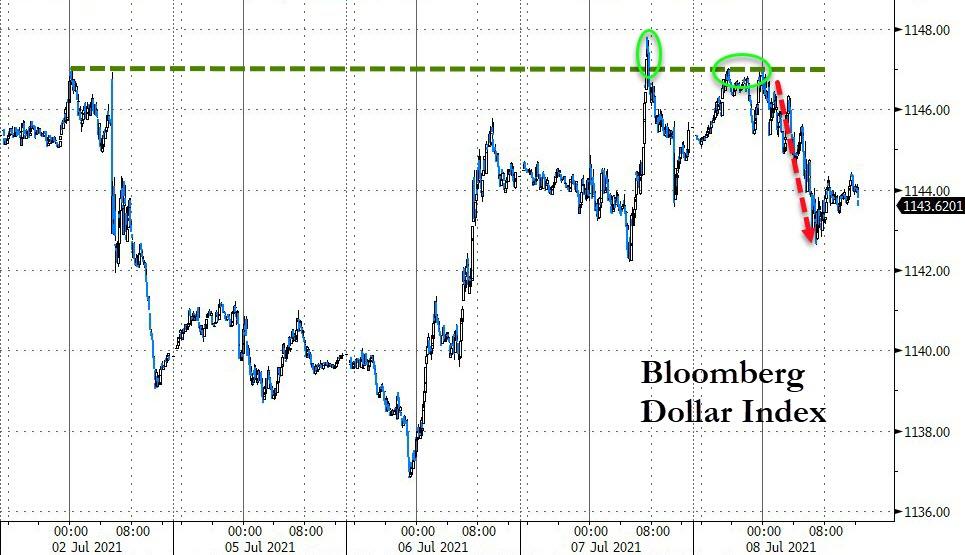
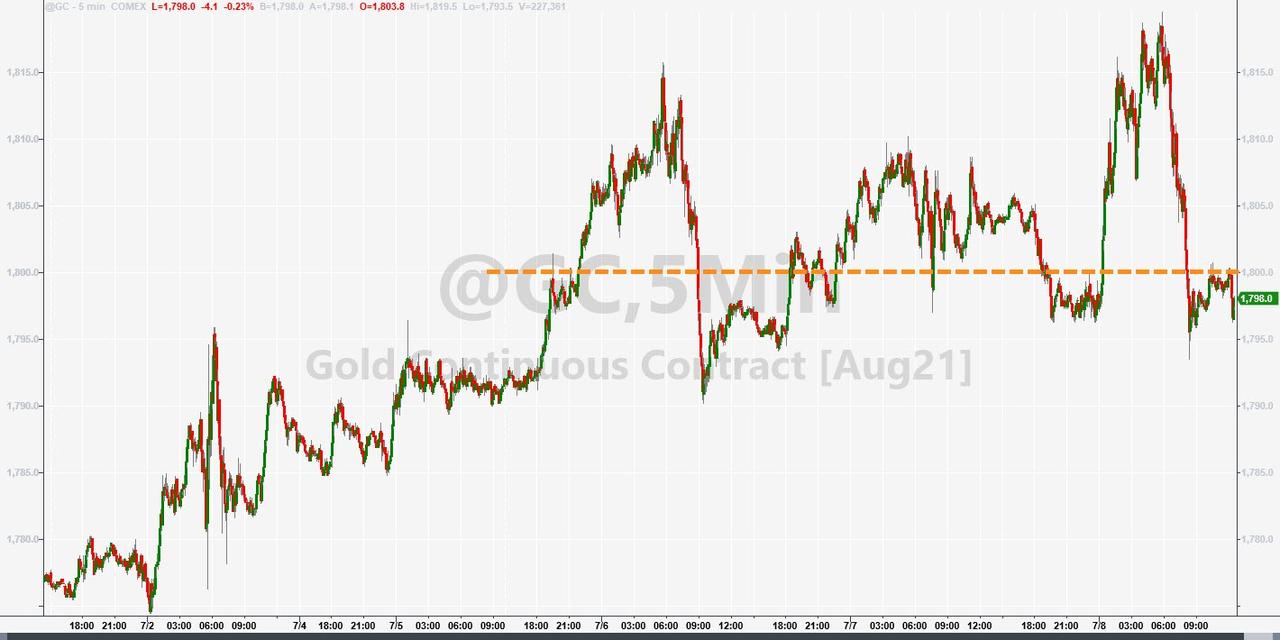
The US Dollar attempted an early breakout but succumbed to selling and closed lower. Today ended up being opposite day as sinking yields and a slipping dollar combined to give gold a boost mid-day, which unfortunately faded, but the precious metal managed to at least successfully defend its $1,800 marker by closing up a scant +0.06%.

We’ve seen abnormal rides in the markets recently, with the major indexes hanging around all-time high territory. The much hoped for “V” shape economic recovery may have pulled us out of the Covid doldrums from last year, but only thanks to the reckless money creation efforts by the Fed. However, right now it appears that those efforts have hit a brick wall.

After all, artificial stimulation can only do so much before organic growth must take over to create a true recovery. Currently, it’s questionable in my mind whether we are on the right path.

Read More