Maintaining Bullish Momentum

Ulli Market Commentary Contact

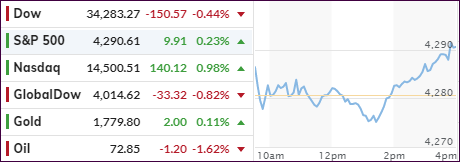
[Chart courtesy of MarketWatch.com]

  1. Moving the markets

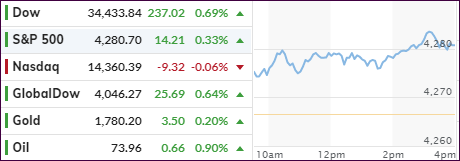
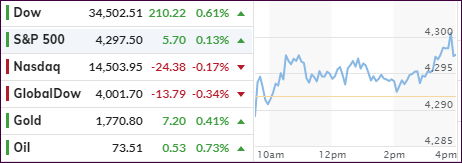
The major indexes continued to vacillate around record territory, as the last day of the month and quarter ended. The Dow took the lead with the S&P 500 lagging and the Nasdaq sinking slightly into the red.  

For June, the S&P 500 managed to eke out again of some 2.2%, despite having dropped into the red during mid-month, yet in the end, the index closed the quarter at a new high. At the same time, it recorded its fifth positive month in a row.

It’s been interesting to observe how traders and investors have simply shrugged off the ever-present and seemingly worsening inflation numbers. All based on the assumption that the economic comeback will proceed as hoped, while the Fed is assumed to continue throwing assists via its loose monetary policies.

So, what usually happens after the markets close out a good first half of the year? CNBC added this comment:

Good first halves for the market usually bode well for the rest of the year. Whenever there has been a double-digit gain in the first half, the Dow and S&P 500 have never ended that year with an annual decline, according to Refinitiv data going back to 1950.

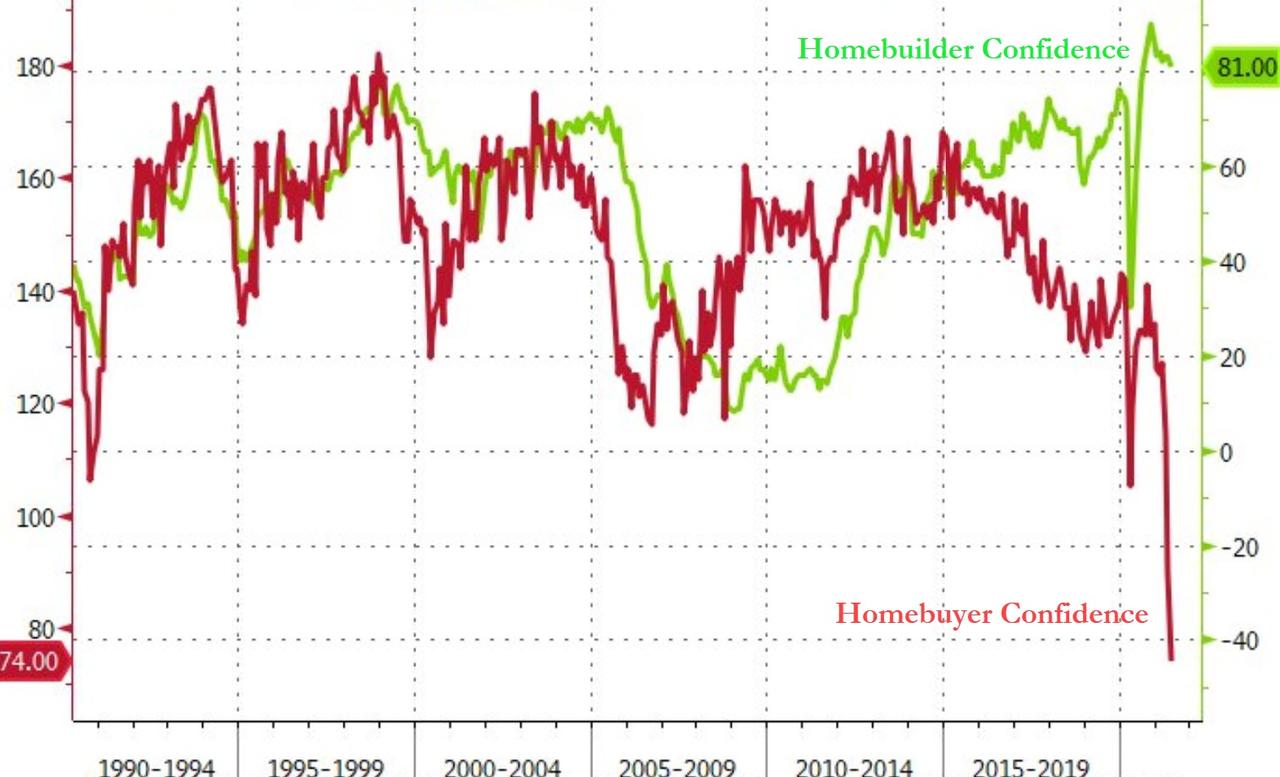
On the economic front, Pending Home Sales picked up some pace and surged in May. However, Mortgage Applications crashed, as we witnessed two opposing forces at work, namely rising Homebuilder Confidence and collapsing Homebuyer Confidence, a battle that most likely will be won by the Homebuyers.

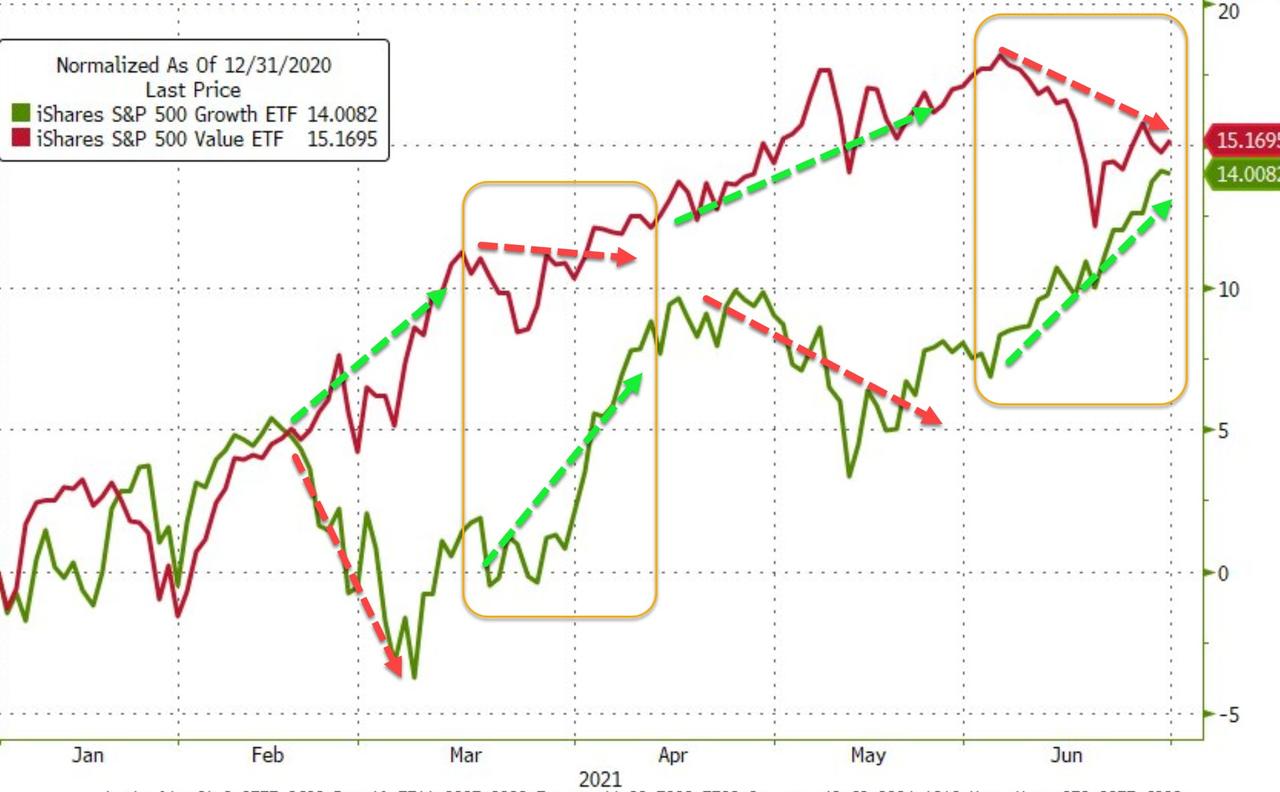
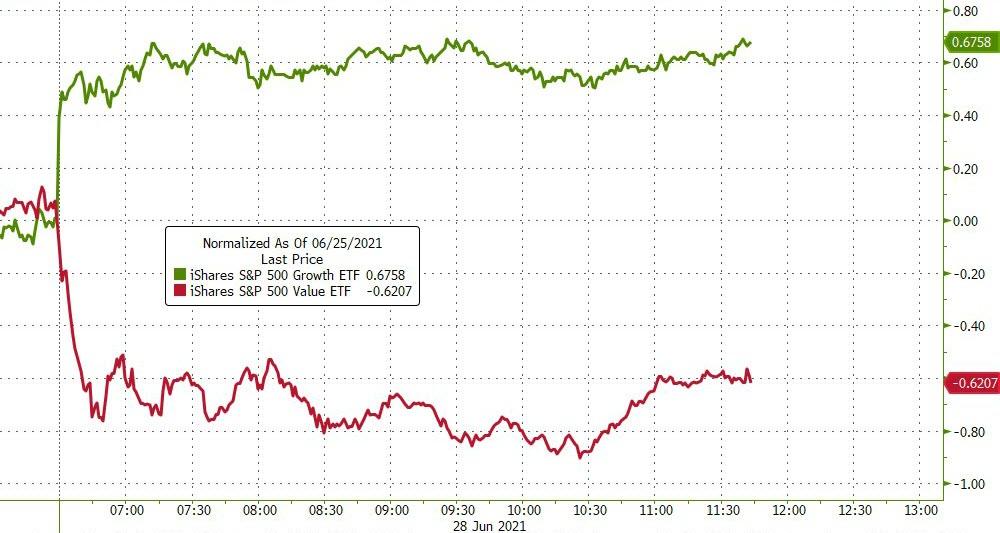
“Growth” and “Value” have been in a skirmish all year with “Value” leading but “Growth” catching up, as Bloomberg’s chart shows.

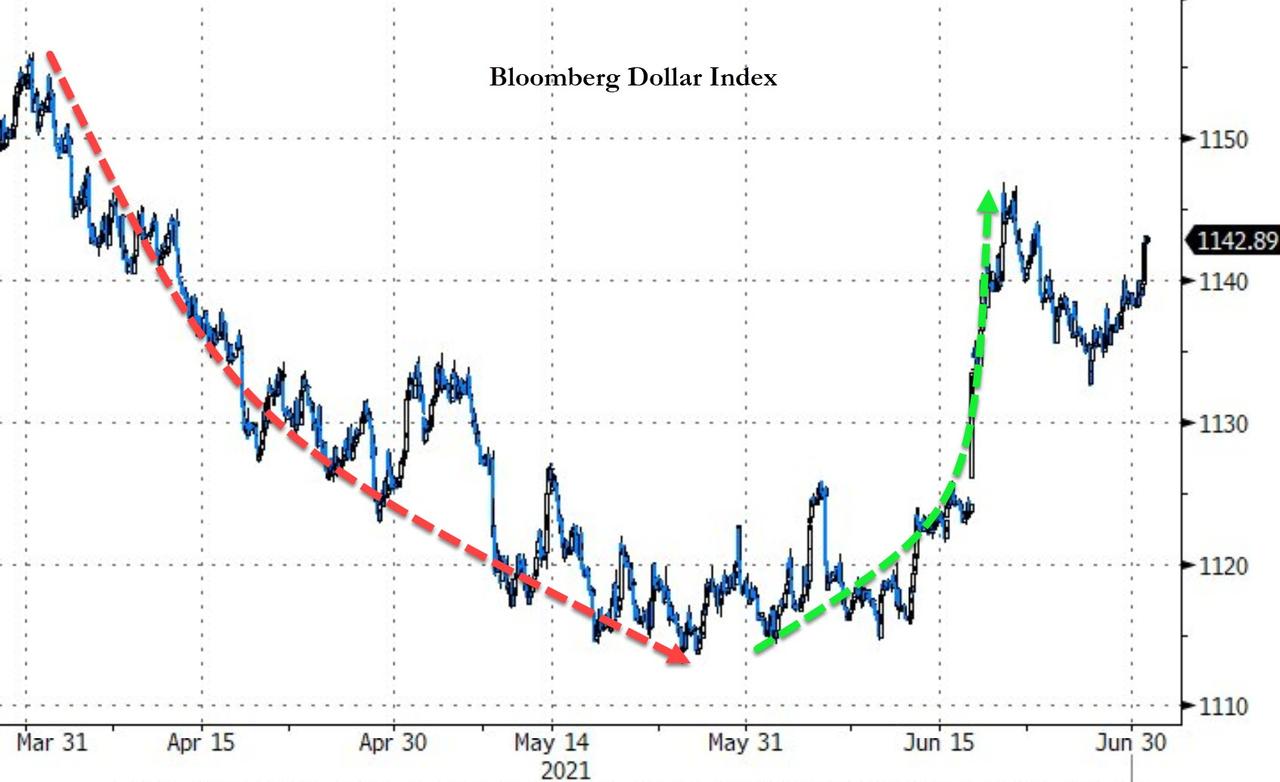
Bond yields offered a mixed picture for this quarter, as the 30-year yield took a dive while the 2-year yield spiked. The US Dollar ended lower for the quarter, despite showing a strong rebound in June.

The question in my mind when looking to the upcoming 3rd quarter is this one: “Will worsening inflation finally force the Fed’s hand to raise interest rates?

Only time will tell.

Read More
Running Out Of Steam

Ulli Market Commentary Contact

[Chart courtesy of MarketWatch.com]

  1. Moving the markets

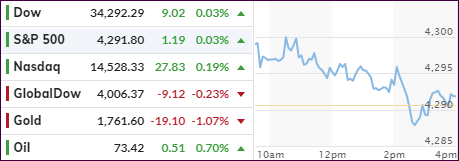
Despite an early morning bounce, the Dow and the S&P 500 succumbed to weakness and gave back most of their initial gains and ended essentially unchanged. The Nasdaq went the other way but managed to climb out of a hole to score a modest gain, after swinging wildly late in the session.

It appeared to be a day of rest for the indexes with low volatility keeping markets in check, despite strong readings form home prices and consumer confidence.

Added CNBC:

The market has churned out a series of record highs in recent weeks, but the gains have been relatively modest, and some strategists have pointed to weak market breadth, measured by the performance of average stocks and the number of individual names making new highs, as a potential area of concern.

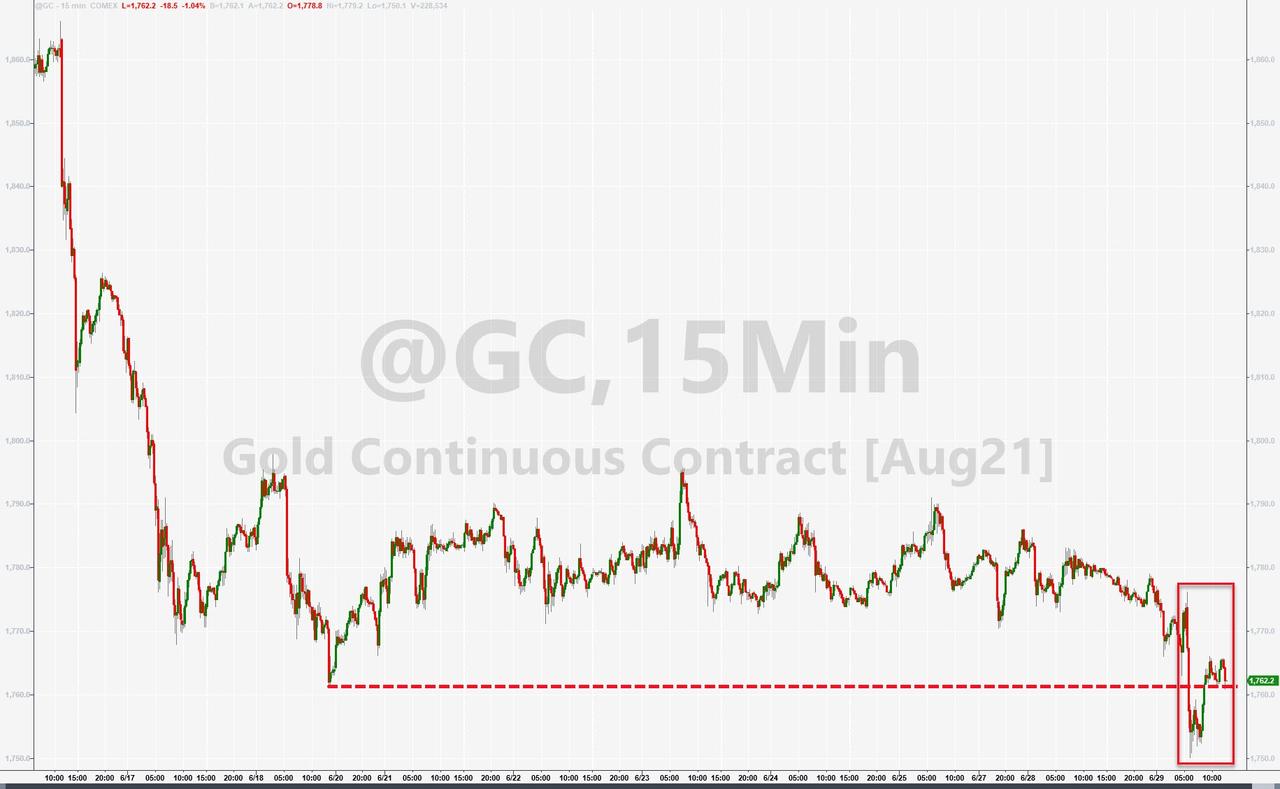
Bond yields rode the rollercoaster and ended slightly down, while the US Dollar Index continued its rebound but failed to take out last week’s highs. None of this action assisted Gold, with the precious metal breaking beneath recent lows but bouncing into the close.

It was another session during which not much was gained and not much was lost.

Read More

Fighting For Leadership

Ulli Market Commentary Contact

[Chart courtesy of MarketWatch.com]

  1. Moving the markets

The overall market struggled for direction except for the Nasdaq, which started the week strong and pushed the index to another all-time high.

The tech sector dominated with Facebook contributing via a 4% jump, after a US court dismissed an antitrust suit against the company.

Semiconductors also showed signs of life, while Boeing headed the wrong way, after issues with regulators could not be resolved, thereby keeping the Dow in the red throughout the session.

The S&P 500 meandered around its unchanged line all day, without making much headway, until a last hour boost pushed the index not only into the green but also into record territory.

Today, “value” got skunked and “growth” got pumped, with RPV giving back some 1.44%, as bond yields plunged after Friday’s spike, a move which totally unraveled today.    

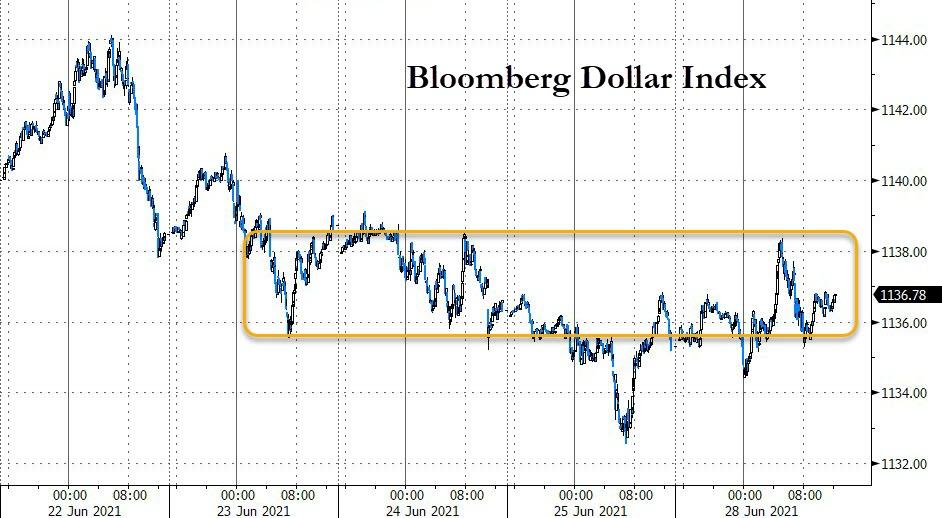
The US Dollar Index did not go anywhere and, in combination with sinking yields helped gold to some early gains, but in the end, it turned more or less into a break even scenario.

With two more trading days to go in June, it looks likely the S&P 500 will score another winning month, despite having briefly dipped into the negative on the 18th, a pullback which was quickly recovered.  

Read More

ETFs On The Cutline – Updated Through 06/25/2021

Ulli ETFs on the Cutline Contact

Below, please find the latest High-Volume ETF Cutline report, which shows how far above or below their respective long-term trend lines (39-week SMA) my currently tracked ETFs are positioned.

This report covers the HV ETF Master List from Thursday’s StatSheet and includes 312 High Volume ETFs, defined as those with an average daily volume of more than $5 million, of which currently 254 (last week 253) are hovering in bullish territory. The yellow line separates those ETFs that are positioned above their trend line (%M/A) from those that have dropped below it.

Take a look:                                                                   

The HV ETF Master Cutline Report

In case you are not familiar with some of the terminology used in the reports, please read the Glossary of Terms. If you missed the original post about the Cutline approach, you can read it here.      

ETF Tracker Newsletter For June 25, 2021

Ulli ETF Tracker Contact

ETF Tracker StatSheet          

You can view the latest version here.

THE BULLISH BEAT GOES ON

[Chart courtesy of MarketWatch.com]

  1. Moving the markets

Last Friday’s market plunge is now being looked at as a vanishing point in the rearview mirror with stocks having picked up their bullish momentum and the S&P 500 rising to another record, while closing out its best week since April.

Despite a slowdown during mid-week, momentum picked up, and we rallied into the weekend supported by traders’ belief that higher inflation will be temporary, as the economy continues to make strides toward a recovery from Covid-19.

Added one senior analyst from Commonwealth Financial:

“This provided support to the Fed’s argument that inflation is transitory and will help allay fears that we are witnessing runaway inflation and should continue to provide support to risk assets such as equities.”

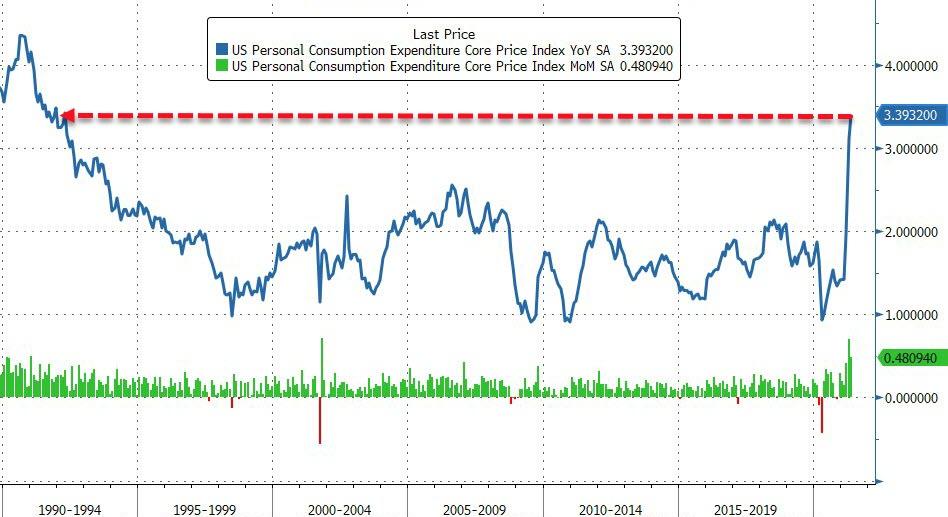
Questioning the accuracy of that belief is Bloomberg’s chart showing that the Fed’s favorite inflation indicator hit a 30-year high, which makes me disagree with the continued jawboning of inflation being transitory.  

Be that as it may, what matters is that the markets appear to be in tune with bullish sentiment causing the rally to go on. The major indexes are all up for the week, with the S&P 500 and Dow adding 2.6% each, while the Nasdaq led with 3.2%.

Bank shares received support from the Fed’s announcement that the banking industry could easily withstand a severe recession, as their annual stress test showed that 23 institutions remain well above minimum capital levels, as CNBC reported. As a result, the financial sector ETF (XLF) rallied 1.21% on the day.

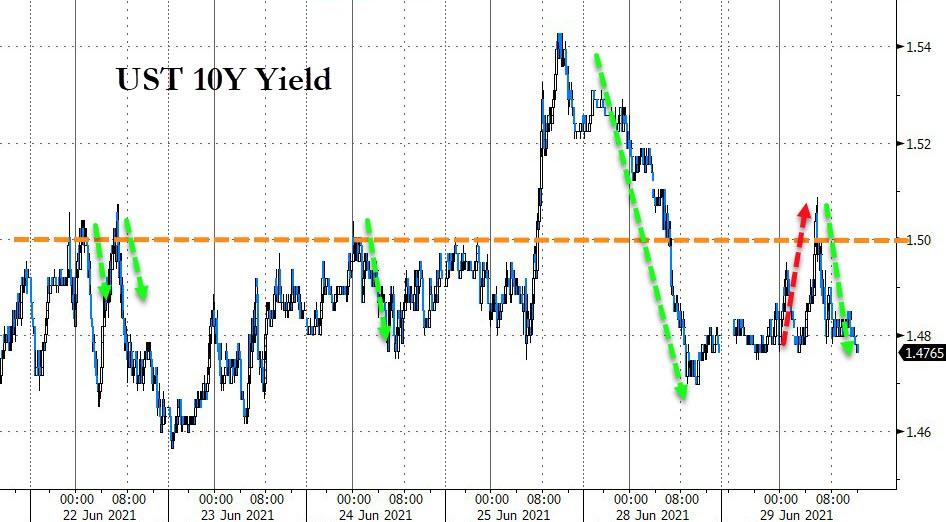
“Value” outperformed “growth” this week, but both showed strong tendencies and flip-flopped back and forth. Bond yields went sideways mid-week and spiked today, as the PCE (Personal Consumption Index) soared.

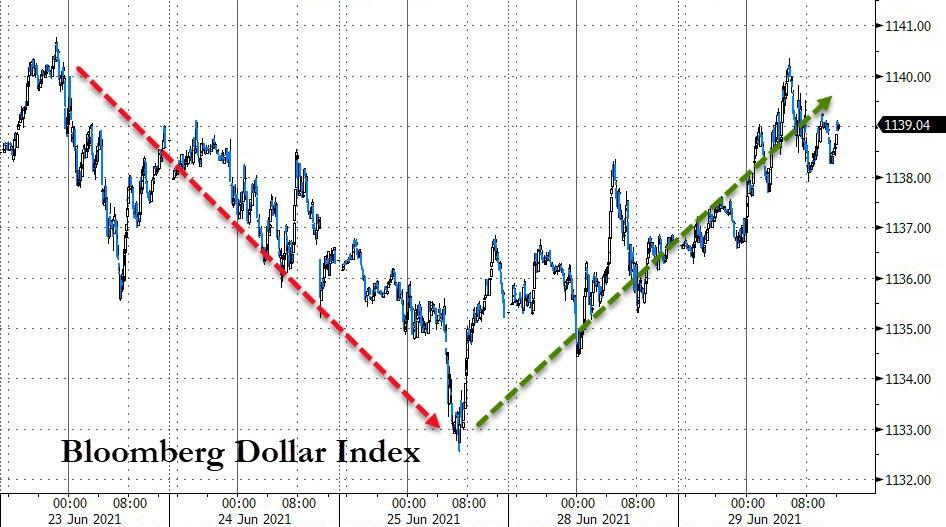
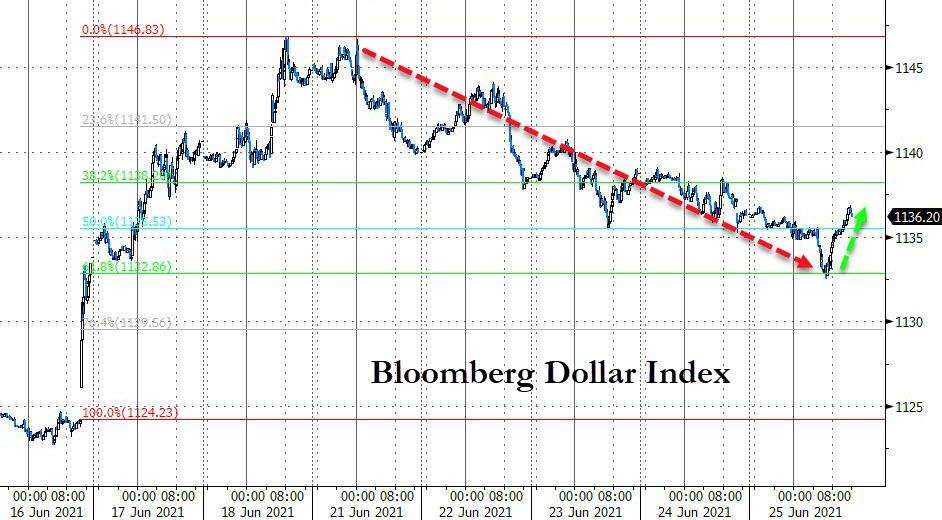
The US Dollar index has been retreating all week but managed to bounce today, yet it was not enough of a move to pull down gold. The precious metal managed to eke out a tiny gain of +0.19%.

With three more trading days left, it looks like the widely cited adage “sell in May and go away” may not materialize in June.

Read More

Weekly StatSheet For The ETF Tracker Newsletter – Updated Through 06/24/2021

Ulli ETF StatSheet Contact

ETF Data updated through Thursday, June 24, 2021

Methodology/Use of this StatSheet:

1. From the universe of over 1,800 ETFs, I have selected only those with a trading volume of over $5 million per day (HV ETFs), so that liquidity and a small bid/ask spread are assured.

2. Trend Tracking Indexes (TTIs)

Buy or Sell decisions for Domestic and International ETFs (section 1 and 2), are made based on the respective TTI and its position either above or below its long-term M/A (Moving Average). A crossing of the trend line from below accompanied by some staying power above constitutes a “Buy” signal. Conversely, a clear break below the line constitutes a “Sell” signal. Additionally, I use an 8% trailing stop loss on all positions in these categories to control downside risk.

3. All other investment arenas do not have a TTI and should be traded based on the position of the individual ETF relative to its own respective trend line (%M/A). That’s why those signals are referred to as a “Selective Buy.” In other words, if an ETF crosses its own trendline to the upside, a “Buy” signal is generated. Since these areas tend to be more volatile, I recommend a wider trailing sell stop of 8%-10% depending on your risk tolerance.

If you are unfamiliar with some of the terminology, please see Glossary of Terms and new subscriber information in section 9.     

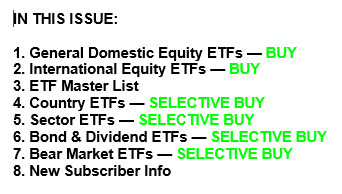
1. DOMESTIC EQUITY ETFs: BUY — since 07/22/2020

Click on chart to enlarge

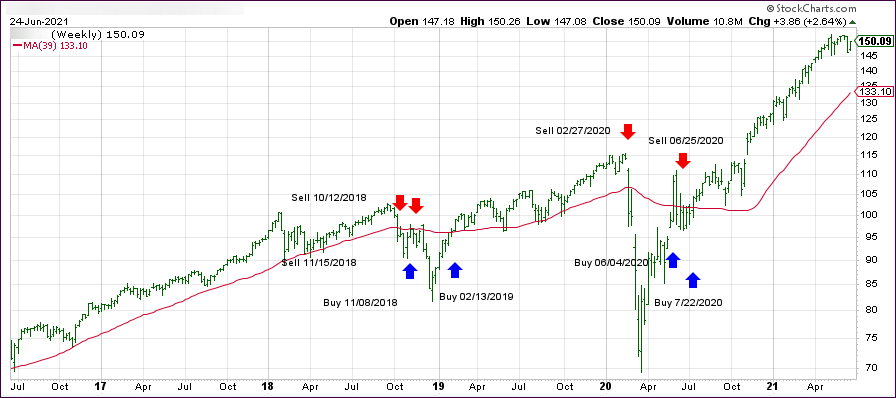
Our main directional indicator, the Domestic Trend Tracking Index (TTI-green line in the above chart) has now rallied above its long-term trend line (red) by +13.42% and remains in “BUY” mode as posted.

Read More