
ETF Tracker StatSheet
You can view the latest version here.
RIP ROARING INTO THE WEEKEND
- Moving the markets
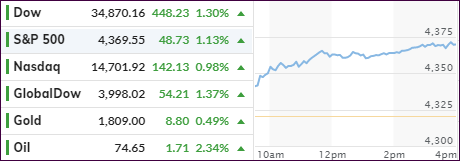
Despite weakness during this Holiday shortened week, stocks found their upside momentum again, right after the opening bell, and went on a rampage thereby leaving the bears in the dust by scoring solid gains across the board.
The major indexes not only recovered but notched record closes leaving previous losses as nothing but a vanishing point in the rearview mirror. The Dow led the charge, and the Nasdaq lagged for the session.
All former concerns, like slumping bond yields because of reduced economic activity, the Delta Covid variant, as well as a slowdown in the labor market were either ignored, brushed aside or simply forgotten, and no longer mattered, at least on this week-ending Friday.
Helping stocks surge was the rebound in yields with the 10-year moving higher and closing at 1.36%, which is 10 basis points off yesterday’s lows. Also helping markets was a dovish announcement by China that the PBOC would cut rates by 0.5 basis points offsetting fears of continued deleveraging, as Zero Hedge explained it.
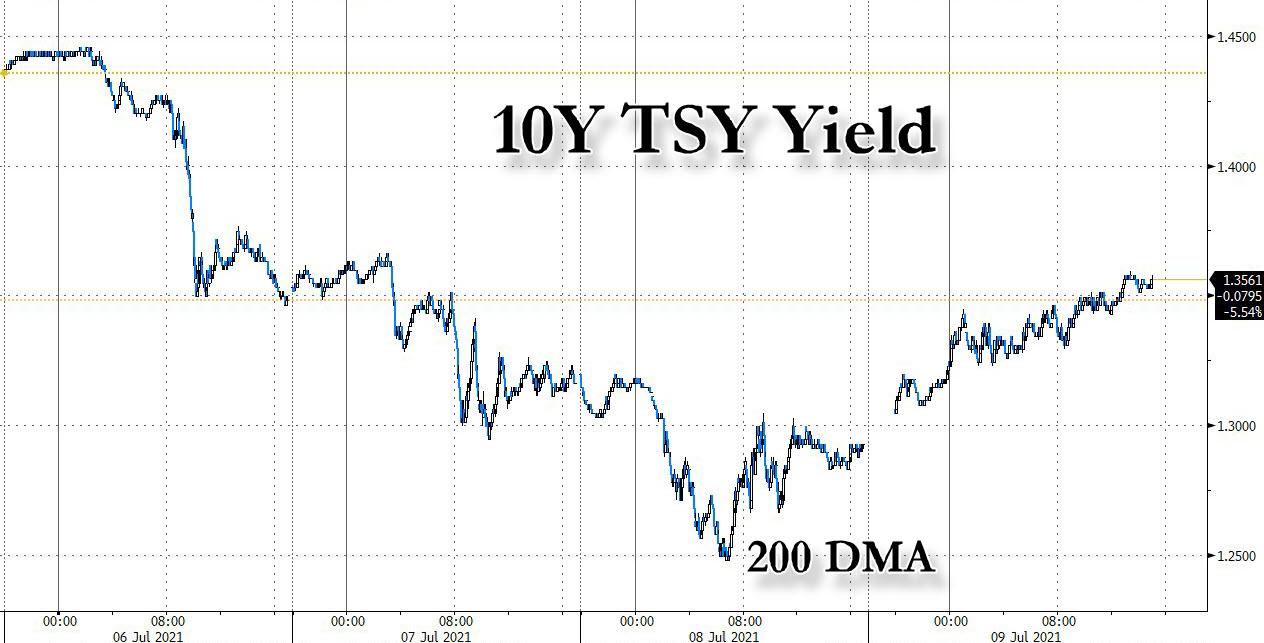
The US Dollar index slipped -0.34% and helped gold to score another win of +0.49%, which kept the precious metal above its $1,800 resistance level, but only by a small margin.
This topsy turvy week is in the books, and the major indexes managed to crawl back into the plus after having taken a licking on Thursday. If economic forecasts remain positive, we might see a continuation of this rebound effort.
2. ETFs in the Spotlight
In case you missed the announcement and description of this section, you can read it here again.
It features some of the 10 broadly diversified domestic and sector ETFs from my HighVolume list as posted every Saturday. Furthermore, they are screened for the lowest MaxDD% number meaning they have been showing better resistance to temporary sell offs than all others over the past year.
The below table simply demonstrates the magnitude with which these ETFs are fluctuating above or below their respective individual trend lines (%+/-M/A). A break below, represented by a negative number, shows weakness, while a break above, represented by a positive percentage, shows strength.
For hundreds of ETF choices, be sure to reference Thursday’s StatSheet.
For this current domestic “Buy” cycle, here’s how some our candidates have fared:
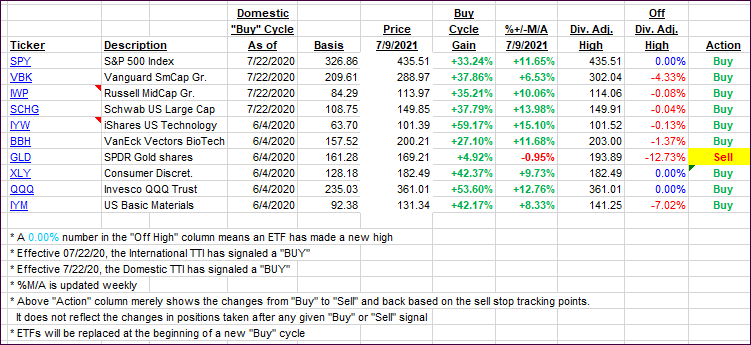
Click image to enlarge.
Again, the %+/-M/A column above shows the position of the various ETFs in relation to their respective long-term trend lines, while the trailing sell stops are being tracked in the “Off High” column. The “Action” column will signal a “Sell” once the -8% point has been taken out in the “Off High” column. For more volatile sector ETFs, the trigger point is -10%.
3. Trend Tracking Indexes (TTIs)
Our TTIs both recovered during today’s broad-based rebound.
This is how we closed 07/9/2021:
Domestic TTI: +12.36% above its M/A (prior close +11.62%)—Buy signal effective 07/22/2020.
International TTI: +8.66% above its M/A (prior close +7.86%)—Buy signals effective 07/22/2020.
Disclosure: I am obliged to inform you that I, as well as my advisory clients, own some of the ETFs listed in the above table. Furthermore, they do not represent a specific investment recommendation for you, they merely show which ETFs from the universe I track are falling within the specified guidelines.
All linked charts above are courtesy of Bloomberg via ZeroHedge.
———————————————————-
WOULD YOU LIKE TO HAVE YOUR INVESTMENTS PROFESSIONALLY MANAGED?
Do you have the time to follow our investment plans yourself? If you are a busy professional who would like to have his portfolio managed using our methodology, please contact me directly or get more details here.
———————————————————
Back issues of the ETF Tracker are available on the web.
Contact Ulli