Delta Variant Infects Stock Market

Ulli Market Commentary Contact

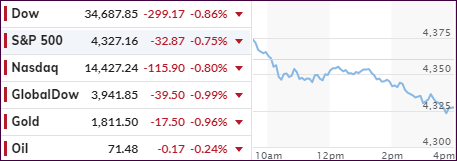
[Chart courtesy of MarketWatch.com]

  1. Moving the markets

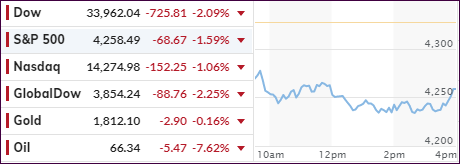
Concerns, that rebounding Covid cases, especially those identified as a Delta variant, could negatively affect an already stumbling recovery in economic activity, pulled the rug out from under the bullish theme and spanked the major indexes along with the broad market.

At one point, the Dow was down over 900 points but managed to pull itself out of a deep hole by “only” ending down some 726 points or -2.09%. The Nasdaq fared the best by giving back a more modest -1.06%, followed by the S&P 500 with -1.59%.

Gold, which was in the green for part of the day, succumbed to selling pressure by slipping -0.14% but holding on to it $1,800 level. The worst performers turned out to be energy and industrials with Small Caps losing as well but not getting hammered as bad as “value.”

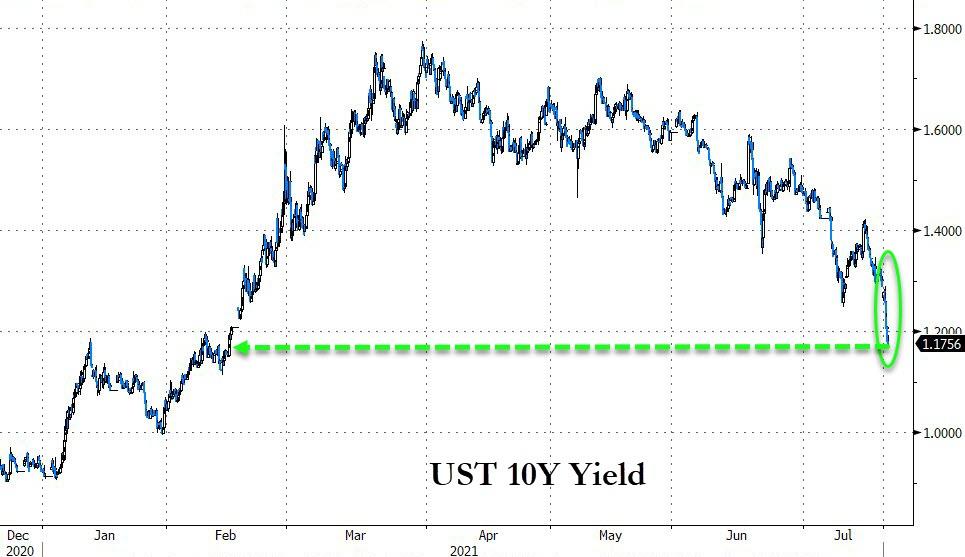
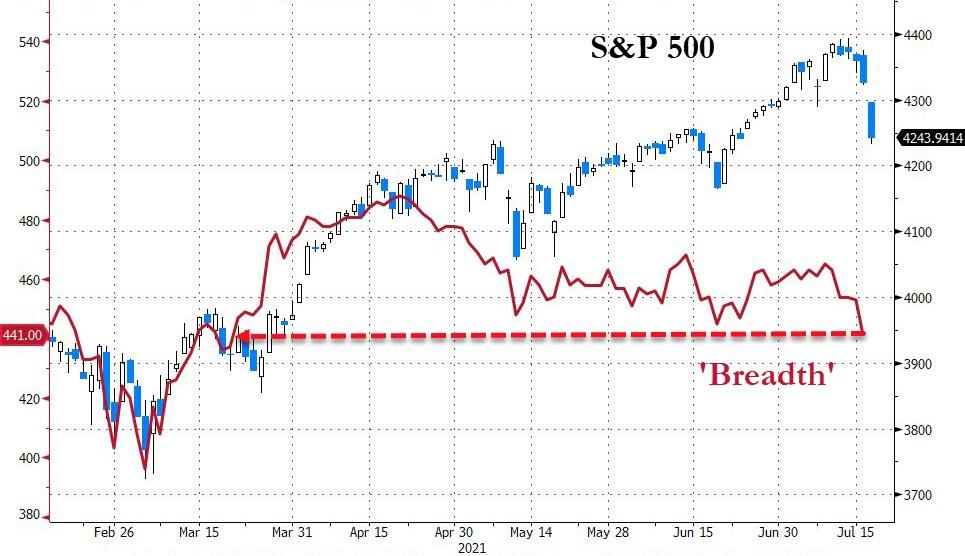
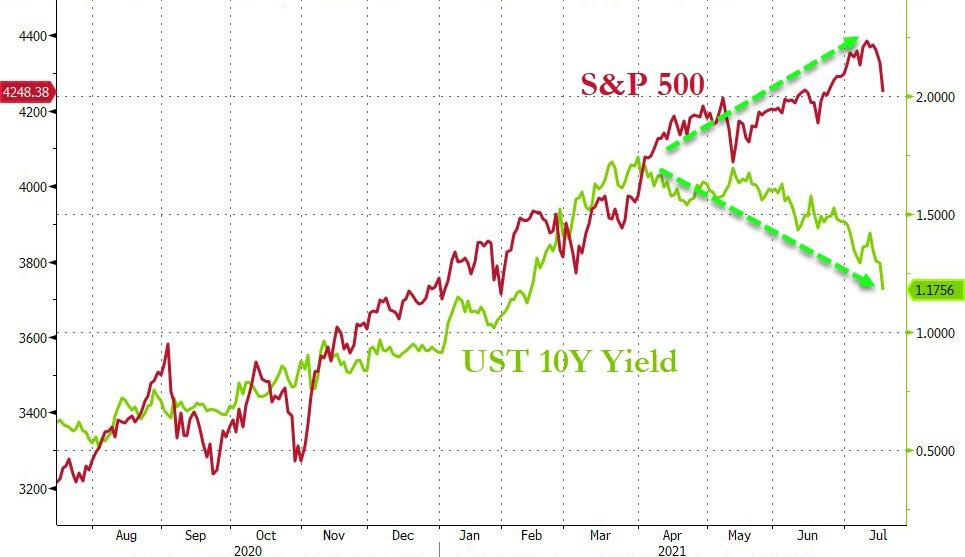
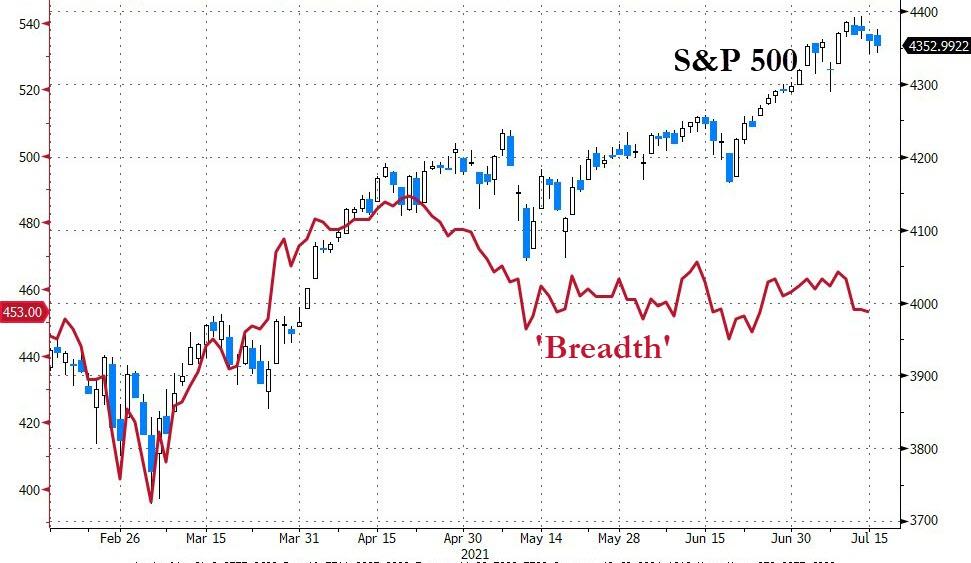
The beneficiary of this Puke-A-Thon were bond yields, which plunged to a level last seen in February with the 10-year breaking below the 1.20% level. As I posted Friday, if there is no “breadth” in the markets, yet the rally continues, it may be short lived. That was again confirmed today, as this chart demonstrates, with the fallout worsening.

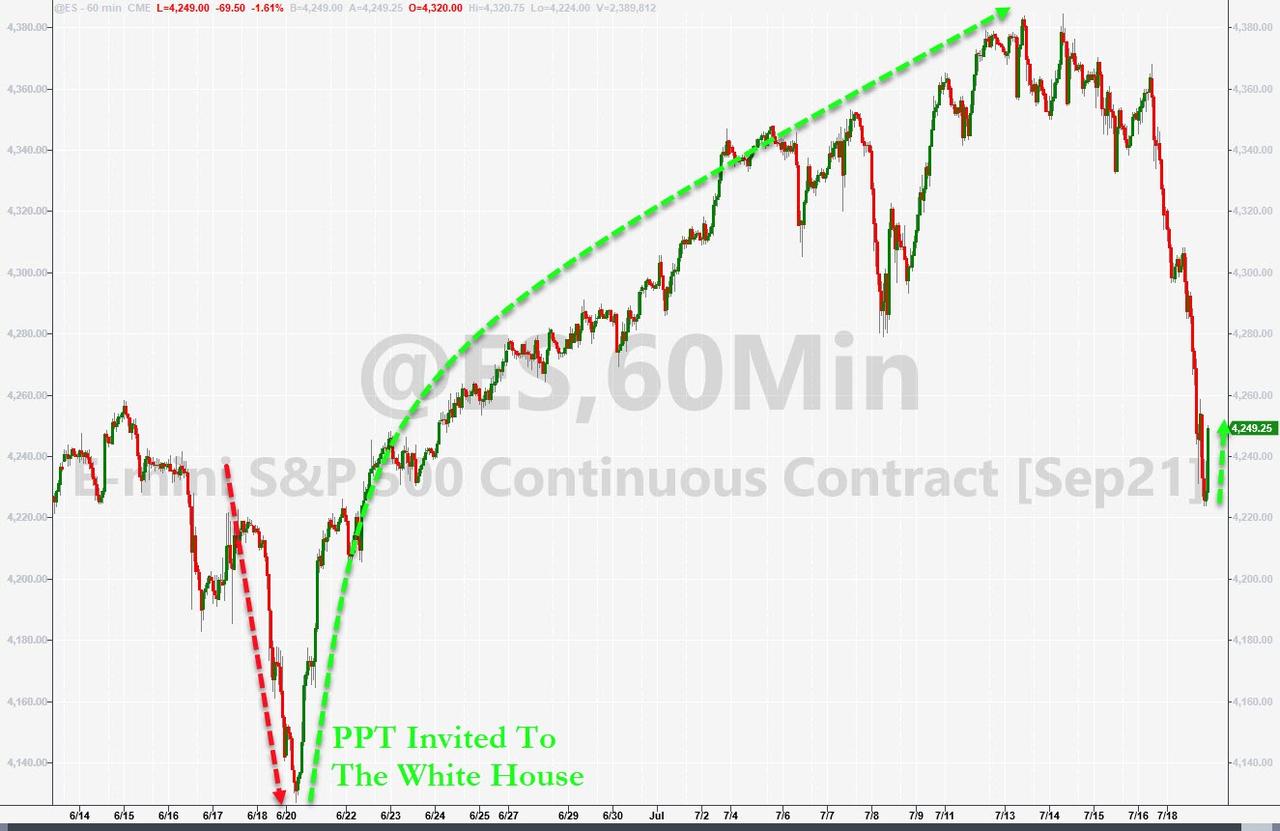
So, what caused the late small rebound? ZeroHedge speculated that the Plunge Protection Team (PPT) might have been invited to the White House again, hoping for the same result as last time. We may find out tomorrow if a “two-peat” is about to happen.

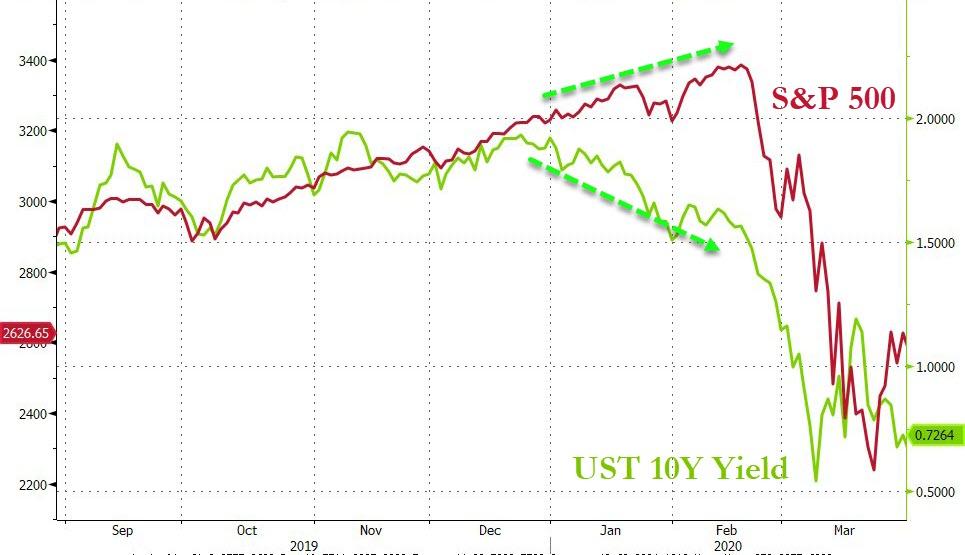
In the end, the question remains if this diversion of bond yields from the S&P 500 will result in more selling, as the jaws snap shut like last year, or will yields rise to justify the current lofty equity levels?  

We will find out in due time.

Read More
ETFs On The Cutline – Updated Through 07/16/2021

Ulli ETFs on the Cutline Contact

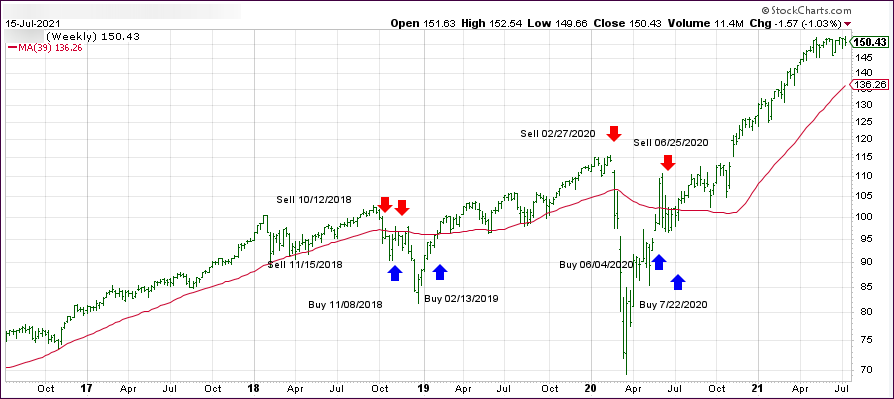
Below, please find the latest High-Volume ETF Cutline report, which shows how far above or below their respective long-term trend lines (39-week SMA) my currently tracked ETFs are positioned.

This report covers the HV ETF Master List from Thursday’s StatSheet and includes 312 High Volume ETFs, defined as those with an average daily volume of more than $5 million, of which currently 252 (last week 250) are hovering in bullish territory. The yellow line separates those ETFs that are positioned above their trend line (%M/A) from those that have dropped below it.

Take a look:                                                                   

The HV ETF Master Cutline Report

In case you are not familiar with some of the terminology used in the reports, please read the Glossary of Terms.

If you missed the original post about the Cutline approach, you can read it here.               

ETF Tracker Newsletter For July 16, 2021

Ulli ETF Tracker Contact

ETF Tracker StatSheet          

You can view the latest version here.

CHUCKING INTO THE WEEKEND

[Chart courtesy of MarketWatch.com]

  1. Moving the markets

Despite an early bounce last Monday, the major indexes bobbed and weaved throughout the week, yet, as upward momentum was fading, so did the buying appetite, and we dumped into the weekend.

This snapped the Dow’s 3-week winning streak, as inflation fears took center stage and dominated strong retail numbers along with better-than-expected earnings reports. The S&P 500 surrendered around 1%, while the Nasdaq fared worse by giving back some 1.9%.

Not helping the bullish mood was the consumer sentiment report, which showed a drop from last month, against expectations of an increase, with economists now struggling to explain how they could be that far off.

The report also pointed to increasing inflation expectations by consumers, who now believe prices will head higher by some 4.8% over the next year. Apparently, they have not accepted the Fed’s non-stop jawboning that inflation is “transitory.”

Even funnier, I just heard that one of the Fed heads announced that inflation is in a “bubble” and may be pricked and subsequently deflated. Hmm, sounds like something that might be more applicable to the stock market.

In the end, considering the recent runup in equities, the losses were moderate but broad.

Small Caps, Value and Tech all slumped with value taking the biggest hit of -1.58%. That sector, despite still being the YTD leader, has struggled over the past few weeks.

The US Dollar stayed about even, bond yields dipped slightly, none of which was conducive to holding up Gold, which tumbled -0.95% on the session but remains above its much fought-over $1,800 level.

Again, ZeroHedge pointed to weakness in this recent rally due to a lack breadth. As you can see in this S&P 500 chart, the price and breadth (a measure of the number of stocks participating in a rally) diverged around the middle of April, thereby indicating that only a small percentage of them were responsible for the push higher.   

Advances based on low breadth are known to be ephemeral.

Read More

Weekly StatSheet For The ETF Tracker Newsletter – Updated Through 07/15/2021

Ulli ETF StatSheet Contact

ETF Data updated through Thursday, July 15, 2021

Methodology/Use of this StatSheet:

1. From the universe of over 1,800 ETFs, I have selected only those with a trading volume of over $5 million per day (HV ETFs), so that liquidity and a small bid/ask spread are assured.

2. Trend Tracking Indexes (TTIs)

Buy or Sell decisions for Domestic and International ETFs (section 1 and 2), are made based on the respective TTI and its position either above or below its long-term M/A (Moving Average). A crossing of the trend line from below accompanied by some staying power above constitutes a “Buy” signal. Conversely, a clear break below the line constitutes a “Sell” signal. Additionally, I use an 8% trailing stop loss on all positions in these categories to control downside risk.

3. All other investment arenas do not have a TTI and should be traded based on the position of the individual ETF relative to its own respective trend line (%M/A). That’s why those signals are referred to as a “Selective Buy.” In other words, if an ETF crosses its own trendline to the upside, a “Buy” signal is generated. Since these areas tend to be more volatile, I recommend a wider trailing sell stop of 8%-10% depending on your risk tolerance.

If you are unfamiliar with some of the terminology, please see Glossary of Terms and new subscriber information in section 9.     

1. DOMESTIC EQUITY ETFs: BUY — since 07/22/2020

Click on chart to enlarge

Our main directional indicator, the Domestic Trend Tracking Index (TTI-green line in the above chart) has now rallied above its long-term trend line (red) by +11.20% and remains in “BUY” mode as posted.

Read More

No Market Commentary

Ulli Uncategorized Contact

It looks like I will not be able to return in time from a couple of appointments to write the market commentary. However, I will create the StatSheet later on and publish it tonight. Regular posting will resume tomorrow.

Ulli…

Fed Stays The Course—Markets Pump, Dump And Pump

Ulli Market Commentary Contact

[Chart courtesy of MarketWatch.com]

  1. Moving the markets

The Fed issued some market pleasing remarks early on sending the major indexes higher, with the S&P 500 notching another intra-day record. Fed head Powell uttered the words that traders wanted to hear, namely that they will maintain their easy monetary policies.

Added CNBC:

Powell said in his semiannual testimony before Congress Wednesday that the central bank can wait before it starts to ease its bond purchases despite surging inflation readings. The Fed chair said he still expects inflation to moderate.

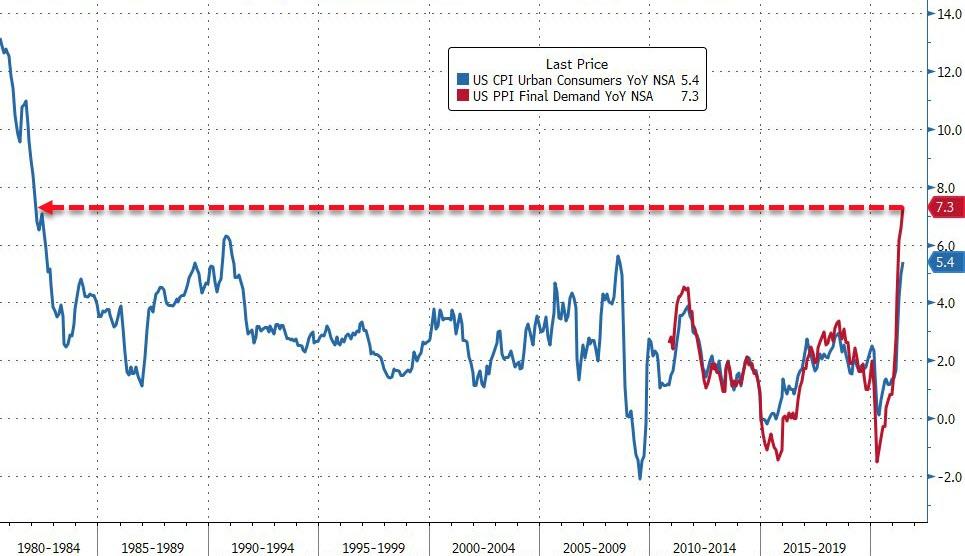
Though, hawkish Producer Price inflation (PPI) numbers, showing the index spiraling past expectations, up 1% MoM, rising 7.3% YoY (vs. 6.7% expected), took the starch out of the rally.

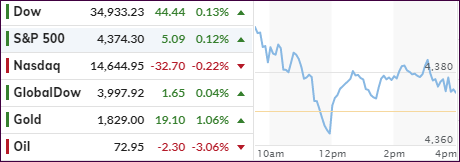
As a result, the early euphoria hit a brick wall, causing the markets to reverse and dump into the red. An afternoon rebound ensured a modest close above their respective unchanged lines, except for the Nasdaq, which lost a modest -0.22%.

Sure, we are supposed to believe that inflation is transitory, which I don’t agree with, and today, non-other than powerhouse Blackrock’s Larry Fink said: “I worry about inflation, it’s unlikely to be transitory.”

In terms of winners and losers on today’s roller coaster ride, Small Caps got hammered again (-1.65%) with “value” closing in the red as well, but with a lesser loss (-0.45%).

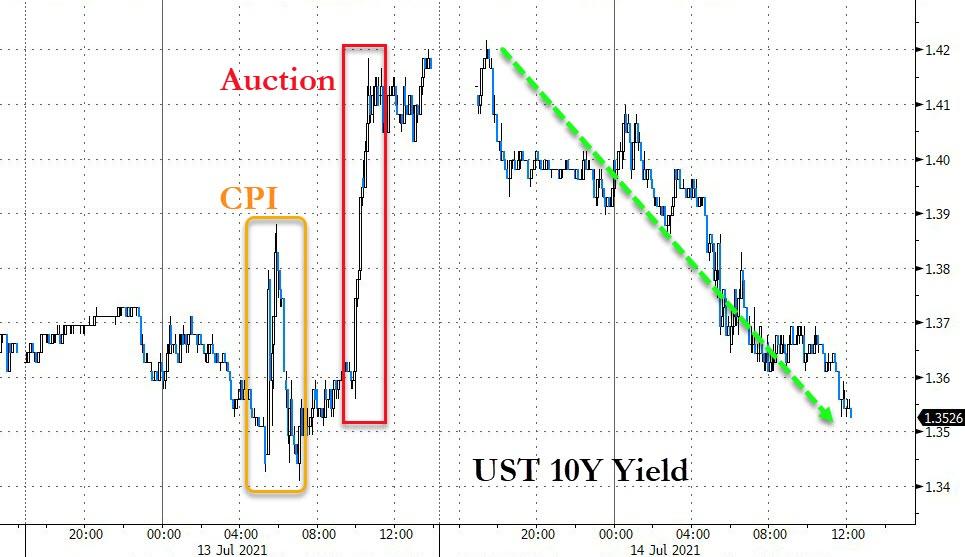
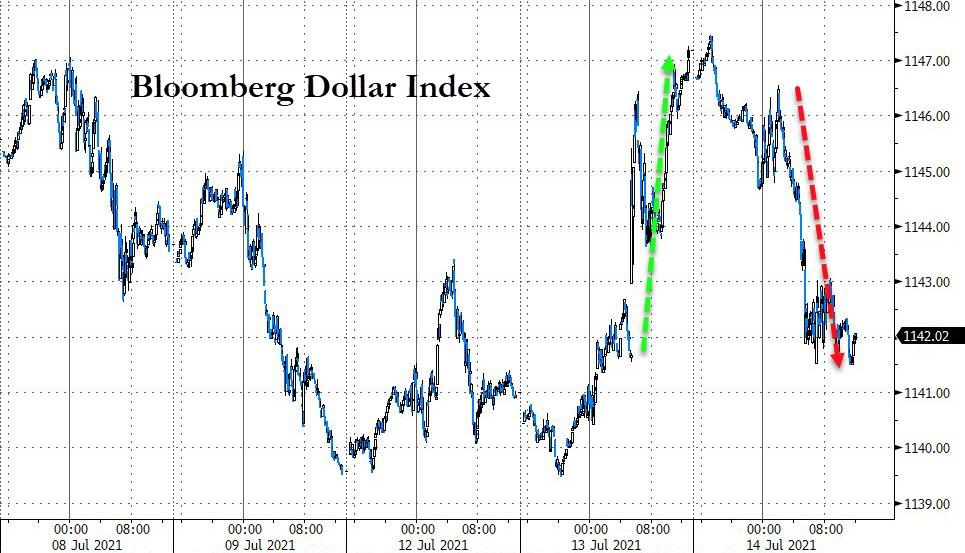
Bond yields collapsed, giving back yesterday’s gains, which was followed by the US Dollar. That combination gave Gold a reason to rally, and the precious metal added a solid +1.03% and thereby solidified its position above the $1,800 level.

I believe this session was saved by Powell’s dovish announcement which, at least for this day, dominated any inflationary concerns.

Read More