
- Moving the markets
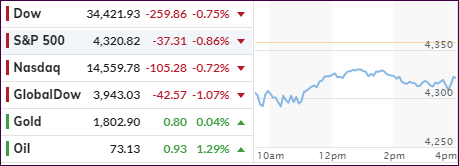
The markets dumped right after the opening as concerns about the economic recovery losing steam went mainstream. No surprise here, as I had mentioned that issue in recent posts and more evidence surfaced this morning.
Losses accelerated as Japan declared a state of emergency in Tokyo for the upcoming Olympics, and other countries had to deal with a rebound in cases due to Covid variants.
On the economic side, the latest Jobless Data were a downer with the numbers coming in at 373k, higher than expected, and thereby adding to the issue of a slowdown in the labor picture. On the other hand, as I posted yesterday, Job Openings are at a record high, so those without one simply need to get up and apply.
Added one investment advisor:
The market has been in one of those ‘Goldilocks’ stretches when economic growth was accelerating while inflation and interest rates remained low. Increased Covid cases, particularly Delta Variants have caused concerns that the economic acceleration will slow. A few weeks ago, the porridge was too hot, now it seems it is too cold. With markets at all-time highs and some valuations stretched there is little room for economic slowdown in this market.
As a result of a potential slowdown, bond yields continued to slip with the 10-year dropping below the 1.30% level, thereby catching a lot of shorts by surprise. Many pros had bet on rising bond yields and not falling ones. Covering those short positions by buying them back created a vicious cycle by pushing yields even lower.
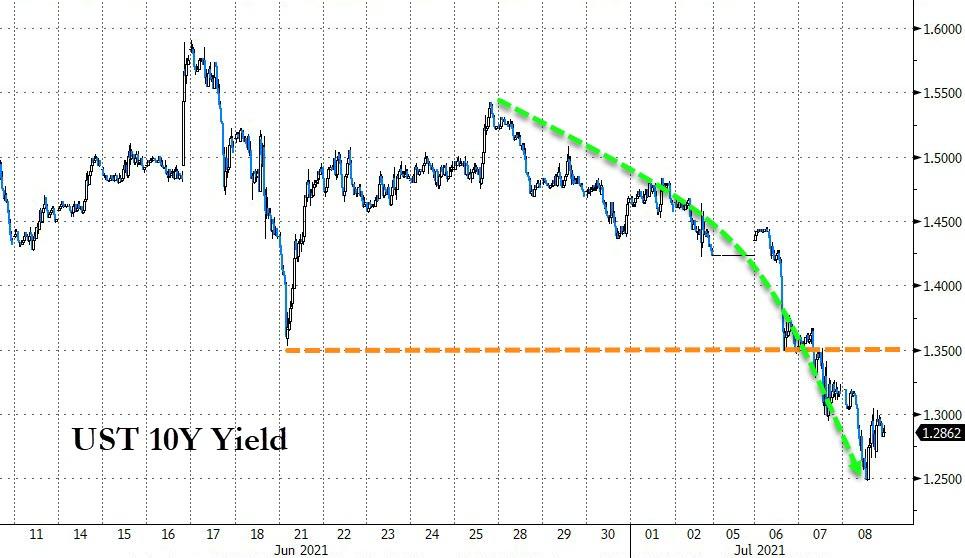
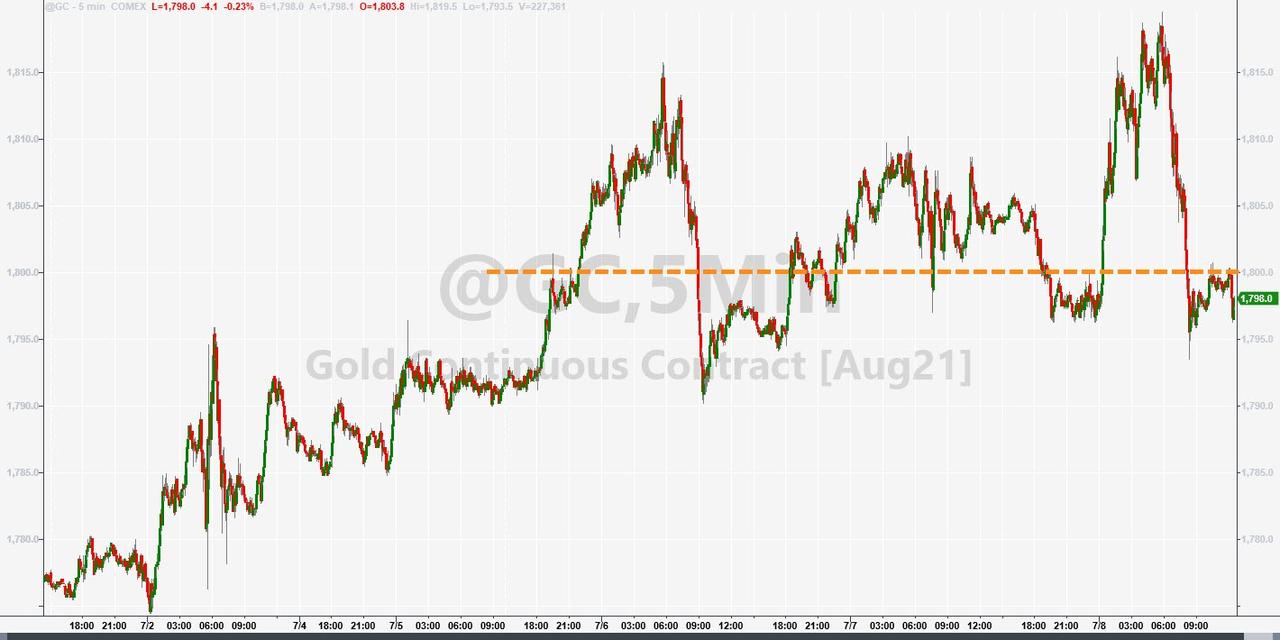
The US Dollar attempted an early breakout but succumbed to selling and closed lower. Today ended up being opposite day as sinking yields and a slipping dollar combined to give gold a boost mid-day, which unfortunately faded, but the precious metal managed to at least successfully defend its $1,800 marker by closing up a scant +0.06%.
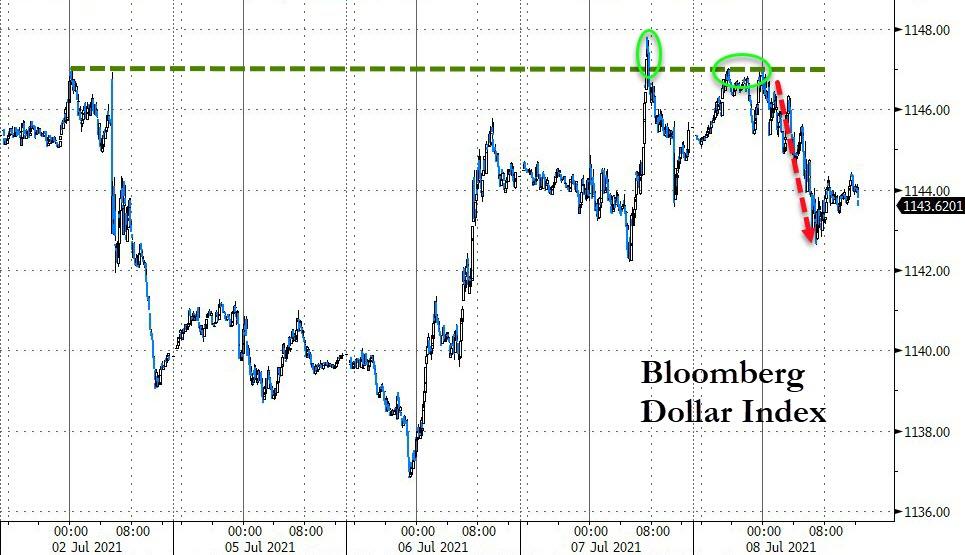
We’ve seen abnormal rides in the markets recently, with the major indexes hanging around all-time high territory. The much hoped for “V” shape economic recovery may have pulled us out of the Covid doldrums from last year, but only thanks to the reckless money creation efforts by the Fed. However, right now it appears that those efforts have hit a brick wall.
After all, artificial stimulation can only do so much before organic growth must take over to create a true recovery. Currently, it’s questionable in my mind whether we are on the right path.
2. ETFs in the Spotlight
In case you missed the announcement and description of this section, you can read it here again.
It features some of the 10 broadly diversified domestic and sector ETFs from my HighVolume list as posted every Saturday. Furthermore, they are screened for the lowest MaxDD% number meaning they have been showing better resistance to temporary sell offs than all others over the past year.
The below table simply demonstrates the magnitude with which these ETFs are fluctuating above or below their respective individual trend lines (%+/-M/A). A break below, represented by a negative number, shows weakness, while a break above, represented by a positive percentage, shows strength.
For hundreds of ETF choices, be sure to reference Thursday’s StatSheet.
For this current domestic “Buy” cycle, here’s how some our candidates have fared:
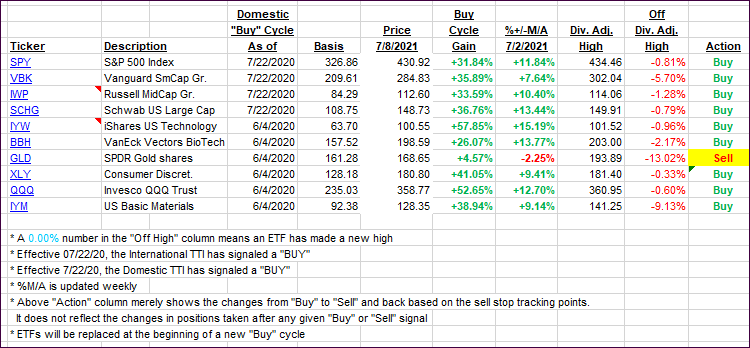
Click image to enlarge.
Again, the %+/-M/A column above shows the position of the various ETFs in relation to their respective long-term trend lines, while the trailing sell stops are being tracked in the “Off High” column. The “Action” column will signal a “Sell” once the -8% point has been taken out in the “Off High” column. For more volatile sector ETFs, the trigger point is -10%.
3. Trend Tracking Indexes (TTIs)
Our TTIs took a dive, because there was no place to hide with especially the International TTI suffering more than the Domestic one.
This is how we closed 07/8/2021:
Domestic TTI: +11.62% above its M/A (prior close +12.65%)—Buy signal effective 07/22/2020.
International TTI: +7.86% above its M/A (prior close +9.05%)—Buy signals effective 07/22/2020.
Disclosure: I am obliged to inform you that I, as well as my advisory clients, own some of the ETFs listed in the above table. Furthermore, they do not represent a specific investment recommendation for you, they merely show which ETFs from the universe I track are falling within the specified guidelines.
All linked charts above are courtesy of Bloomberg via ZeroHedge.
Contact Ulli