
- Moving the markets
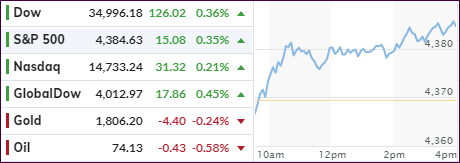
Despite a downside opening, the major indexes regained their upward momentum rather quickly and once climbed above their respective unchanged lines, continued their path to score another winning session.
Support came from positive expectations of the upcoming earnings season, which will start later this week. For sure, some analysts are counting on blockbuster earnings results, but even more important will be the outlook discussion as to what the future might bring.
However, keep in mind, when comparing Q2 earnings of last year with this year, there better be a huge improvement given the pandemic slowdown during 2020. We might see a record growth rate, but it’s a distorted measure due to comparing a now growing economy to one that was in shutdown mode.
We will also have to face important economic data such as key readings on inflation mid-week followed by June retail sales on Friday.
The results were mixed today with value (+0.54%) sprinting ahead of Small Caps (-0.28%), while the Financials (XLF) outperformed the broad indexes with a gain of +0.98%.
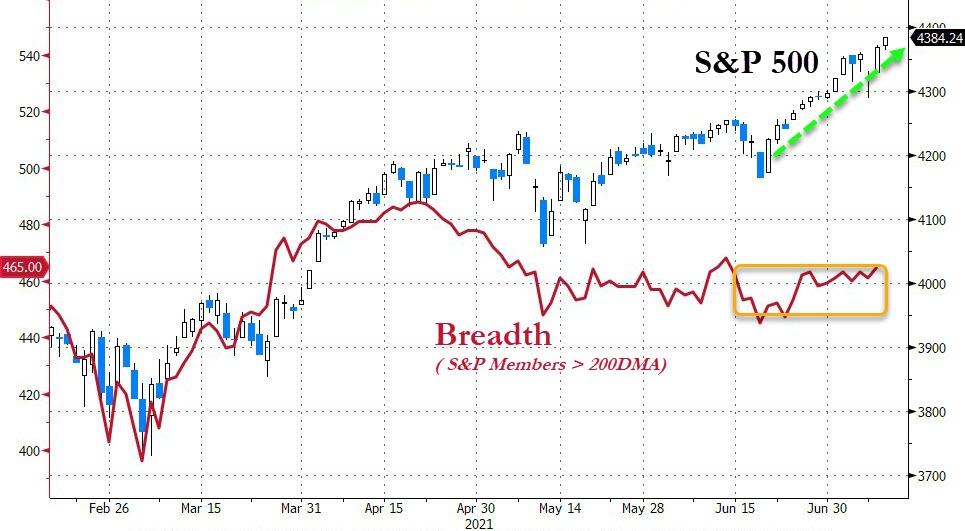
As far as the S&P is concerned, some analysts are seeing warnings signs, as breadth severely lags, meaning that only a minority number of stocks are carrying the load to drive the index higher.
Bond yields and the US Dollar went predominantly sideways with not much gained. Gold slipped slightly but managed to hang on to its $1,800 level.
2. ETFs in the Spotlight
In case you missed the announcement and description of this section, you can read it here again.
It features some of the 10 broadly diversified domestic and sector ETFs from my HighVolume list as posted every Saturday. Furthermore, they are screened for the lowest MaxDD% number meaning they have been showing better resistance to temporary sell offs than all others over the past year.
The below table simply demonstrates the magnitude with which these ETFs are fluctuating above or below their respective individual trend lines (%+/-M/A). A break below, represented by a negative number, shows weakness, while a break above, represented by a positive percentage, shows strength.
For hundreds of ETF choices, be sure to reference Thursday’s StatSheet.
For this current domestic “Buy” cycle, here’s how some our candidates have fared:
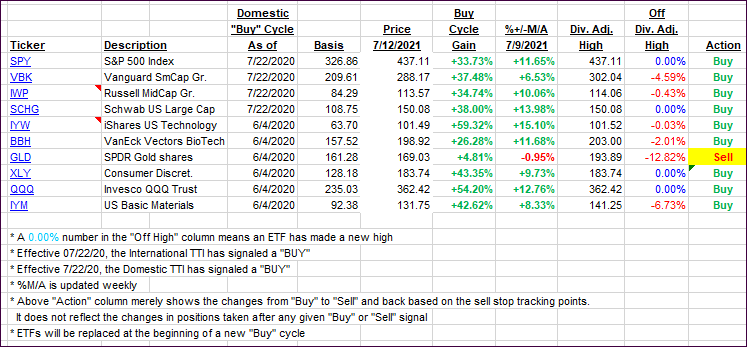
Click image to enlarge.
Again, the %+/-M/A column above shows the position of the various ETFs in relation to their respective long-term trend lines, while the trailing sell stops are being tracked in the “Off High” column. The “Action” column will signal a “Sell” once the -8% point has been taken out in the “Off High” column. For more volatile sector ETFs, the trigger point is -10%.
3. Trend Tracking Indexes (TTIs)
Our TTIs moved slightly higher with all major indexes gaining ground.
This is how we closed 07/12/2021:
Domestic TTI: +12.72% above its M/A (prior close +12.36%)—Buy signal effective 07/22/2020.
International TTI: +9.07% above its M/A (prior close +8.66%)—Buy signals effective 07/22/2020.
Disclosure: I am obliged to inform you that I, as well as my advisory clients, own some of the ETFs listed in the above table. Furthermore, they do not represent a specific investment recommendation for you, they merely show which ETFs from the universe I track are falling within the specified guidelines.
All linked charts above are courtesy of Bloomberg via ZeroHedge.
Contact Ulli