
- Moving the markets
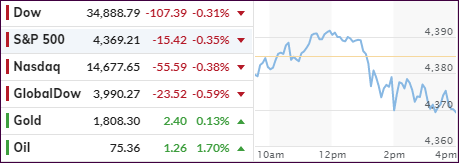
An early trounce was followed by quick bounce, but upward momentum could not be sustained, and the impact of the inflation report proved to be stronger than some of the positive early earnings results. The three major indexes all closed on the red, albeit by a small percentage.
For sure, the inflation numbers turned out to be hotter-than-expected with the CPI increasing by 5.4% in June from a year ago, which was its fastest increase in 13 years, according to the Labor Department.
The Core CPI, excluding food and energy, leaped 4.5%, its sharpest move since 1991, exceeding its estimate of 3.8%. Adding insult to injury were used car prices, which rocketed higher by an amazing 45% YoY.
Of course, as I expected, word on the street spread that all of this will prove to be temporary. Yeah right!
These numbers overshadowed blowout earnings by big banks and PepsiCo and may keep the markets on a leash for the time being, with bond yields getting hit hard as the 10-year spiked to 1.417%.
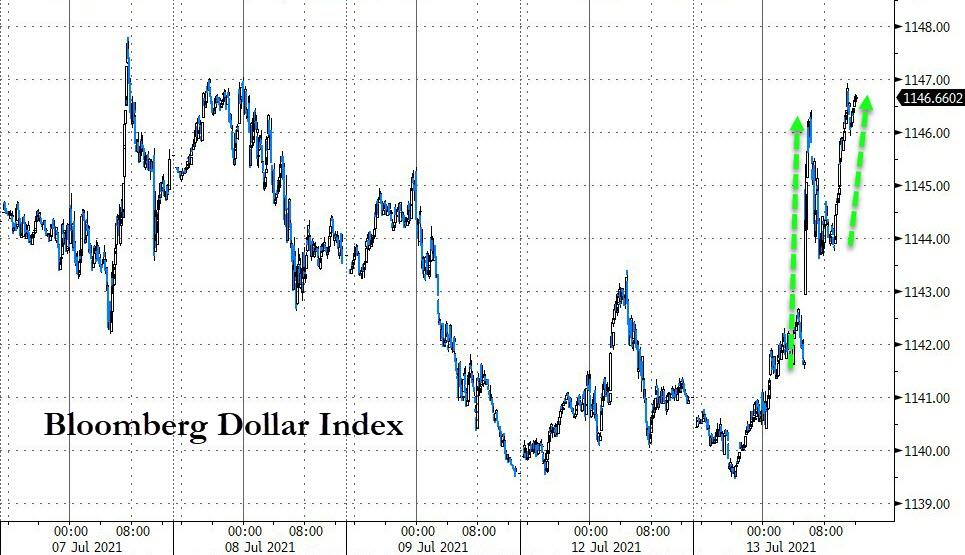
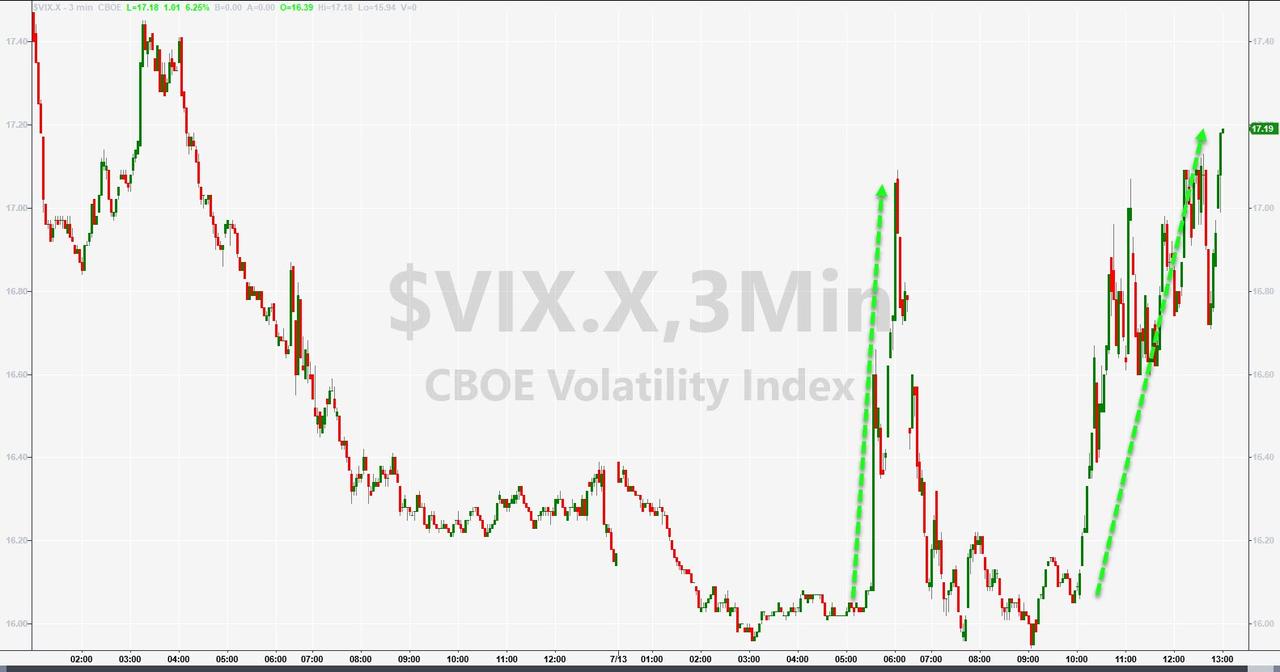
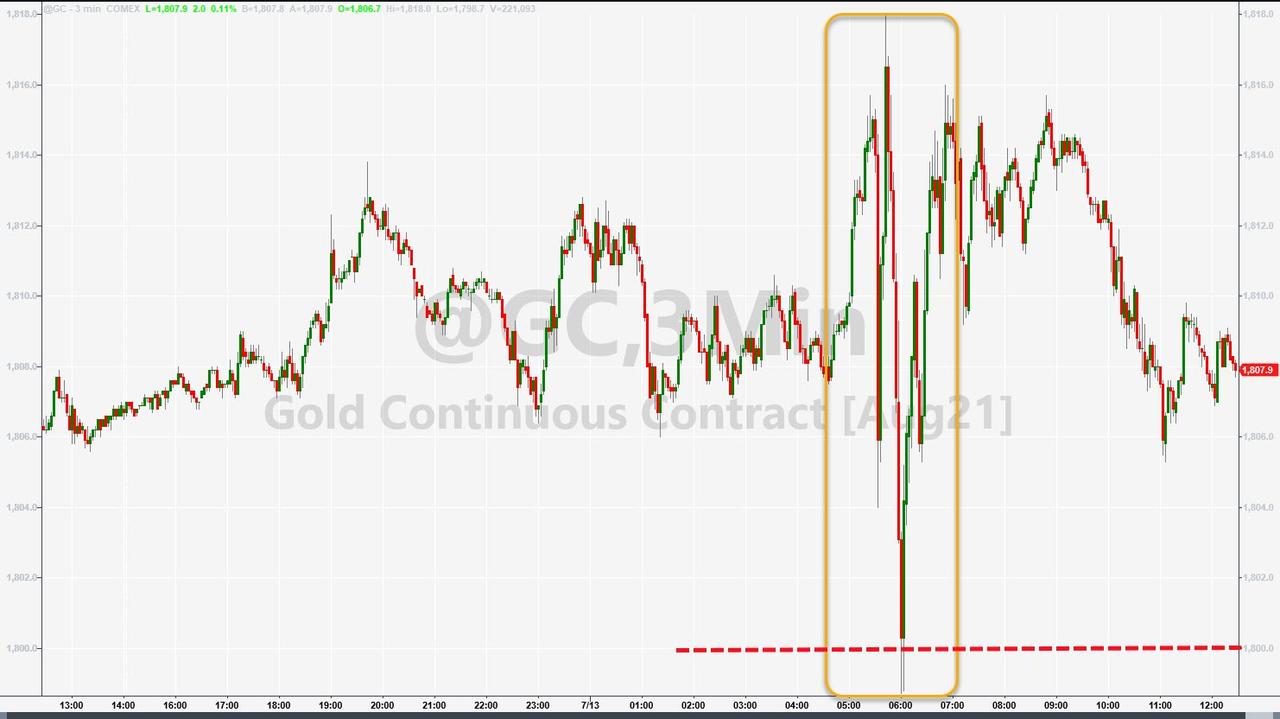
The US Dollar Index surged, dropped, and surged again, as volatility rose and Gold whipsawed. The precious metal ended the session with a slight gain and remained above its $1,800 level.
It was a wild day and created a tug-of-war via opinions that favored inflation to be “transitory” vs. those that see it as a “permanent” companion. My bet is on the latter.
2. ETFs in the Spotlight
In case you missed the announcement and description of this section, you can read it here again.
It features some of the 10 broadly diversified domestic and sector ETFs from my HighVolume list as posted every Saturday. Furthermore, they are screened for the lowest MaxDD% number meaning they have been showing better resistance to temporary sell offs than all others over the past year.
The below table simply demonstrates the magnitude with which these ETFs are fluctuating above or below their respective individual trend lines (%+/-M/A). A break below, represented by a negative number, shows weakness, while a break above, represented by a positive percentage, shows strength.
For hundreds of ETF choices, be sure to reference Thursday’s StatSheet.
For this current domestic “Buy” cycle, here’s how some our candidates have fared:
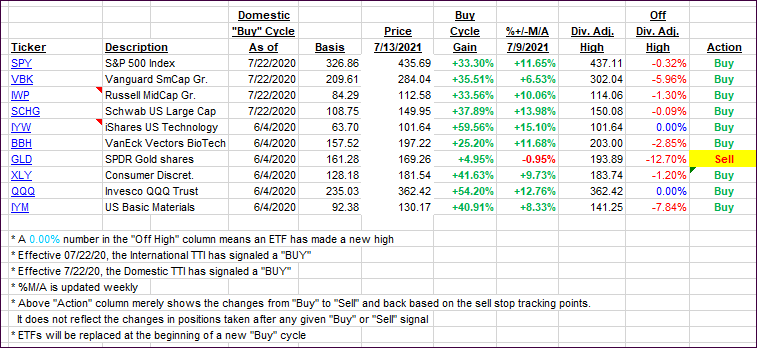
Click image to enlarge.
Again, the %+/-M/A column above shows the position of the various ETFs in relation to their respective long-term trend lines, while the trailing sell stops are being tracked in the “Off High” column. The “Action” column will signal a “Sell” once the -8% point has been taken out in the “Off High” column. For more volatile sector ETFs, the trigger point is -10%.
3. Trend Tracking Indexes (TTIs)
Our TTIs retreated as inflation fears gripped the markets.
This is how we closed 07/13/2021:
Domestic TTI: +11.66% above its M/A (prior close +12.72%)—Buy signal effective 07/22/2020.
International TTI: +8.45% above its M/A (prior close +9.07%)—Buy signals effective 07/22/2020.
Disclosure: I am obliged to inform you that I, as well as my advisory clients, own some of the ETFs listed in the above table. Furthermore, they do not represent a specific investment recommendation for you, they merely show which ETFs from the universe I track are falling within the specified guidelines.
All linked charts above are courtesy of Bloomberg via ZeroHedge.
Contact Ulli