ETF Tracker Newsletter For April 22, 2022

Ulli ETF Tracker Contact

ETF Tracker StatSheet          

You can view the latest version here.

PUKING INTO THE WEEKEND
[Chart courtesy of MarketWatch.com]

  1. Moving the markets

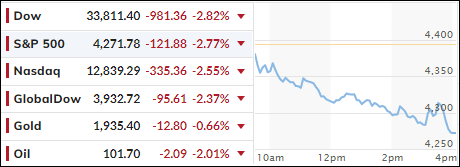
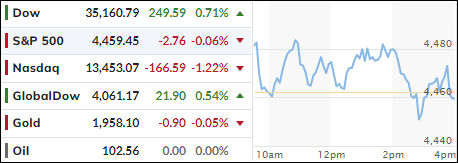
After yesterday’s pump and dump session, during which the Dow jumped to a 300-point lead early on, only to see those gains wiped out, with the index closing with a loss of almost 370 points.

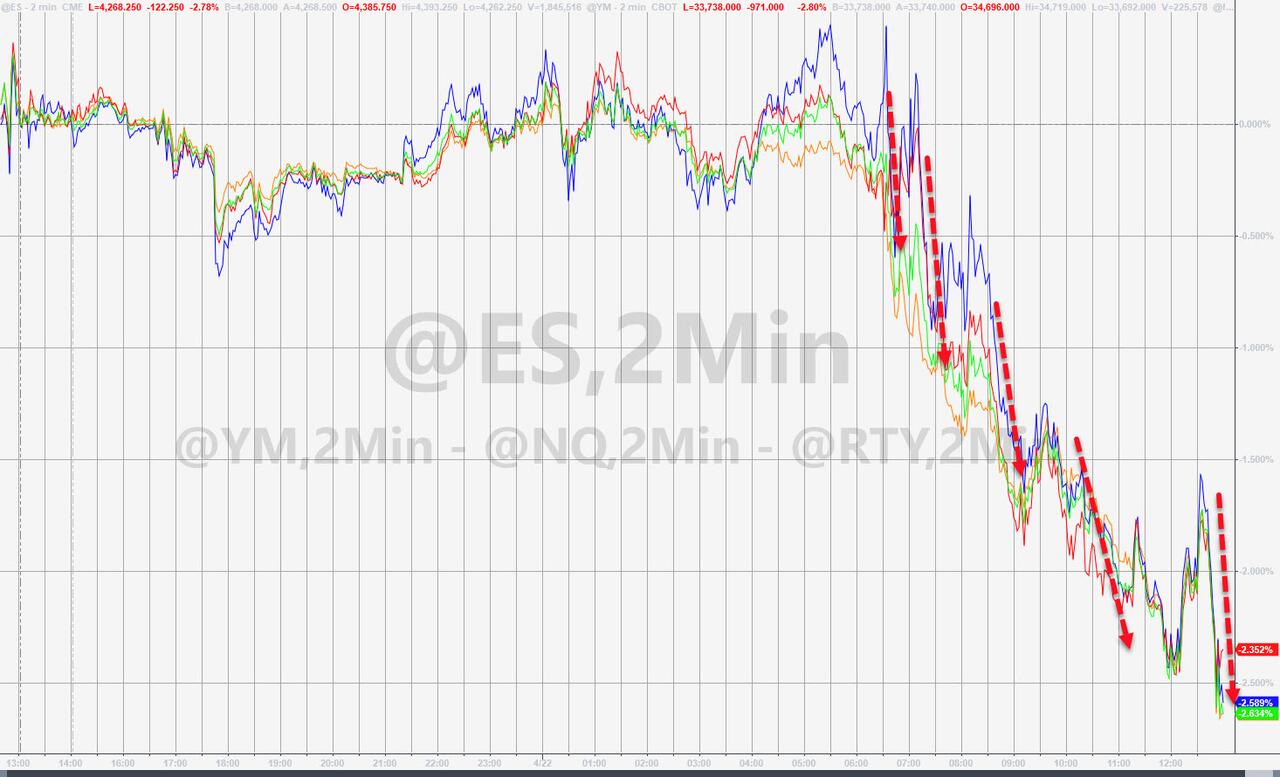
That bearish momentum continued during the overnight session and worsened after today’s opening, as the puke-a-thon picked up speed during the afternoon. At this moment in time, the late March melt up in the Nasdaq has been fully reversed, which to me means that it may have been nothing more than a dead-cat-bounce.

Headline news showed no encouraging developments anywhere, as these samples from ZeroHedge show:

  • Whispers Of Yuan Devaluation After Biggest Weekly Plunge Since 2015 As Yen Craters
  • Japan Begs US For “Coordinated Currency Intervention”, Is Rejected By Yellen
  • Israel Dumps The Dollar For China’s Renminbi
  • Markets Monkey hammered As Rate-Hike Expectations Soar

Some reality finally set in, as traders now had to price in a 50-bps (basis points) hike in both May and June, while some whispered of a potential 75 bps increase, as ZH pointed out. That was far more than expected, the bullish mood soured, and the bears picked up the baton and ran with it handing the Dow an almost 1,000-point loss.

Added ZeroHedge:

Fed mouthpiece Bullard warned that “the bond market is not looking like a safe place to be”; and Powell backed a one-two of 50bp hikes, which is now priced in. His goal is also “to get inflation down without a recession”. That’s like saying you want your opponent’s boxing gloves to hit the canvas but not the actual boxer. It’s a plan. Those are words. Just stupid ones.

In the end, there was no place to hide, as all asset classes were taken out to the barn and spanked with an assist given by disappointing quarterly results. Even the well-performing sector funds proved not to be immune to today’s thrashing.  

Chief economist Jeanette Garretty summed it up like this:

This is all about Powell’s comments, but the cautionary remarks about future sales growth in so many earnings announcements are driving home the essential point: fighting inflation will inflict some pain.

No kidding.

If the Fed is serious about fighting inflation and not concerned with the effects on the markets, there is bound to be a lot more pain to come. That’s why it pays to be prepared via an exit strategy, should a full-fledged bear market develop and become reality.  

Read More
Weekly StatSheet For The ETF Tracker Newsletter – Updated Through 04/21/2022

Ulli ETF StatSheet Contact

ETF Data updated through Thursday, April 21, 2022

Methodology/Use of this StatSheet:

1. From the universe of over 1,800 ETFs, I have selected only those with a trading volume of over $5 million per day (HV ETFs), so that liquidity and a small bid/ask spread are assured.

2. Trend Tracking Indexes (TTIs)

Buy or Sell decisions for Domestic and International ETFs (section 1 and 2), are made based on the respective TTI and its position either above or below its long-term M/A (Moving Average). A crossing of the trend line from below accompanied by some staying power above constitutes a “Buy” signal. Conversely, a clear break below the line constitutes a “Sell” signal. Additionally, I use an 12% trailing stop loss on all positions in these categories to control downside risk.

3. All other investment arenas do not have a TTI and should be traded based on the position of the individual ETF relative to its own respective trend line (%M/A). That’s why those signals are referred to as a “Selective Buy.” In other words, if an ETF crosses its own trendline to the upside, a “Buy” signal is generated. Here too, I recommend trailing sell stop of 12%, or less, depending on your risk tolerance.

If you are unfamiliar with some of the terminology, please see Glossary of Terms and new subscriber information in section 9.     

1. DOMESTIC EQUITY ETFs: SELL — since 02/24/2022

Click on chart to enlarge

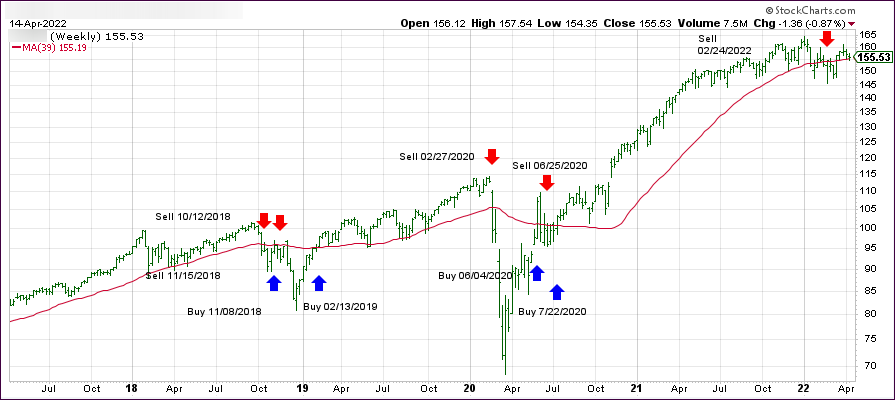
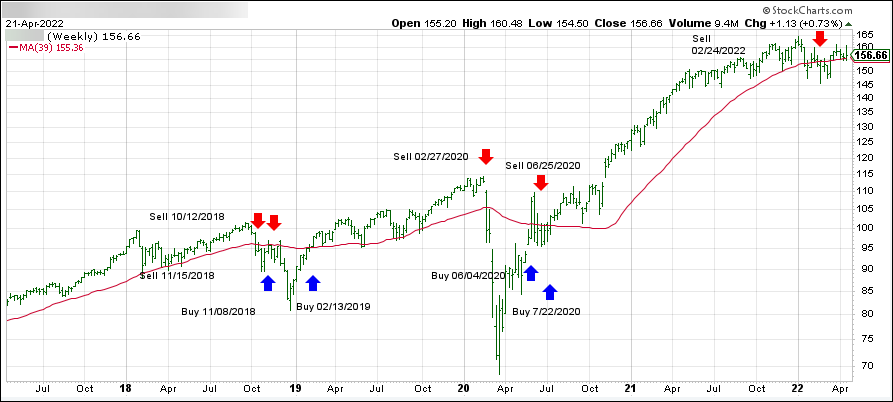
Our main directional indicator, the Domestic Trend Tracking Index (TTI-green line in the above chart) has only broken above its long-term trend line (red) by +0.95% and remains in “SELL” mode—although it is on the edge of moving back to the Buy side.  

Read More

Signs Of Lethargy

Ulli Market Commentary Contact

[Chart courtesy of MarketWatch.com]

  1. Moving the markets

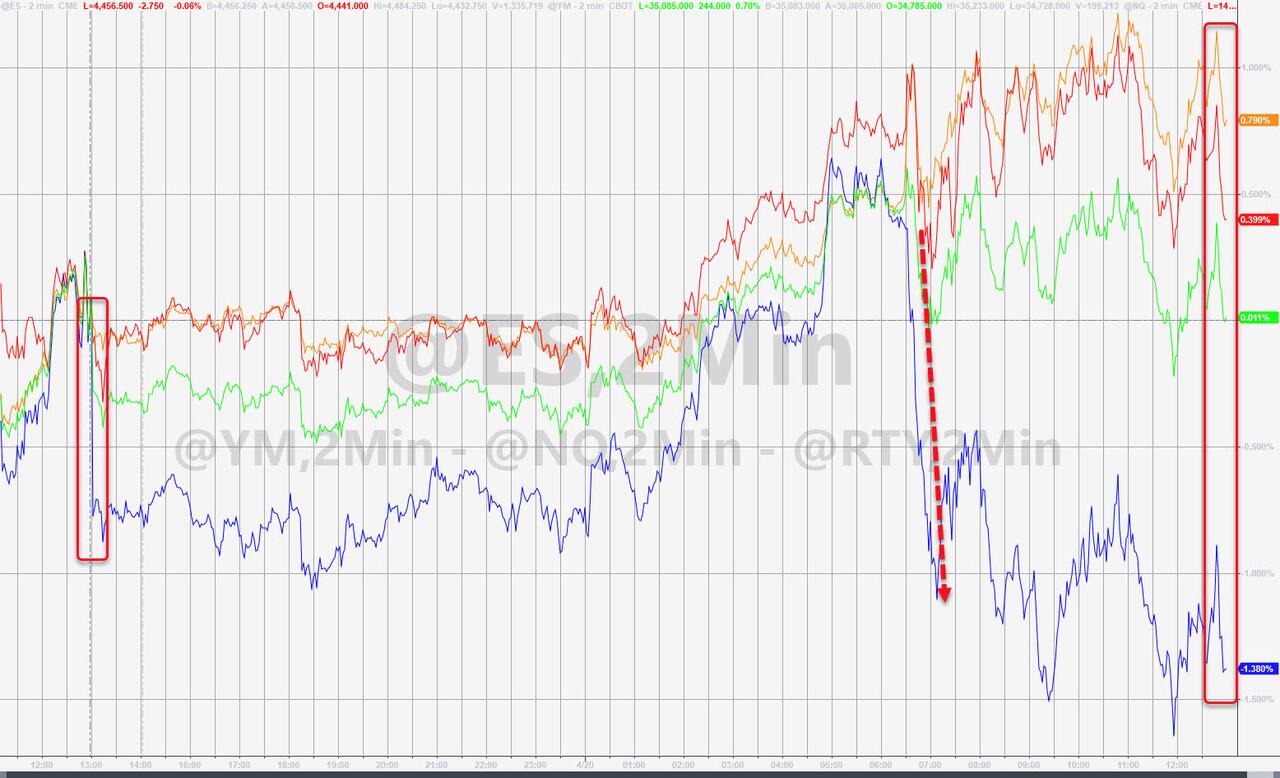
While the Dow continued to pump all day, the other two major indexes did not find a driver to participate in the ramp-a-thon and ended the session in the red. The S&P 500 closed just about unchanged while the Nasdaq surrendered 1.22%.

The Nasdaq had been struggling all day, which was the result of Netflix tanking an epic -35% (-63.1% YTD), after having disclosed the loss of 200k subscribers in the last quarter along with weak results and guidance. The Dow was helped higher by strong earnings from Proctor & Gamble.

FactSet posted this:

Roughly 12% of S&P 500 companies have reported first-quarter earnings thus far, with 80% of those names beating analyst expectations,

But the real story that’s behind the market’s tepid reaction during earnings so far is the lack of corporate guidance.

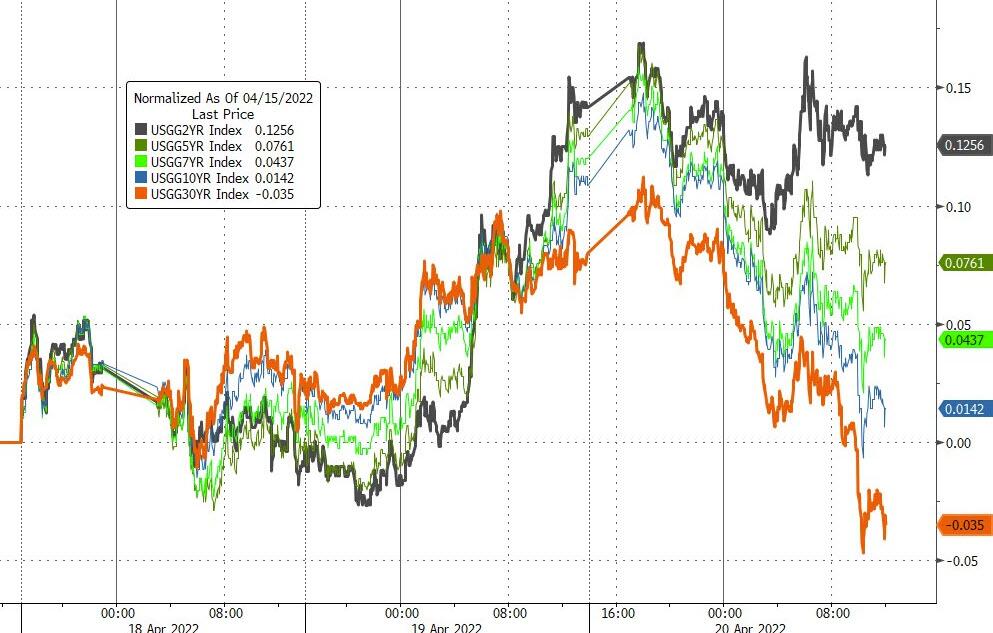
Bond yields sustained their drive higher with the 10-year touching the 2.94% level early on, its highest since late 2018, but closed lower by almost 10 basis points at 2.846%.

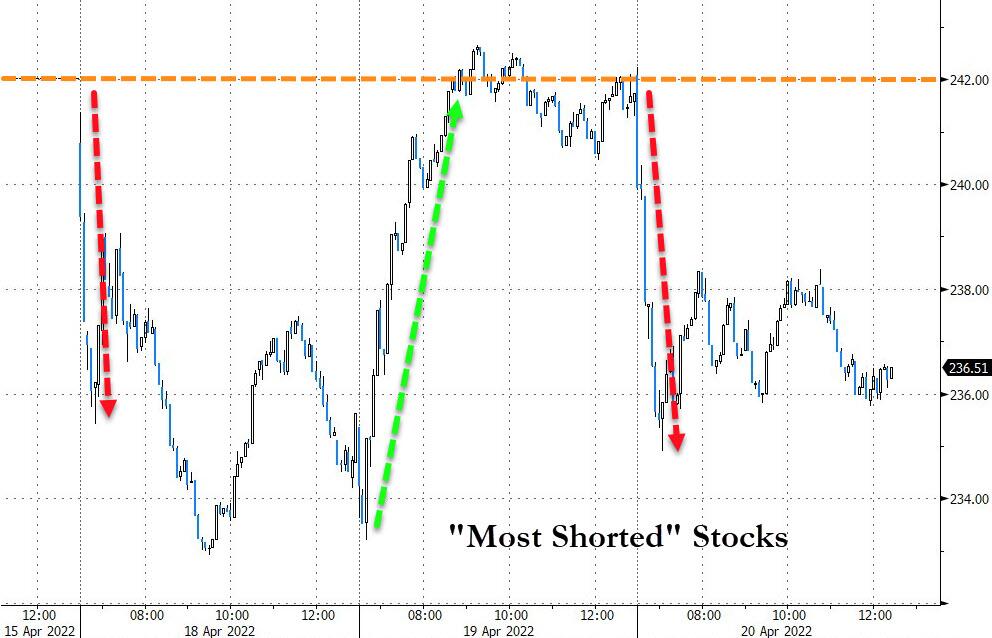
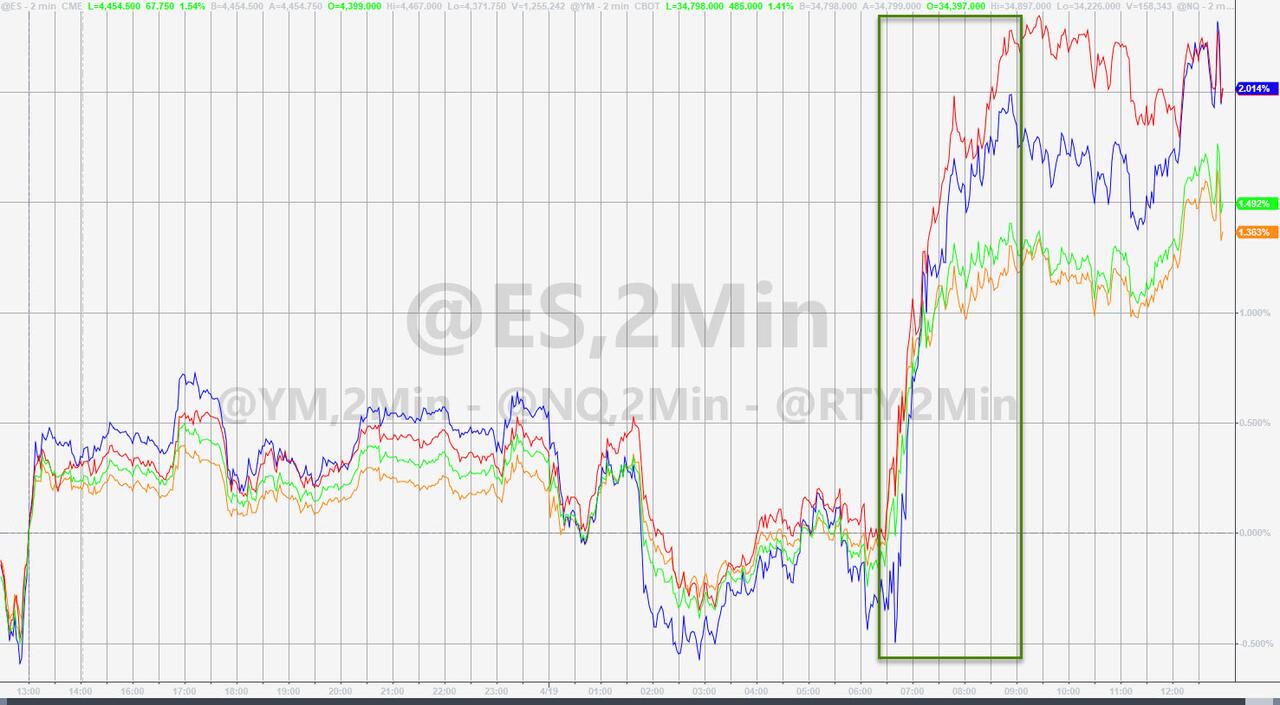
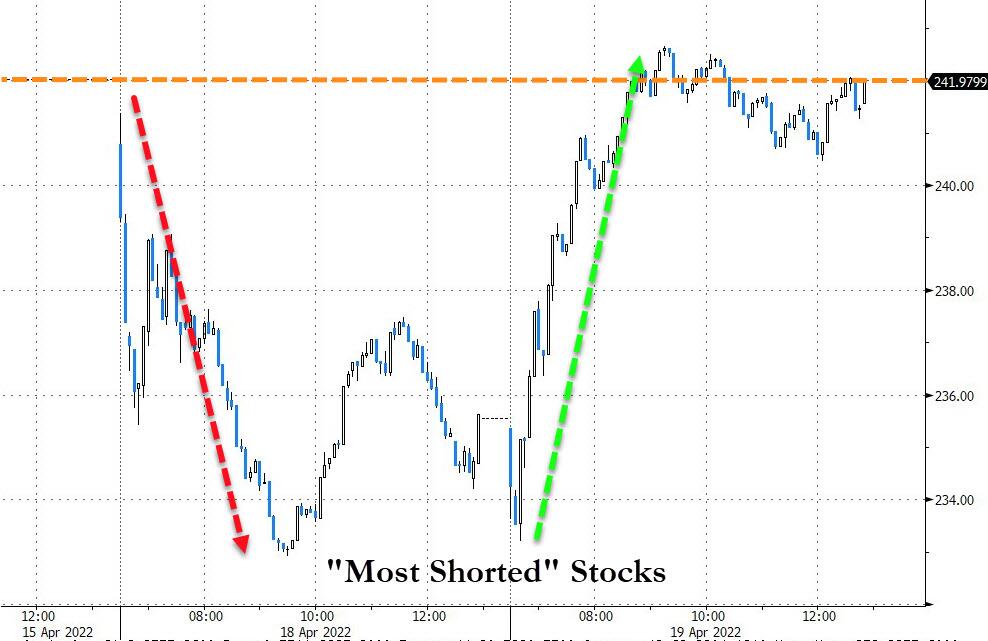
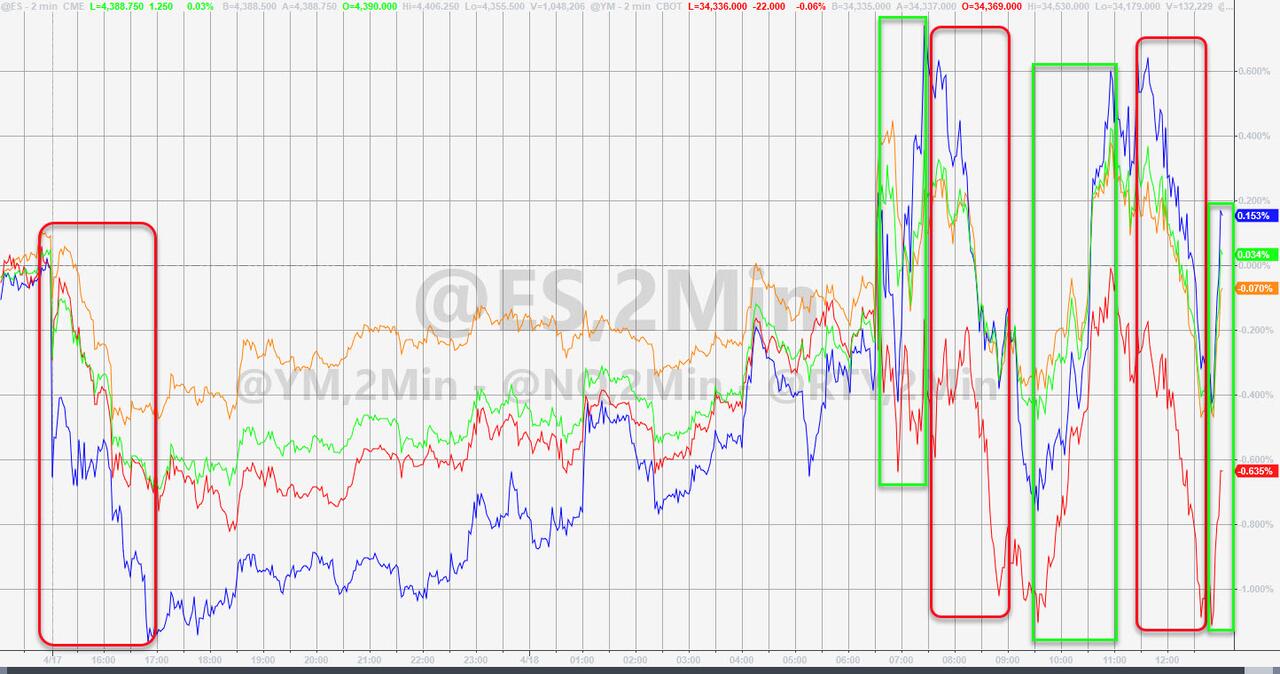
Noticeably absent was the short squeeze, which did an about face with member stocks tanking, as they are supposed to. Quipped Zero Hedge, after looking at this chart, tomorrow we should squeeze back up.   

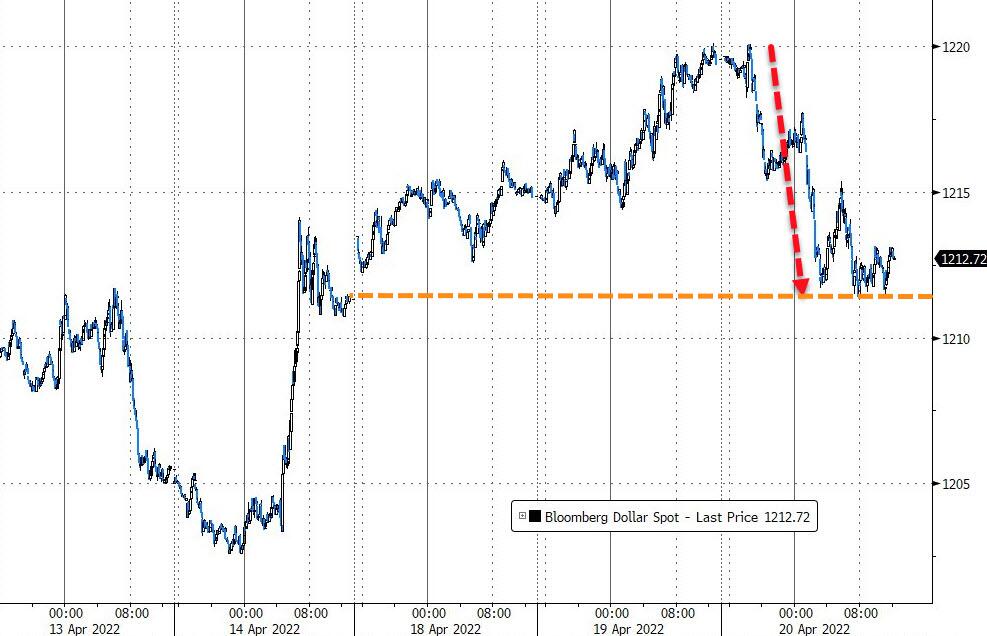
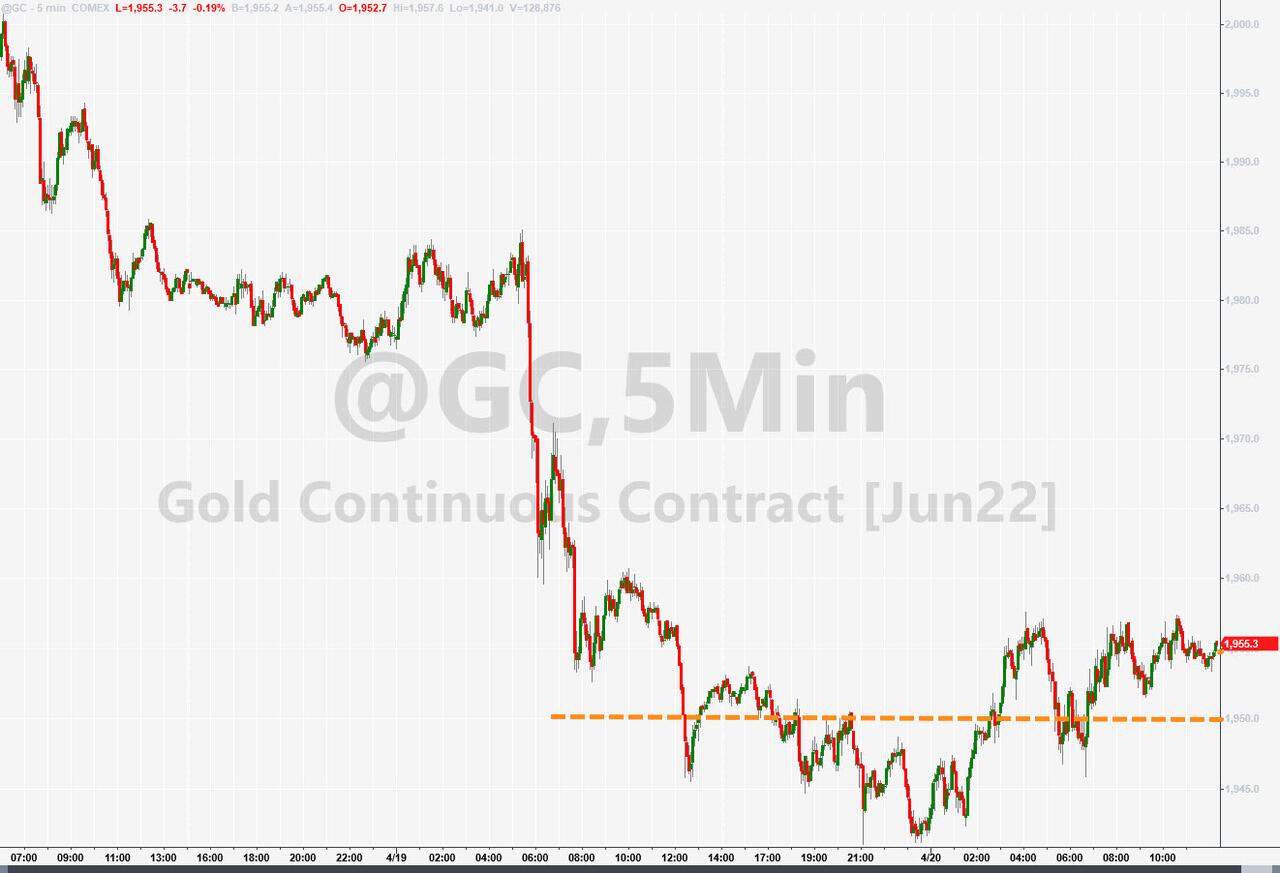
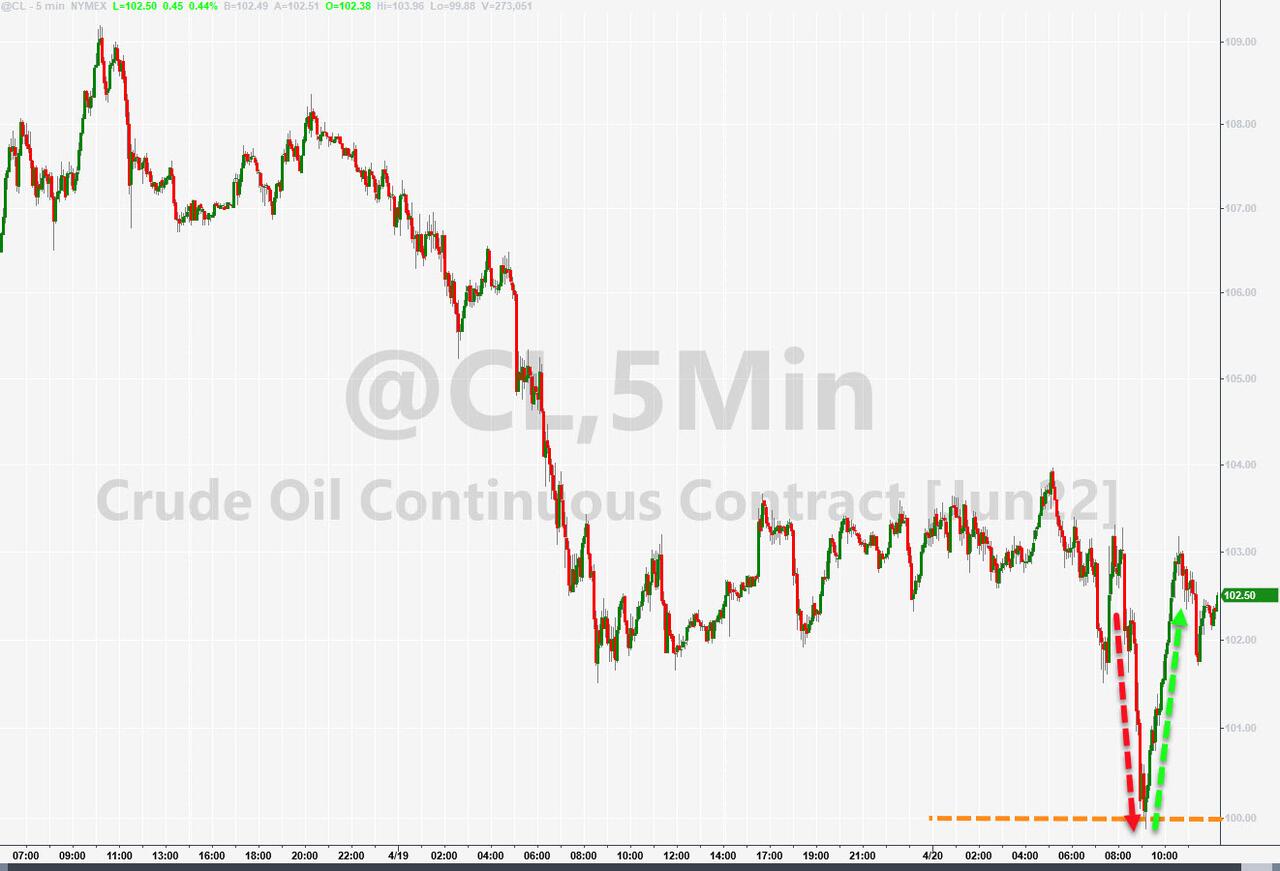
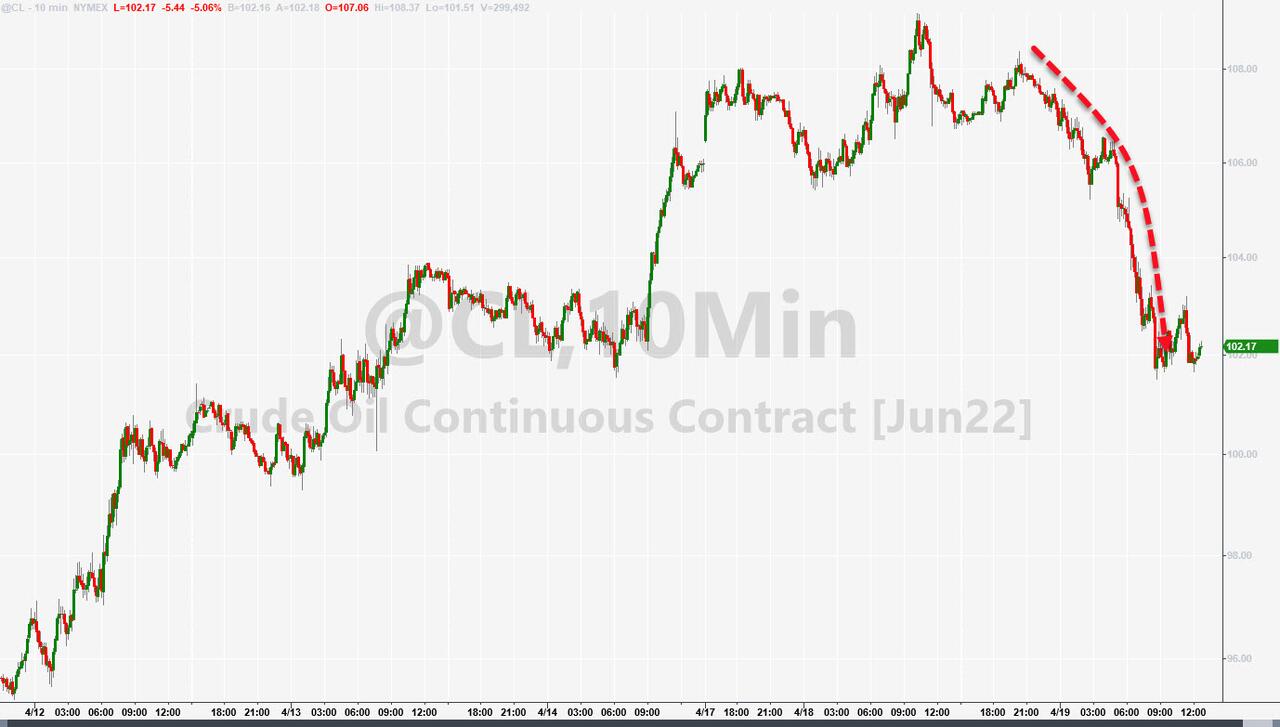
The dollar pulled off its lofty level, Gold ended up about unchanged, but the gold ETF GLD gained +0.49%, while Crude Oil dumped and pumped but closed above the $100 level.  

Read More

Boosted By Earnings

Ulli Market Commentary Contact

[Chart courtesy of MarketWatch.com]

  1. Moving the markets

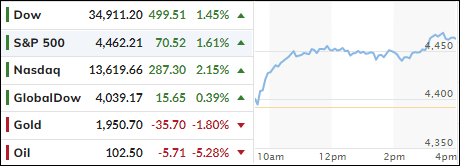
Today was comeback day with the S&P 500, after having fallen for two straight weeks, finally receiving a boost, along with the other major indexes, to end the session in the green. The Nasdaq led the charge with a gain of over 2%.

Some analysts contributed this bounce to sentiment and positioning as having been too bearish, hence a bullish response resulted, also because of better-than-expected bank earnings with Citizen’s Financial jumping more than 7%, while powerhouse JP Morgan added a more modest 2%.

A few tech and media companies like Disney (+3.8%) and Netflix (+3.7%) joined the party, while Microsoft and Alphabet each gained over 1%. “Despite recession concerns, the underlying economic data have been holding up fairly well,” added a strategist at Edward Jones.

Still, this solid rebound was astounding for two reasons:

  1. It happened in the face of a continued surge in bond yields. The 10-year added almost 8 basis points (bps), to close the session at 2.94%, with the 3% level now in striking distance. It remains to be seen whether a break above it will bring bearish sentiment back in play.
  2. The world as a whole and the IMF have slashed global growth outlooks, slamming crude oil lower, while Fed mouthpiece Bullard threated with 75 bps hikes instead of the previously announced 50 bps.

Traders and algos did not care, and the rally was on thereby erasing some of the recent losses. And, as you might have expected, the ever-lurking short squeeze gave an assist and helped sustain the bounce into the close.  

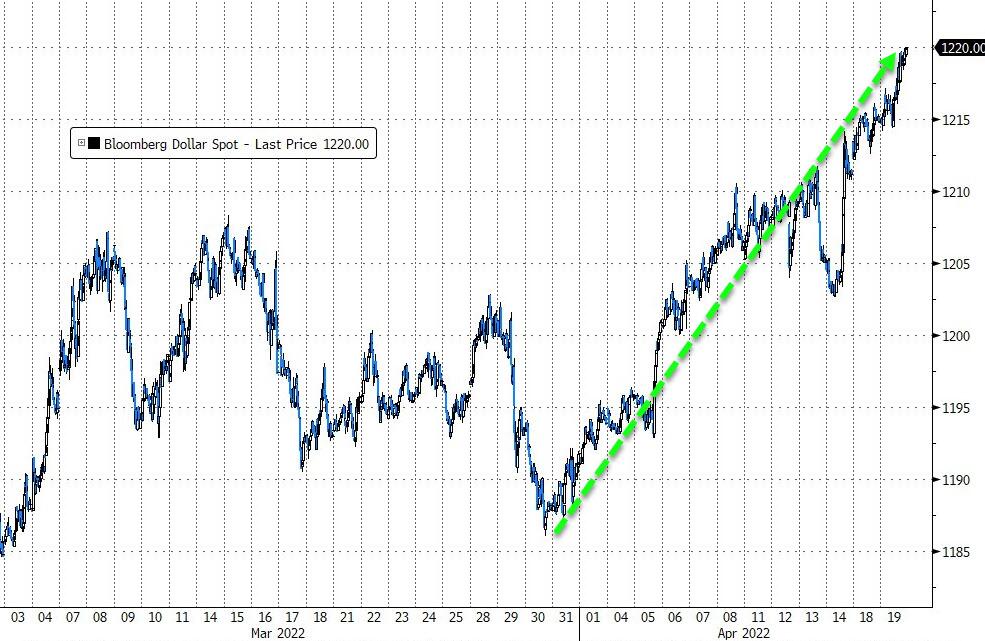
With yields heading higher, the US Dollar followed suit and reached its top level since June 2020, according to ZH. Gold was the victim of the dollar and bond yield surges and gave back some of its recent advances.

Read More

Snaking Aimlessly Along The Unchanged Lines

Ulli Market Commentary Contact

[Chart courtesy of MarketWatch.com]

  1. Moving the markets

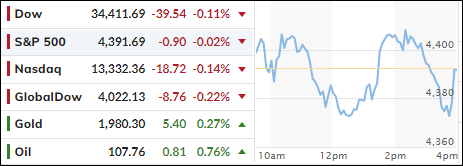
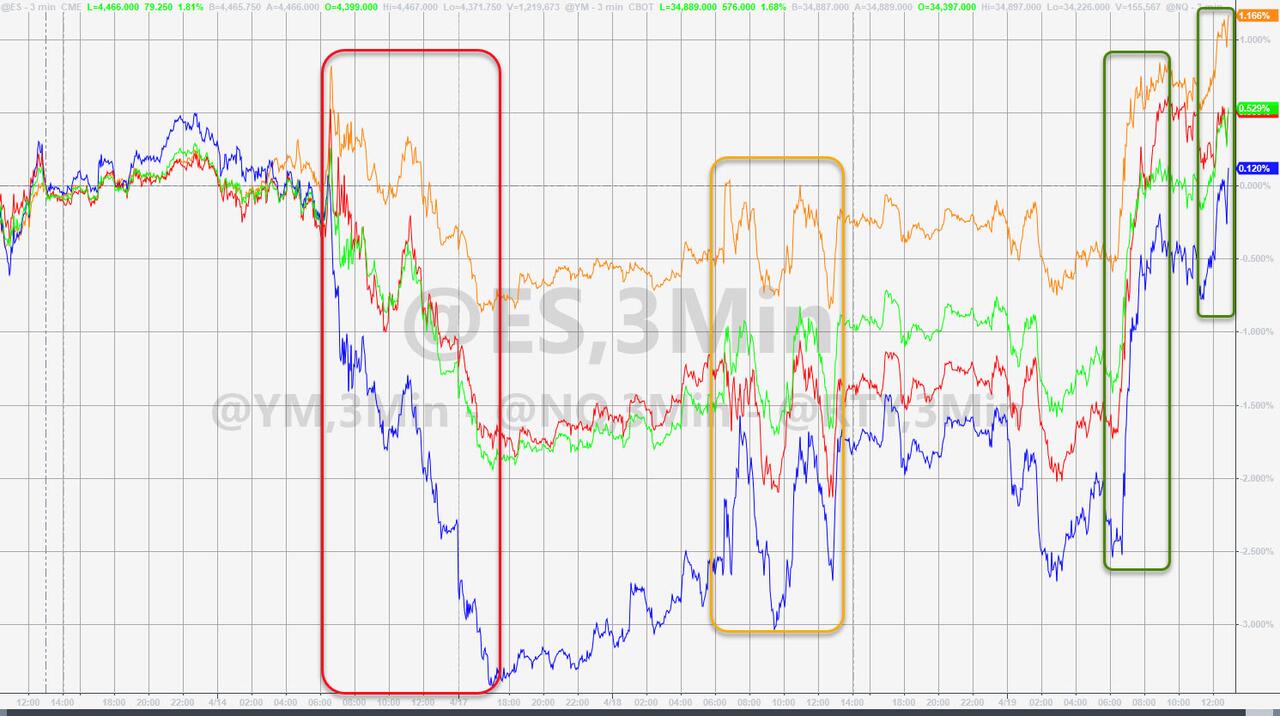
The major indexes snaked aimlessly above and below their respective unchanged lines without making headway, as ephemeral gains were quickly surrendered with uncertainty about interest rates, while a flood of upcoming earnings reports kept the bulls and bears in check.

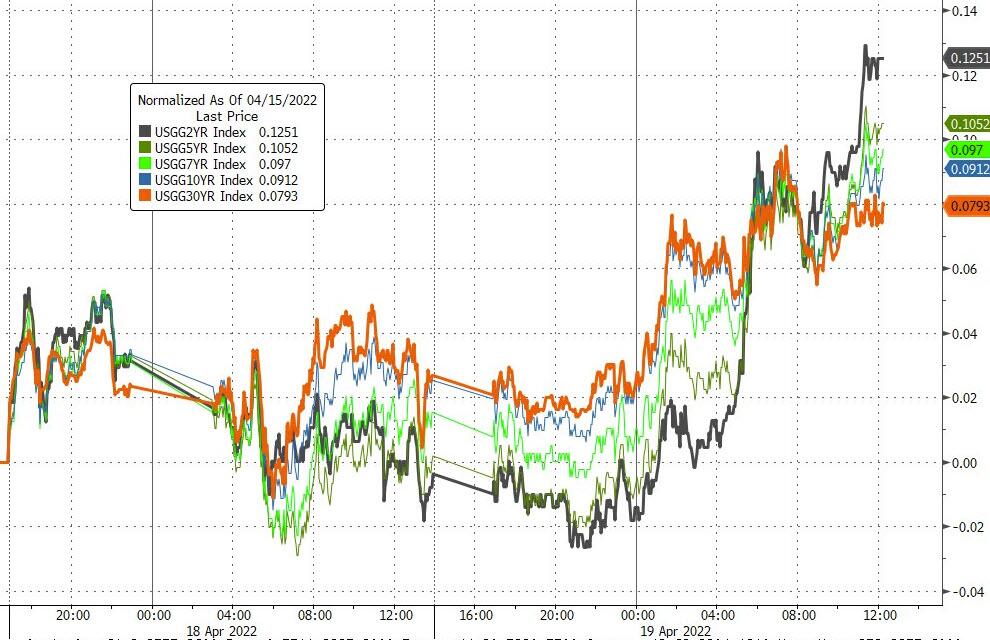
It was a rollercoaster ride with the 10-year bond yield touching 2.88%, which was its highest since late 2018. As recently as March 1, that yield stood at 1.71% and exploded upward by almost 10% due to the Fed announcing a more aggressive stance of fighting inflation.

The big unknown is how far bond yields will rise, and stocks fall, before the Fed caves and saves the markets again, as it did the end of 2018. Or will it be different this time?

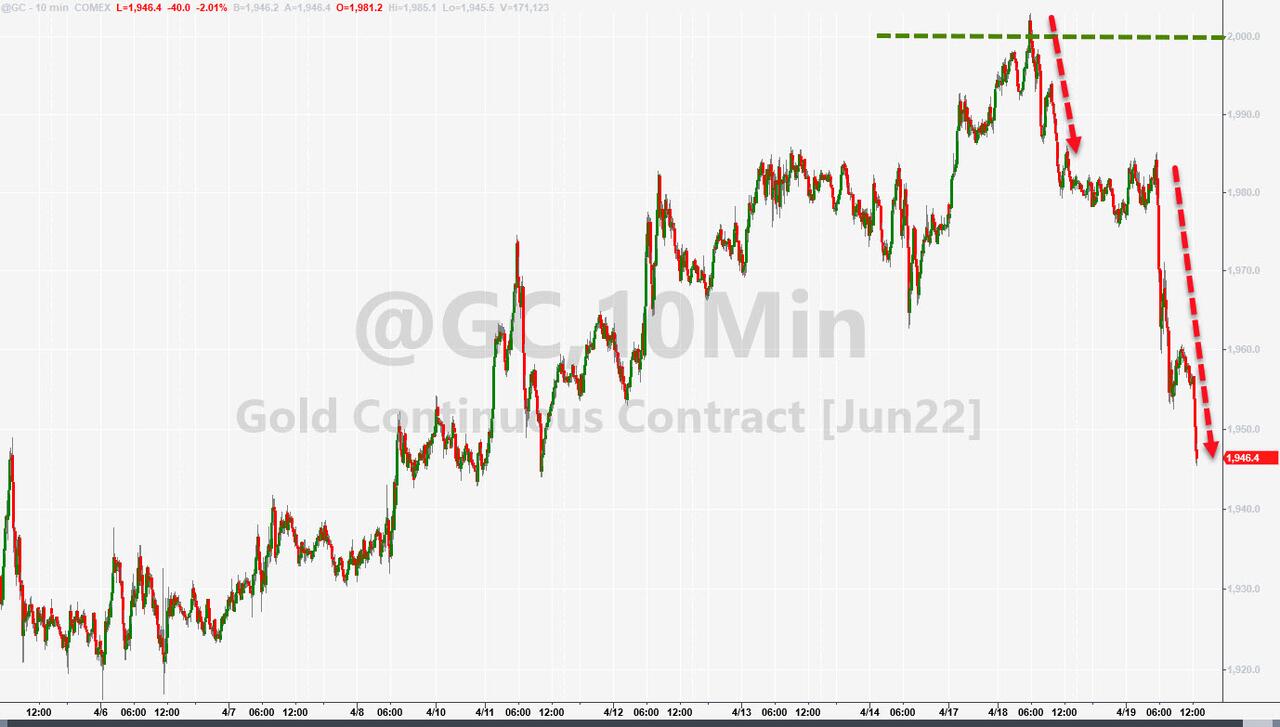
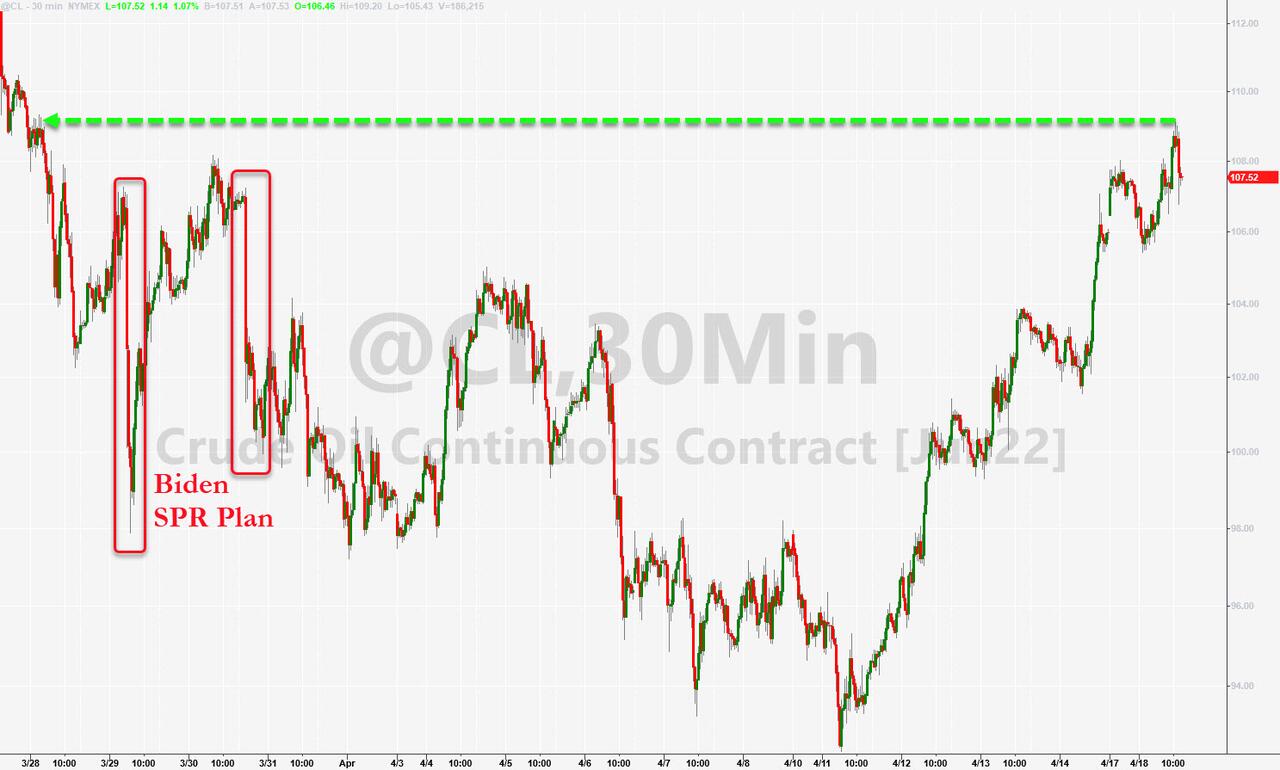
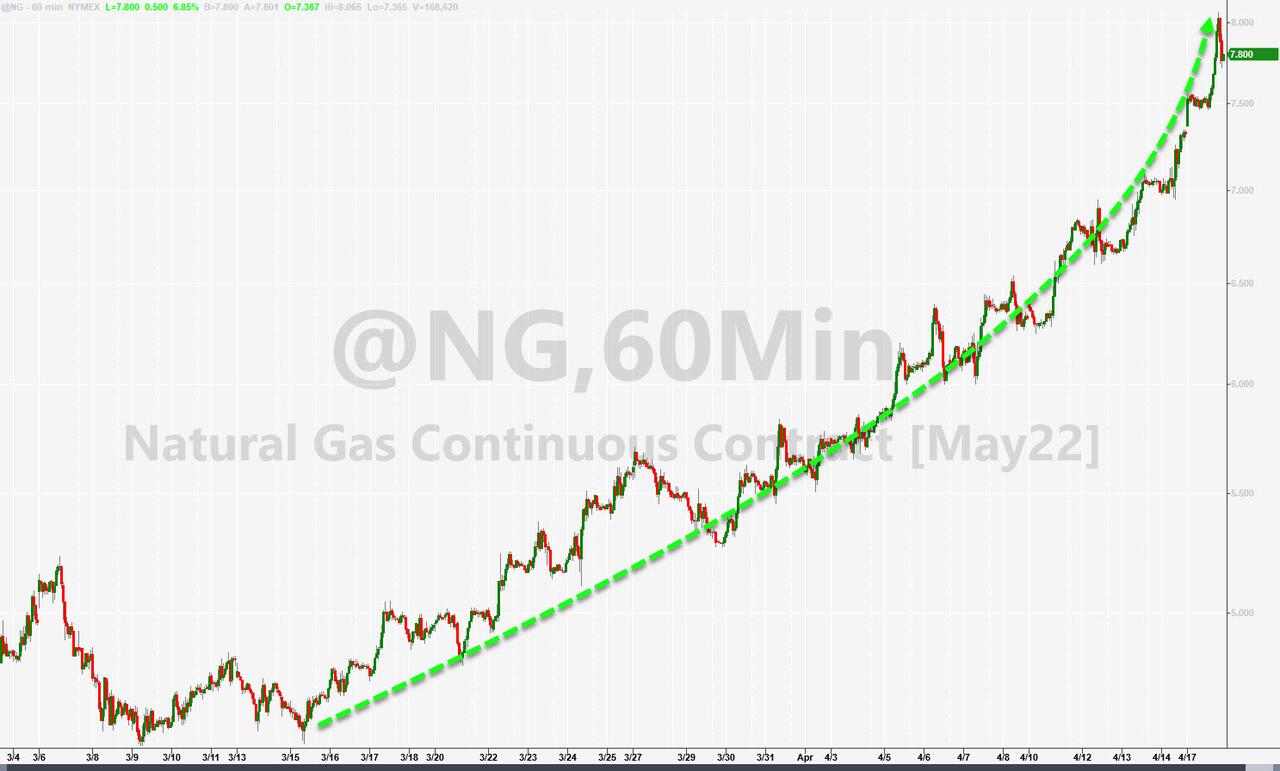
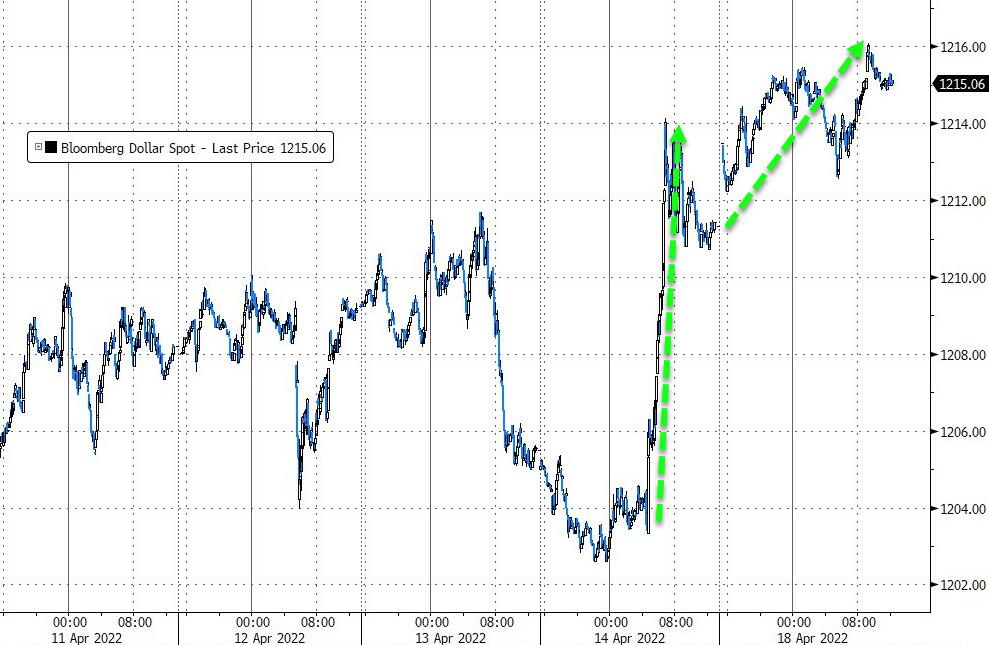
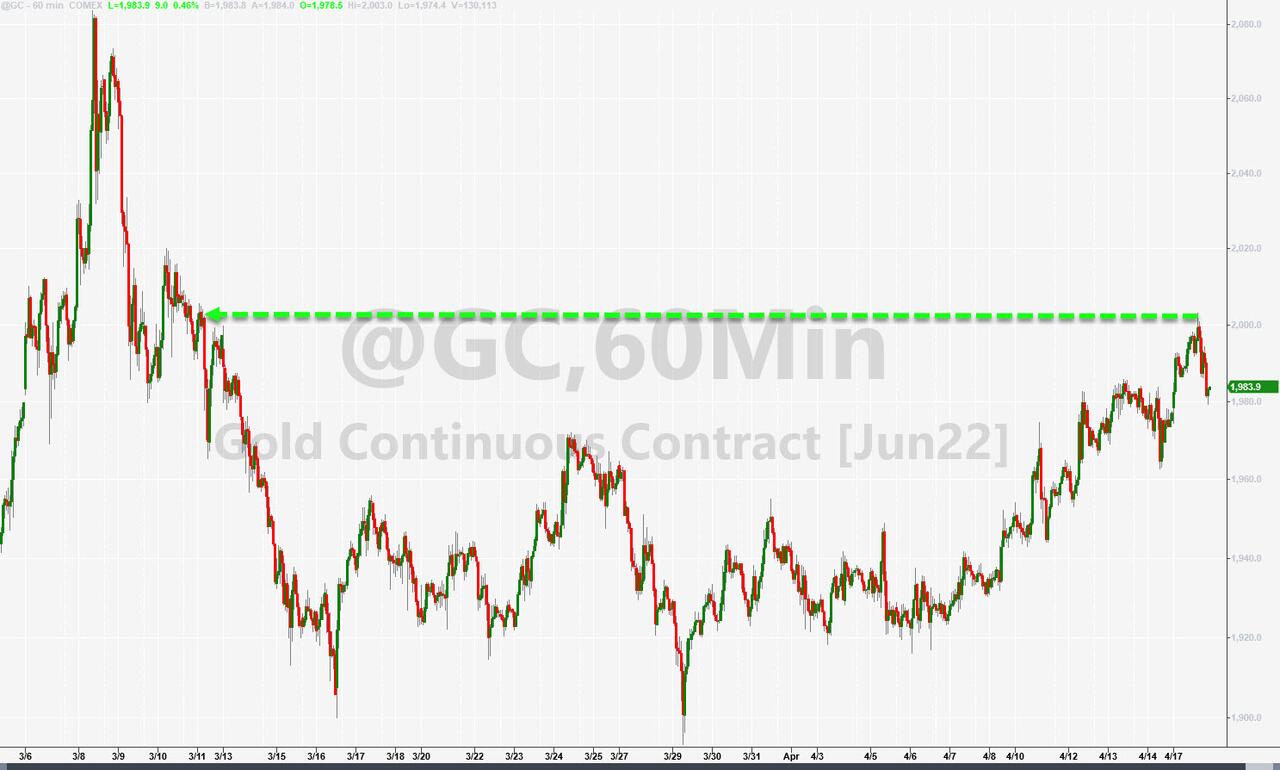
Commodities continued their surge (DBC +1.14%) with Crude Oil heading towards $108, and Natural Gas climbing above $8 for the first time since 2008, as ZH pointed out. March’s massive short squeeze appears to have run out of ammo, the US Dollar ramped higher, while Gold briefly surpassed it $2k level before fading below it.

All eyes are on the earnings reports of the bellwether tech firms, which may set the directional tone for the remainder of the month. A big ingredient of these reports will be forward guidance, as increased costs will be a real challenge for all companies.

Read More

Weekly StatSheet For The ETF Tracker Newsletter – Updated Through 04/14/2022

Ulli Uncategorized Contact

ETF Data updated through Thursday, April 14, 2022

Methodology/Use of this StatSheet:

1. From the universe of over 1,800 ETFs, I have selected only those with a trading volume of over $5 million per day (HV ETFs), so that liquidity and a small bid/ask spread are assured.

2. Trend Tracking Indexes (TTIs)

Buy or Sell decisions for Domestic and International ETFs (section 1 and 2), are made based on the respective TTI and its position either above or below its long-term M/A (Moving Average). A crossing of the trend line from below accompanied by some staying power above constitutes a “Buy” signal. Conversely, a clear break below the line constitutes a “Sell” signal. Additionally, I use an 12% trailing stop loss on all positions in these categories to control downside risk.

3. All other investment arenas do not have a TTI and should be traded based on the position of the individual ETF relative to its own respective trend line (%M/A). That’s why those signals are referred to as a “Selective Buy.” In other words, if an ETF crosses its own trendline to the upside, a “Buy” signal is generated. Here too, I recommend trailing sell stop of 12%, or less, depending on your risk tolerance.

If you are unfamiliar with some of the terminology, please see Glossary of Terms and new subscriber information in section 9.     

1. DOMESTIC EQUITY ETFs: SELL — since 02/24/2022

Click on chart to enlarge

Our main directional indicator, the Domestic Trend Tracking Index (TTI-green line in the above chart) has only broken above its long-term trend line (red) by +0.22% and remains in “SELL” mode—although it is on the edge of moving back to the Buy side.

Read More