
- Moving the markets
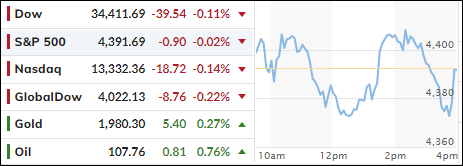
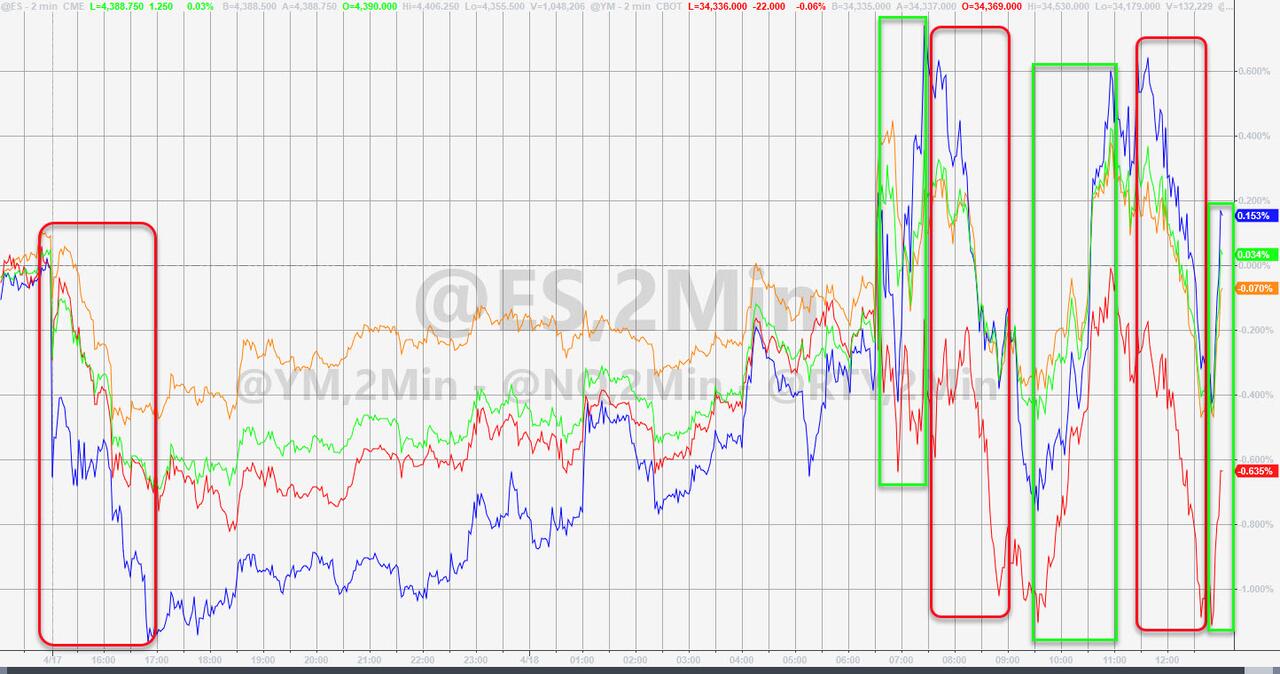
The major indexes snaked aimlessly above and below their respective unchanged lines without making headway, as ephemeral gains were quickly surrendered with uncertainty about interest rates, while a flood of upcoming earnings reports kept the bulls and bears in check.
It was a rollercoaster ride with the 10-year bond yield touching 2.88%, which was its highest since late 2018. As recently as March 1, that yield stood at 1.71% and exploded upward by almost 10% due to the Fed announcing a more aggressive stance of fighting inflation.
The big unknown is how far bond yields will rise, and stocks fall, before the Fed caves and saves the markets again, as it did the end of 2018. Or will it be different this time?
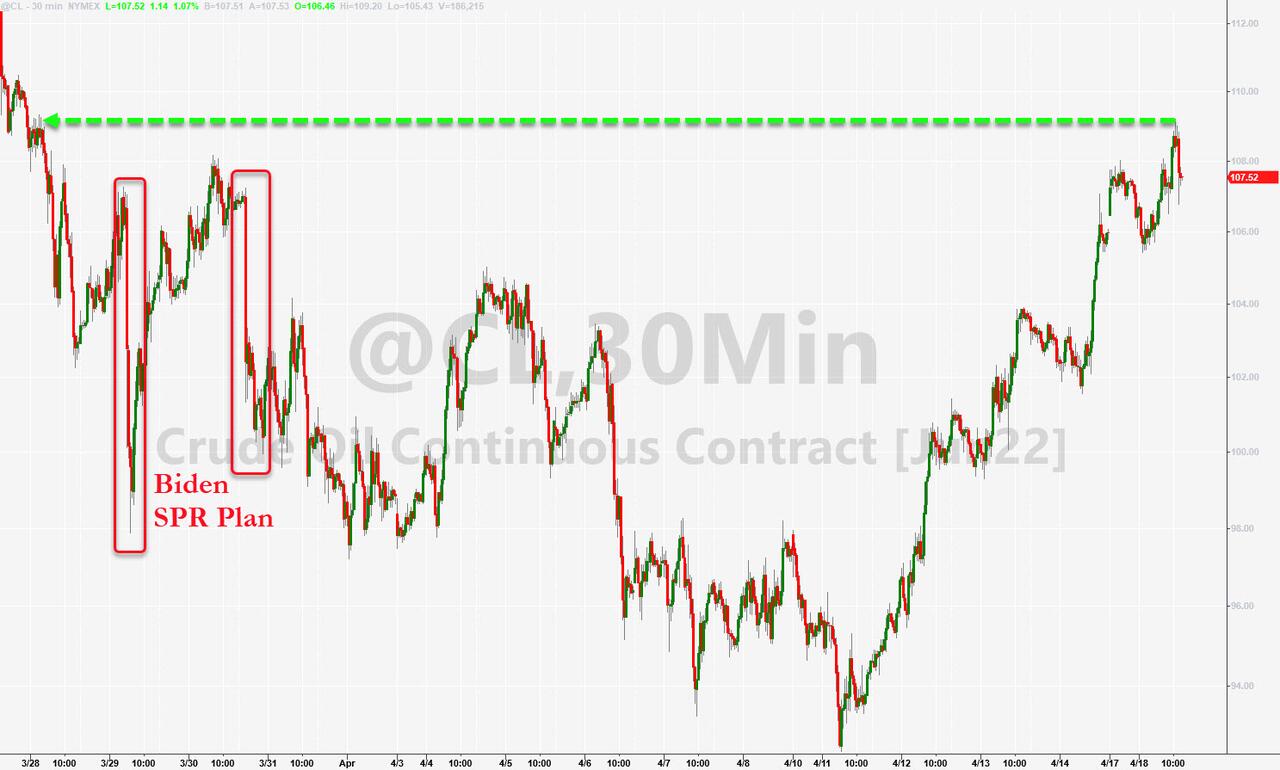
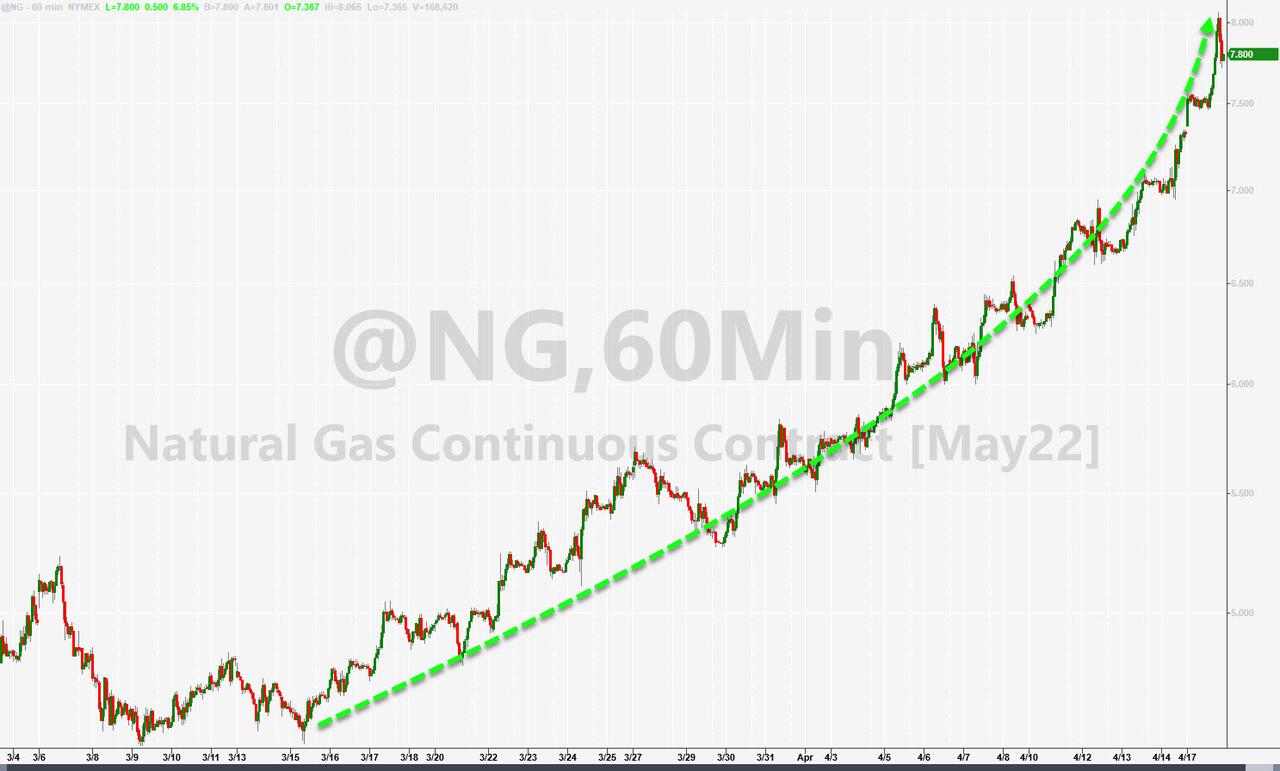
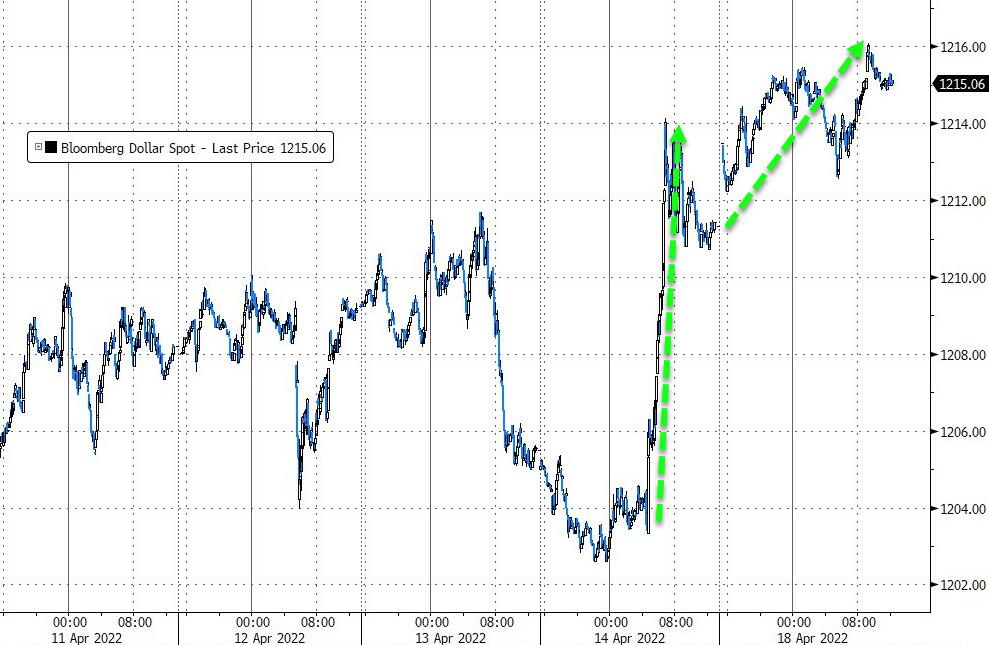
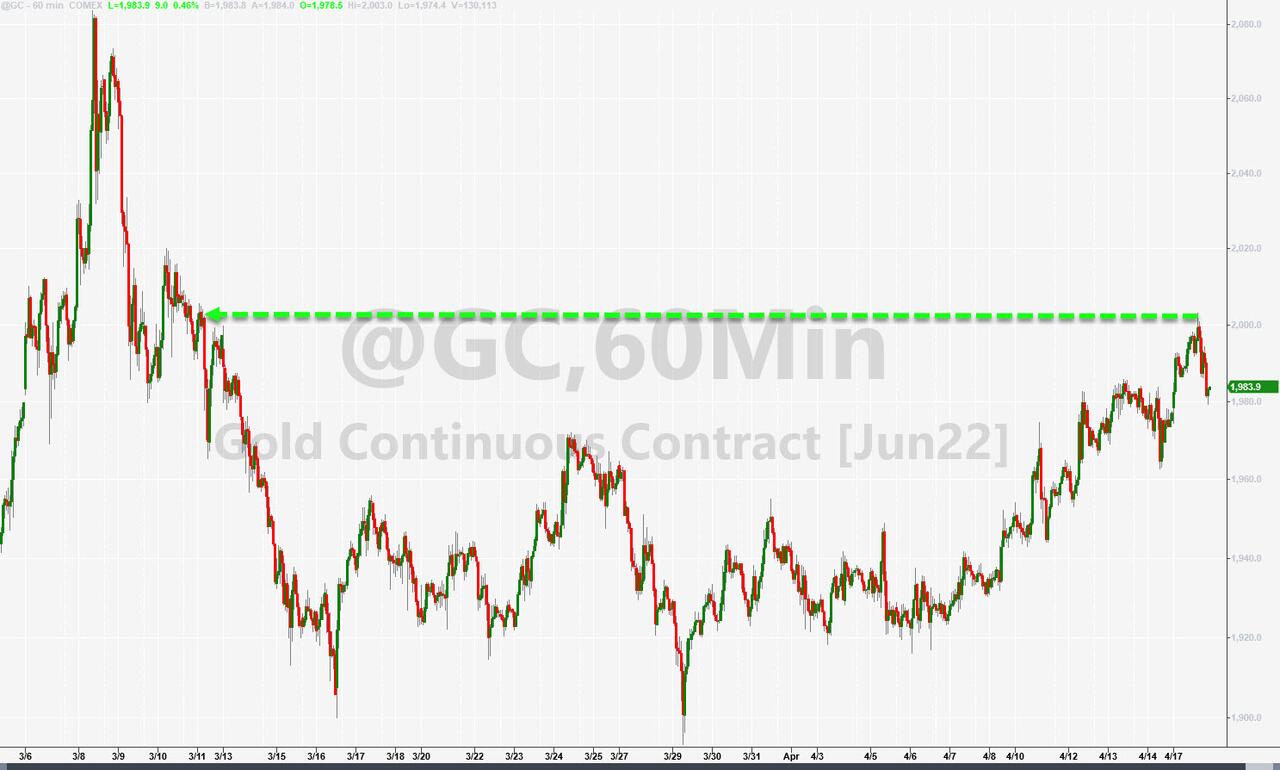
Commodities continued their surge (DBC +1.14%) with Crude Oil heading towards $108, and Natural Gas climbing above $8 for the first time since 2008, as ZH pointed out. March’s massive short squeeze appears to have run out of ammo, the US Dollar ramped higher, while Gold briefly surpassed it $2k level before fading below it.
All eyes are on the earnings reports of the bellwether tech firms, which may set the directional tone for the remainder of the month. A big ingredient of these reports will be forward guidance, as increased costs will be a real challenge for all companies.
2. ETFs in the Spotlight
In case you missed the announcement and description of this section, you can read it here again.
It features some of the 10 broadly diversified domestic and sector ETFs from my HighVolume list as posted every Saturday. Furthermore, they are screened for the lowest MaxDD% number meaning they have been showing better resistance to temporary sell offs than all others over the past year.
The below table simply demonstrates the magnitude with which these ETFs are fluctuating above or below their respective individual trend lines (%+/-M/A). A break below, represented by a negative number, shows weakness, while a break above, represented by a positive percentage, shows strength.
For hundreds of ETF choices, be sure to reference Thursday’s StatSheet.
For this just closed-out domestic “Buy” cycle, here’s how some of our candidates have fared:
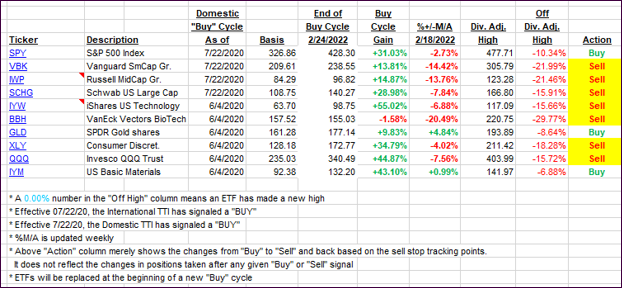
Click image to enlarge.
Again, the %+/-M/A column above shows the position of the various ETFs in relation to their respective long-term trend lines, while the trailing sell stops are being tracked in the “Off High” column. The “Action” column will signal a “Sell” once the -12% point has been taken out in the “Off High” column, which has replaced the prior -8% to -10% limits.
3. Trend Tracking Indexes (TTIs)
Our Domestic TTI dipped and currently sits right on its trend line, which divides bullish from bearish territory. It’s anyone’s guess which direction any future break out will take, so we will hold on to our current positions subject to our trailing sell stops.
This is how we closed 04/18/2022:
Domestic TTI: +0.01% above its M/A (prior close +0.22%)—Sell signal effective 02/24/2022.
International TTI: -1.14% below its M/A (prior close -0.81%)—Sell signal effective 03/08/2022.
Disclosure: I am obliged to inform you that I, as well as my advisory clients, own some of the ETFs listed in the above table. Furthermore, they do not represent a specific investment recommendation for you, they merely show which ETFs from the universe I track are falling within the specified guidelines.
All linked charts above are courtesy of Bloomberg via ZeroHedge.
Contact Ulli