
- Moving the markets
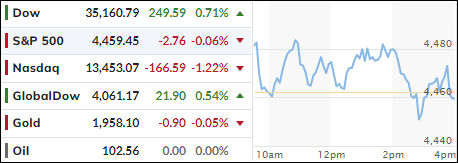
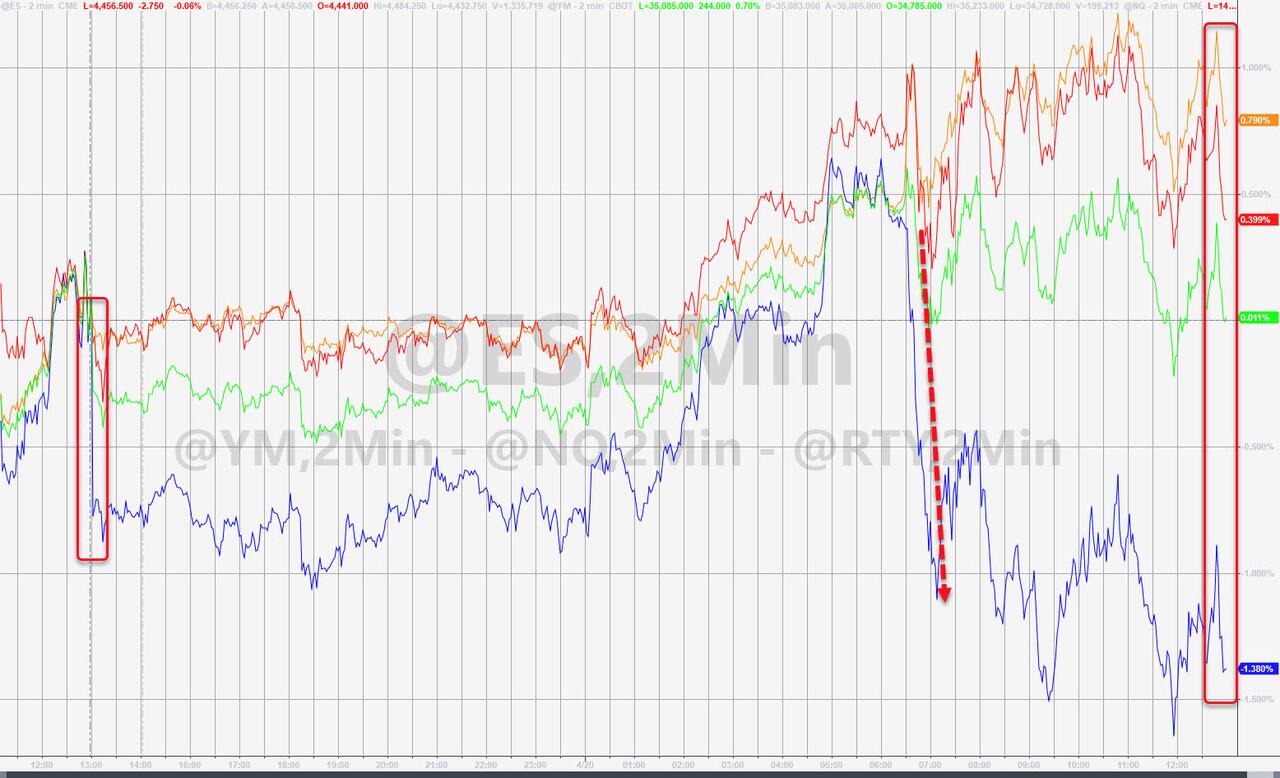
While the Dow continued to pump all day, the other two major indexes did not find a driver to participate in the ramp-a-thon and ended the session in the red. The S&P 500 closed just about unchanged while the Nasdaq surrendered 1.22%.
The Nasdaq had been struggling all day, which was the result of Netflix tanking an epic -35% (-63.1% YTD), after having disclosed the loss of 200k subscribers in the last quarter along with weak results and guidance. The Dow was helped higher by strong earnings from Proctor & Gamble.
FactSet posted this:
Roughly 12% of S&P 500 companies have reported first-quarter earnings thus far, with 80% of those names beating analyst expectations,
But the real story that’s behind the market’s tepid reaction during earnings so far is the lack of corporate guidance.
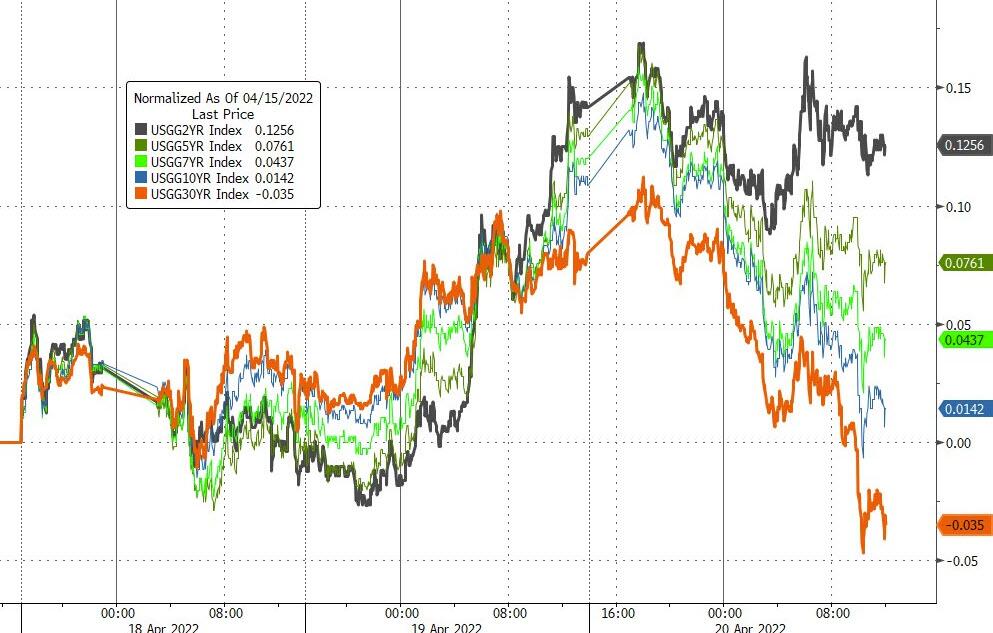
Bond yields sustained their drive higher with the 10-year touching the 2.94% level early on, its highest since late 2018, but closed lower by almost 10 basis points at 2.846%.
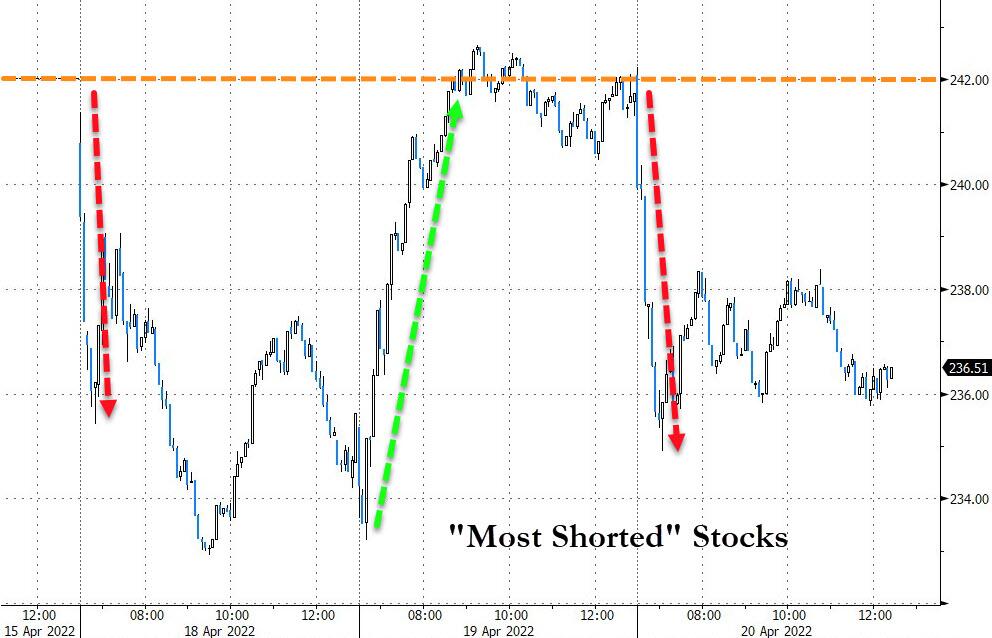
Noticeably absent was the short squeeze, which did an about face with member stocks tanking, as they are supposed to. Quipped Zero Hedge, after looking at this chart, tomorrow we should squeeze back up.
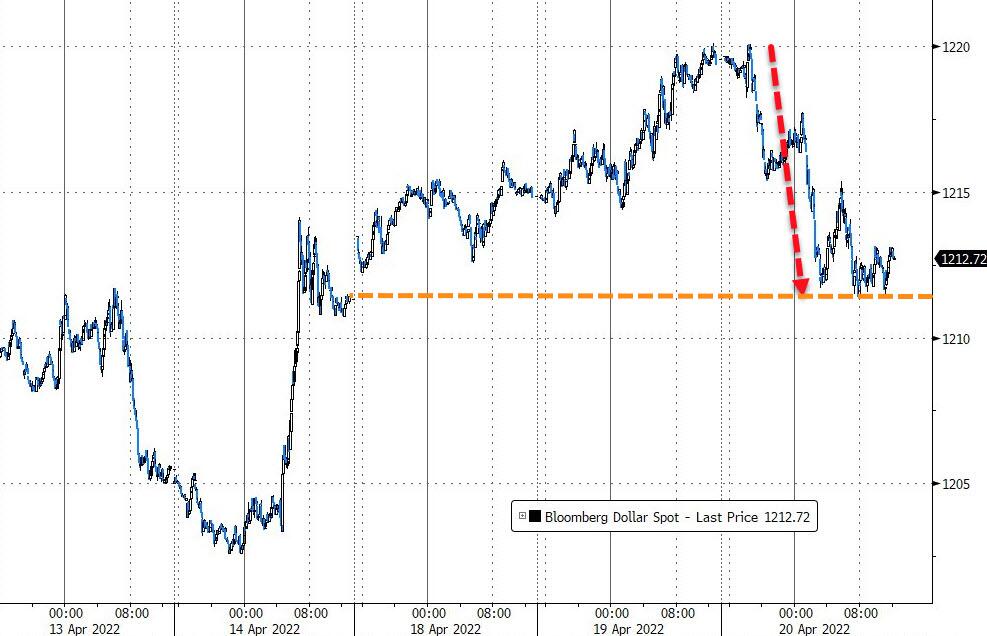
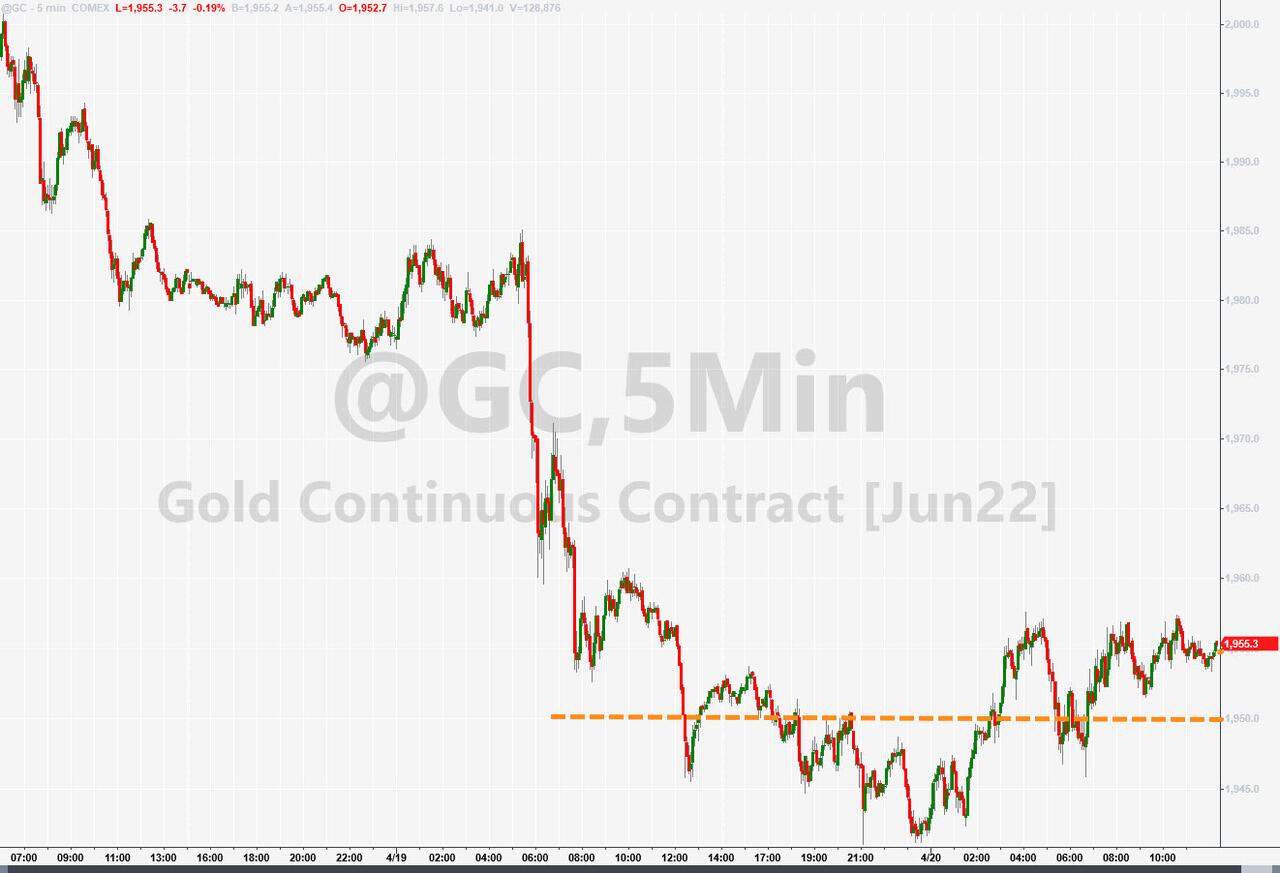
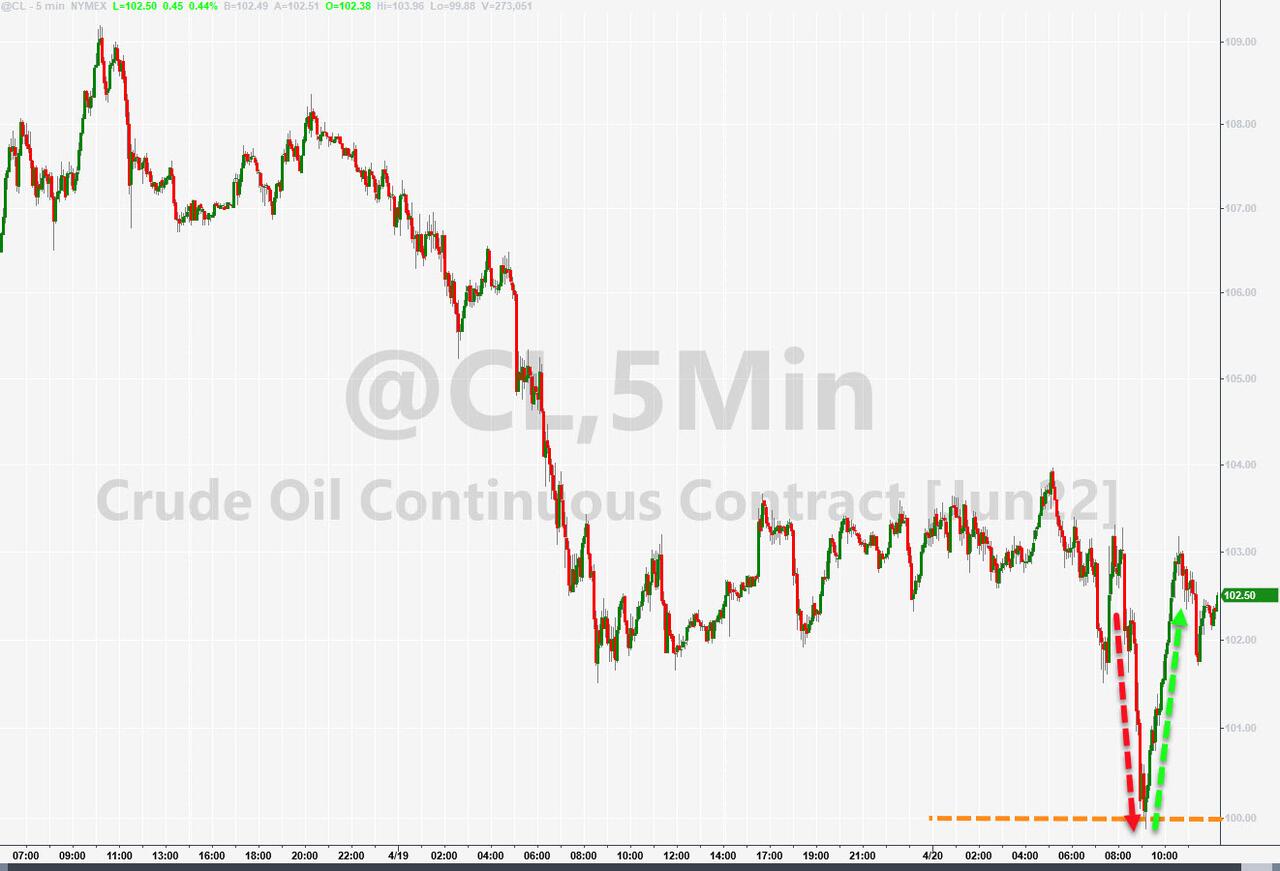
The dollar pulled off its lofty level, Gold ended up about unchanged, but the gold ETF GLD gained +0.49%, while Crude Oil dumped and pumped but closed above the $100 level.
2. ETFs in the Spotlight
In case you missed the announcement and description of this section, you can read it here again.
It features some of the 10 broadly diversified domestic and sector ETFs from my HighVolume list as posted every Saturday. Furthermore, they are screened for the lowest MaxDD% number meaning they have been showing better resistance to temporary sell offs than all others over the past year.
The below table simply demonstrates the magnitude with which these ETFs are fluctuating above or below their respective individual trend lines (%+/-M/A). A break below, represented by a negative number, shows weakness, while a break above, represented by a positive percentage, shows strength.
For hundreds of ETF choices, be sure to reference Thursday’s StatSheet.
For this just closed-out domestic “Buy” cycle, here’s how some of our candidates have fared:
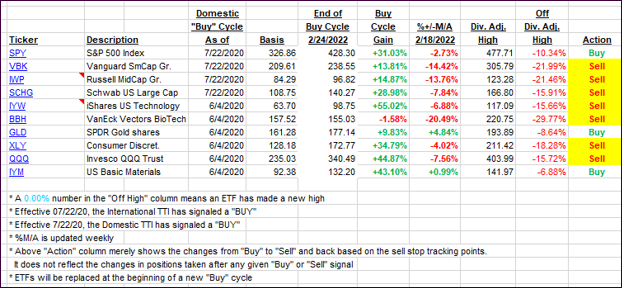
Click image to enlarge.
Again, the %+/-M/A column above shows the position of the various ETFs in relation to their respective long-term trend lines, while the trailing sell stops are being tracked in the “Off High” column. The “Action” column will signal a “Sell” once the -12% point has been taken out in the “Off High” column, which has replaced the prior -8% to -10% limits.
3. Trend Tracking Indexes (TTIs)
Our Domestic TTI moved higher, as the markets diverged and continued to struggle with rate hike and inflation discussions.
This is how we closed 04/20/2022:
Domestic TTI: +2.43% above its M/A (prior close +1.78%)—Sell signal effective 02/24/2022.
International TTI: -0.18% below its M/A (prior close -0.72%)—Sell signal effective 03/08/2022.
Disclosure: I am obliged to inform you that I, as well as my advisory clients, own some of the ETFs listed in the above table. Furthermore, they do not represent a specific investment recommendation for you, they merely show which ETFs from the universe I track are falling within the specified guidelines.
All linked charts above are courtesy of Bloomberg via ZeroHedge.
Contact Ulli