
- Moving the markets
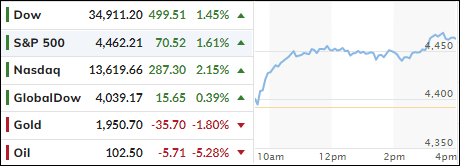
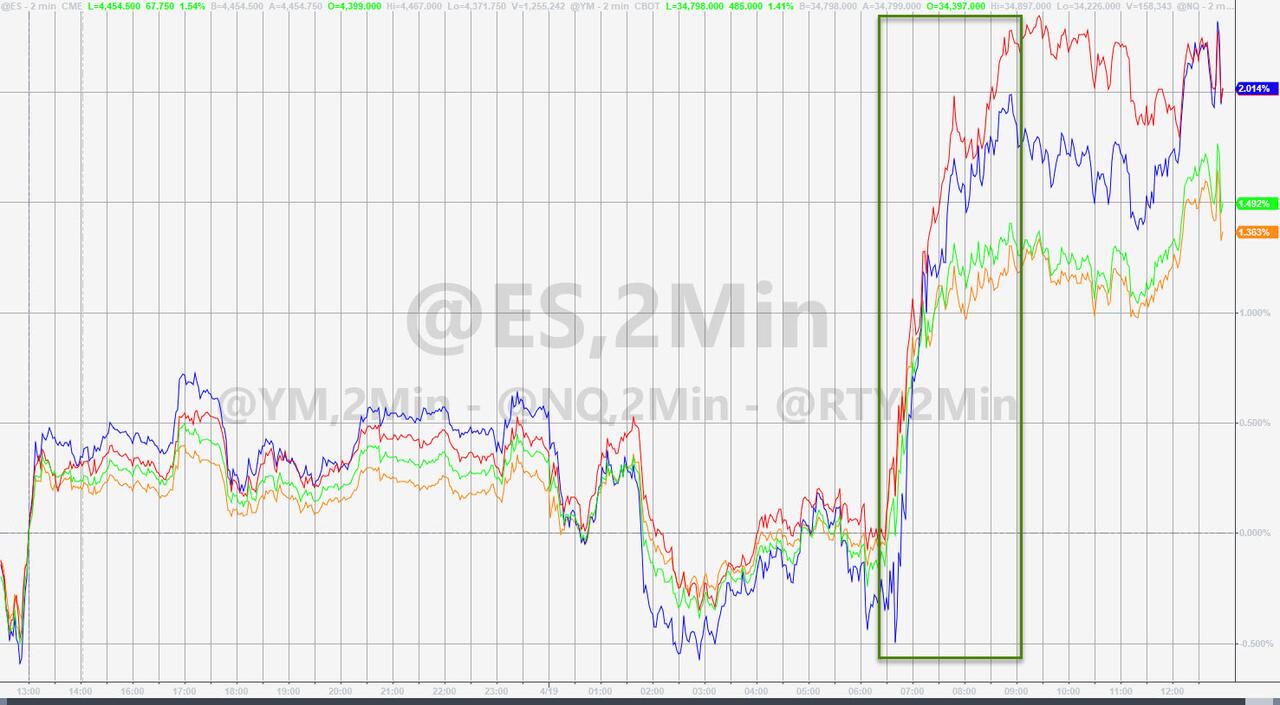
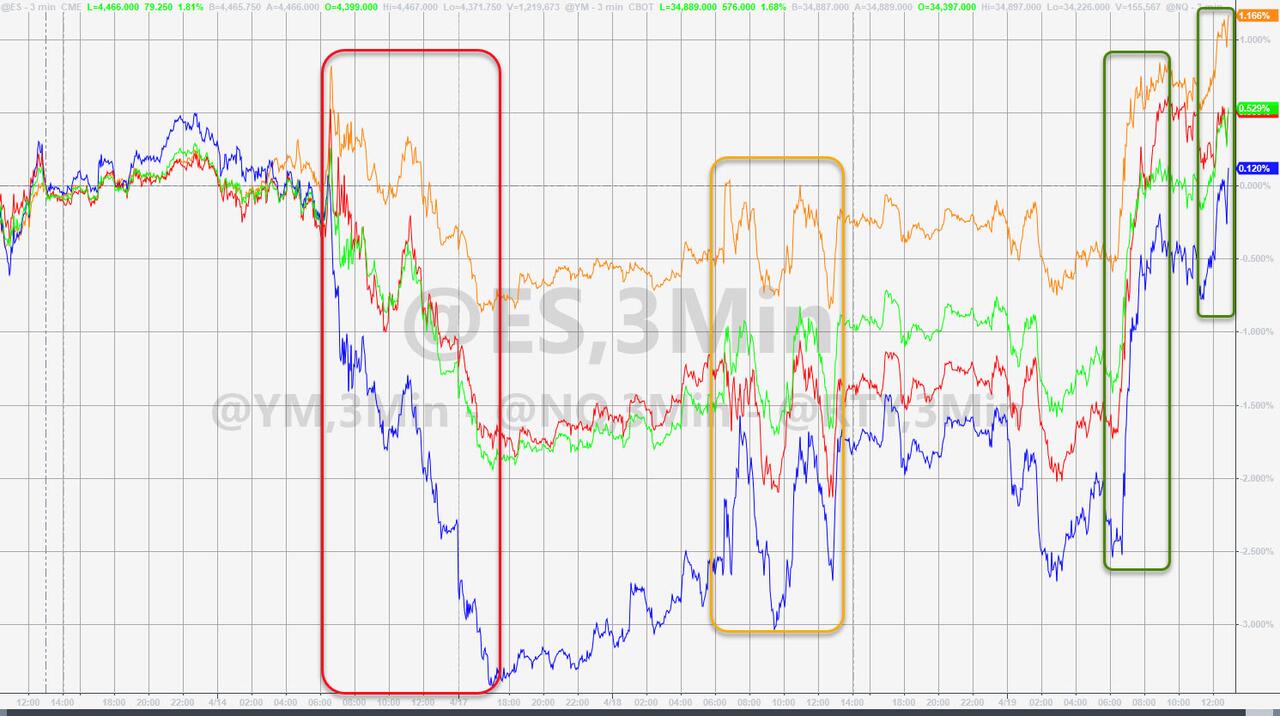
Today was comeback day with the S&P 500, after having fallen for two straight weeks, finally receiving a boost, along with the other major indexes, to end the session in the green. The Nasdaq led the charge with a gain of over 2%.
Some analysts contributed this bounce to sentiment and positioning as having been too bearish, hence a bullish response resulted, also because of better-than-expected bank earnings with Citizen’s Financial jumping more than 7%, while powerhouse JP Morgan added a more modest 2%.
A few tech and media companies like Disney (+3.8%) and Netflix (+3.7%) joined the party, while Microsoft and Alphabet each gained over 1%. “Despite recession concerns, the underlying economic data have been holding up fairly well,” added a strategist at Edward Jones.
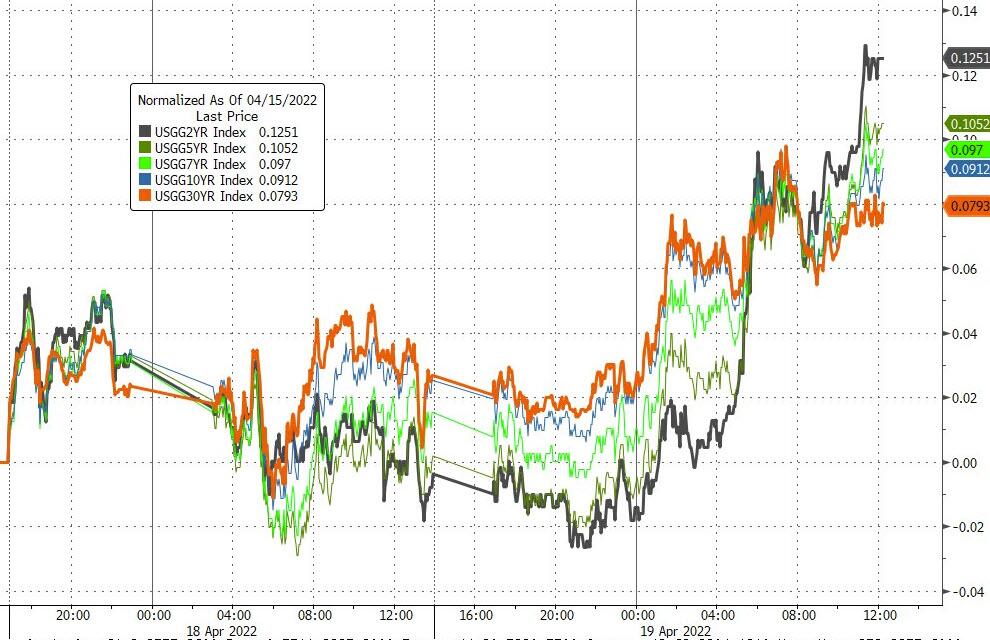
Still, this solid rebound was astounding for two reasons:
- It happened in the face of a continued surge in bond yields. The 10-year added almost 8 basis points (bps), to close the session at 2.94%, with the 3% level now in striking distance. It remains to be seen whether a break above it will bring bearish sentiment back in play.
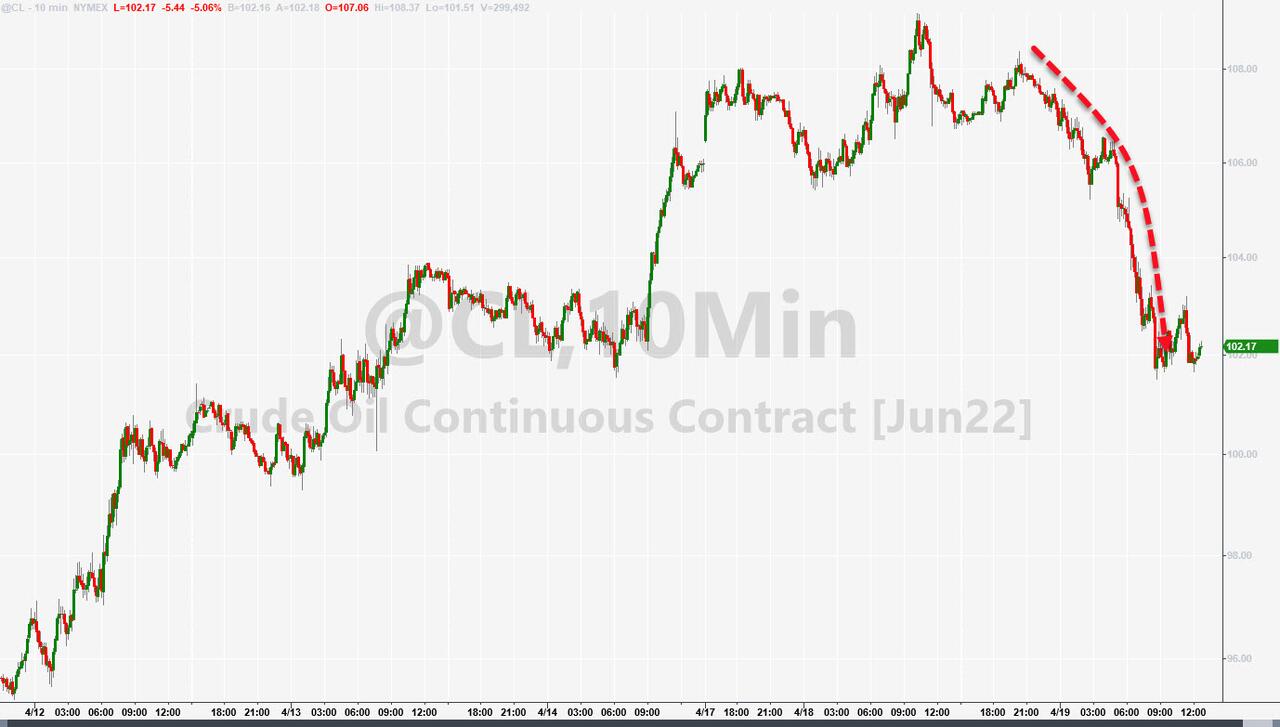
- The world as a whole and the IMF have slashed global growth outlooks, slamming crude oil lower, while Fed mouthpiece Bullard threated with 75 bps hikes instead of the previously announced 50 bps.
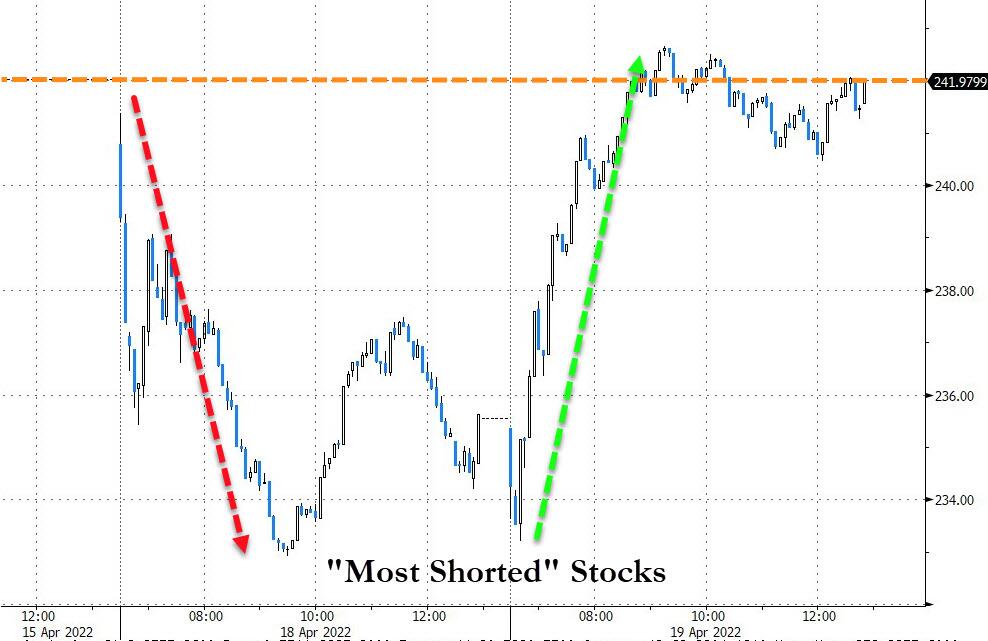
Traders and algos did not care, and the rally was on thereby erasing some of the recent losses. And, as you might have expected, the ever-lurking short squeeze gave an assist and helped sustain the bounce into the close.
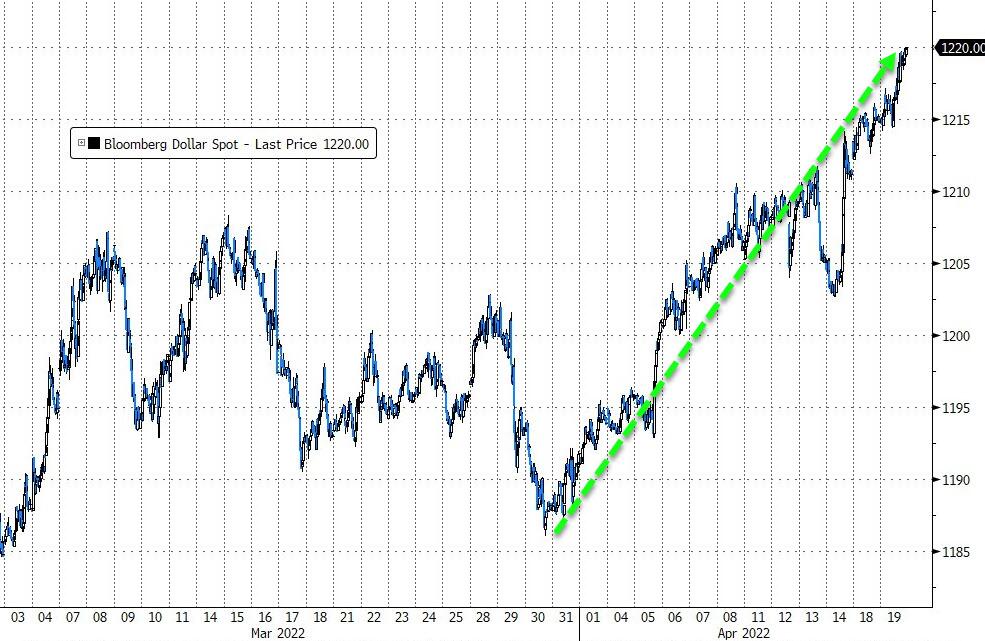
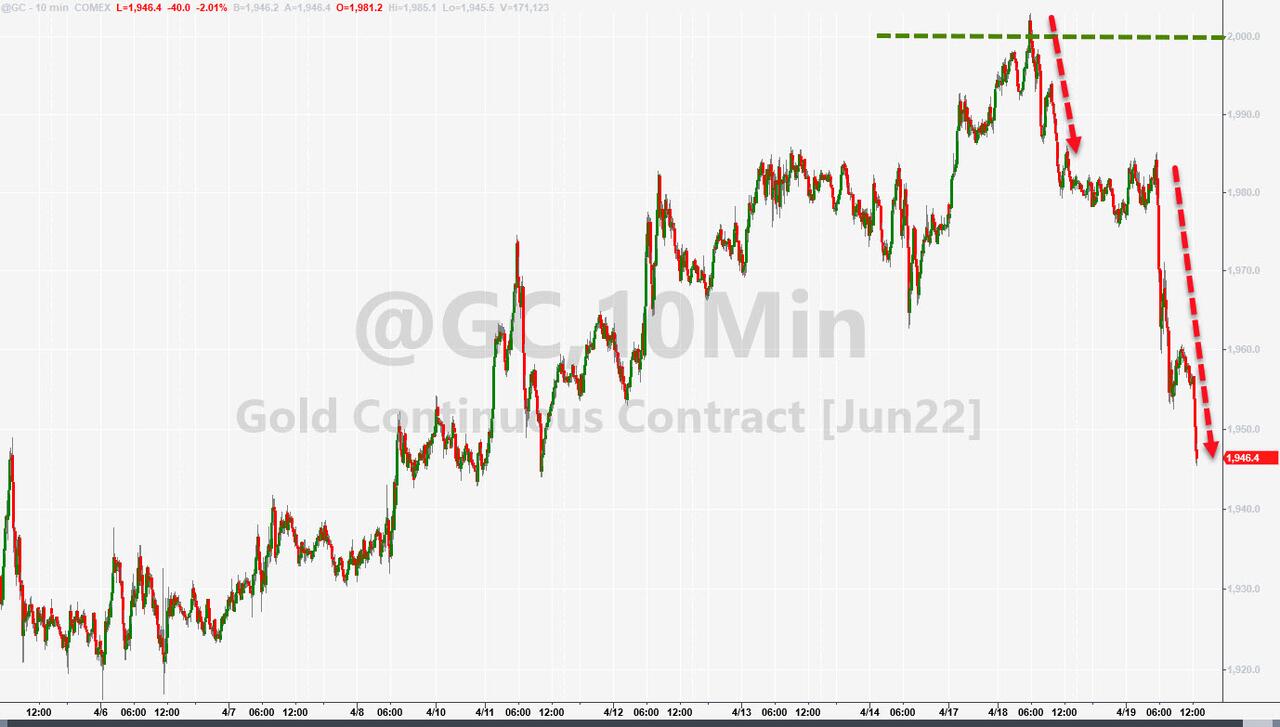
With yields heading higher, the US Dollar followed suit and reached its top level since June 2020, according to ZH. Gold was the victim of the dollar and bond yield surges and gave back some of its recent advances.
2. ETFs in the Spotlight
In case you missed the announcement and description of this section, you can read it here again.
It features some of the 10 broadly diversified domestic and sector ETFs from my HighVolume list as posted every Saturday. Furthermore, they are screened for the lowest MaxDD% number meaning they have been showing better resistance to temporary sell offs than all others over the past year.
The below table simply demonstrates the magnitude with which these ETFs are fluctuating above or below their respective individual trend lines (%+/-M/A). A break below, represented by a negative number, shows weakness, while a break above, represented by a positive percentage, shows strength.
For hundreds of ETF choices, be sure to reference Thursday’s StatSheet.
For this just closed-out domestic “Buy” cycle, here’s how some of our candidates have fared:
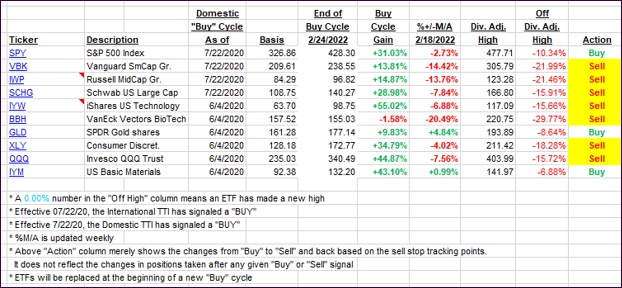
Click image to enlarge.
Again, the %+/-M/A column above shows the position of the various ETFs in relation to their respective long-term trend lines, while the trailing sell stops are being tracked in the “Off High” column. The “Action” column will signal a “Sell” once the -12% point has been taken out in the “Off High” column, which has replaced the prior -8% to -10% limits.
3. Trend Tracking Indexes (TTIs)
Our Domestic TTI reversed and bounced off its trend line. We’ll have to wait and see if this is sustainable or just an outlier.
This is how we closed 04/19/2022:
Domestic TTI: +1.78% above its M/A (prior close +0.01%)—Sell signal effective 02/24/2022.
International TTI: -0.72% below its M/A (prior close -1.14%)—Sell signal effective 03/08/2022.
Disclosure: I am obliged to inform you that I, as well as my advisory clients, own some of the ETFs listed in the above table. Furthermore, they do not represent a specific investment recommendation for you, they merely show which ETFs from the universe I track are falling within the specified guidelines.
All linked charts above are courtesy of Bloomberg via ZeroHedge.
Contact Ulli