ETF Tracker Newsletter For April 29, 2022

Ulli ETF Tracker Contact

ETF Tracker StatSheet          

You can view the latest version here.

RED APRIL
[Chart courtesy of MarketWatch.com]

  1. Moving the markets

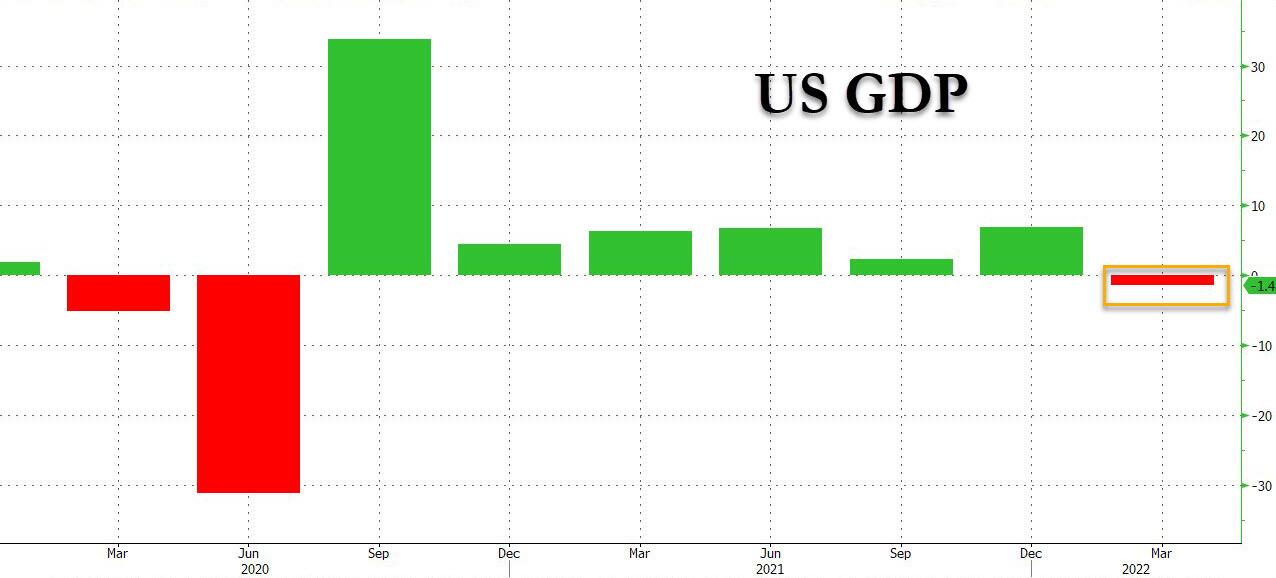
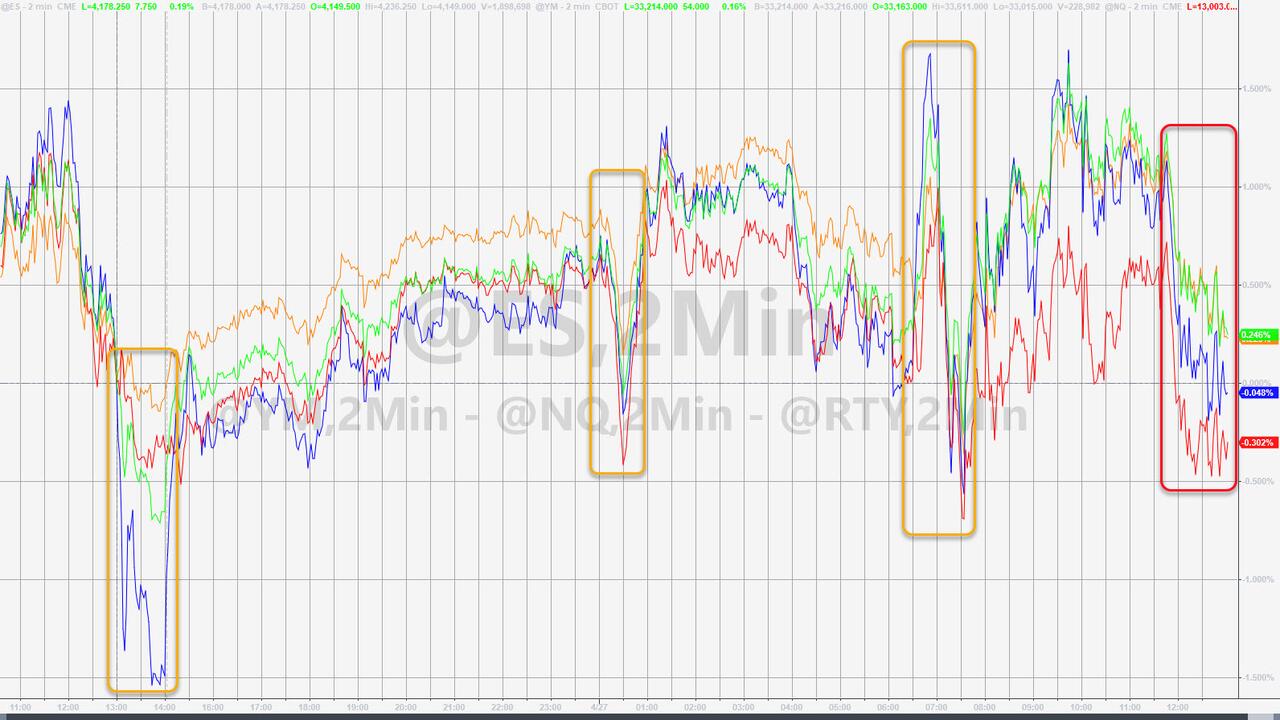
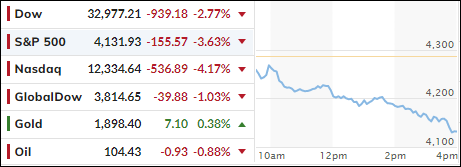
Despite the shocking negative first quarter GDP reading of -1.4% (annually), the markets managed to string together a MegaLiftathon on Thursday, but today’s reality check pulled the indexes back down below where they started yesterday. So much for buying the dips.

More than yesterday’s gains were given back today, and we’re now staring into the abyss of a bear market for domestic equities, the signal of which was initially generated by our Domestic Trend Tracking Index (TTI) back on 2/24/22. We’ve seen a lot of bounce backs since but, as of this moment, the bears are clearly having the upper hand.

After yesterday’s close, tech powerhouse Amazon shocked the investing community via a dismal outlook and a rise in operating costs, which pulled its stock down some -12%, a performance that was outdone today, as the company stock dropped another -14%. Ouch!

How bad was this month? MarketWatch summed it up like this:

The Nasdaq is down around 12%, on pace for its worst monthly performance since October 2008 in the throngs of the financial crisis. The S&P 500 is down more than 7%, its worst month since March 2020 at the onset of the Covid pandemic. The Dow is off by nearly 4% for the month.

The Nasdaq Composite sits in bear market territory, roughly 24% below its intraday high. The S&P 500 is off its record by more than 14% and the Dow is nearly 11% lower.

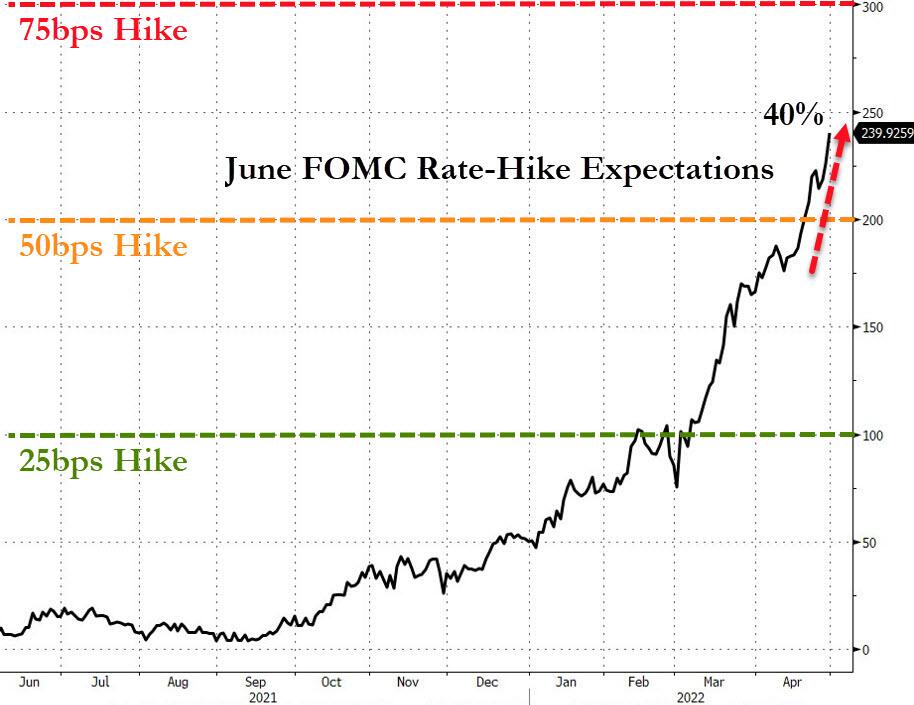
Rate hike expectations went vertical, with ZH pointing out that a 50-bps hike next week appears to be a done deal with odds of a potential 75-bps hike now being 50%. If that materializes, it would be the first 75-bps hike since 1994.

Hmm, I wonder if the markets are prepared for that?

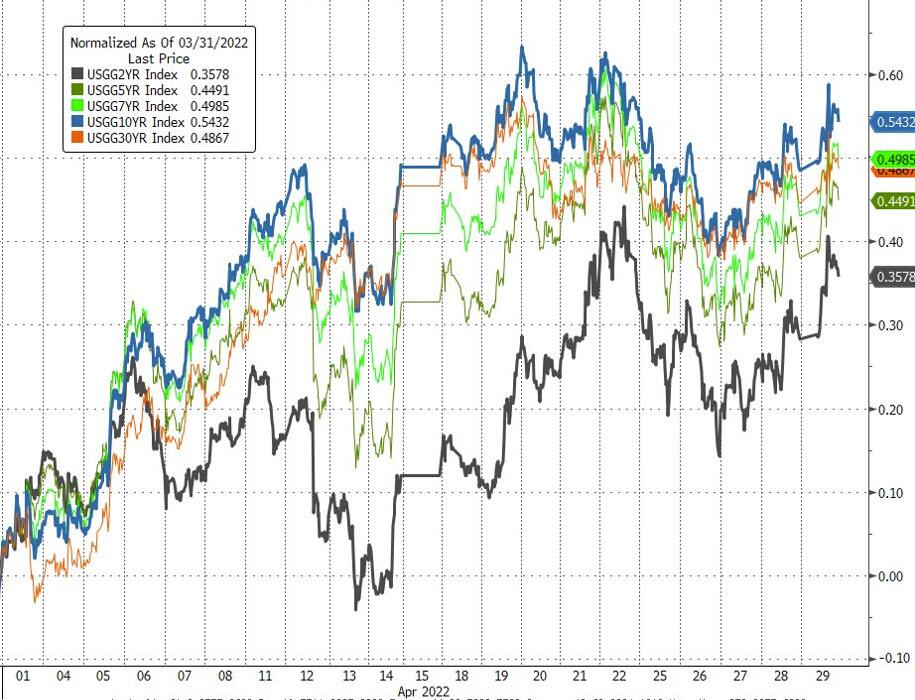
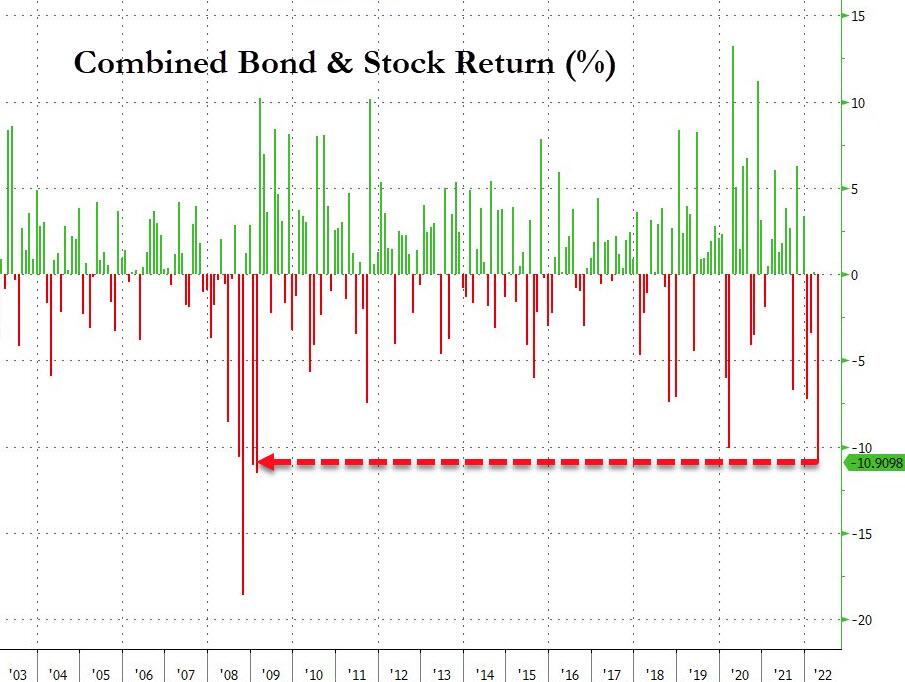
Bonds got clobbered during April as well with yields spiking across the board, as the widely-held 20-year bond ETF TLT lost -7.43%, which pretty much matched the S&P 500 “performance.” So much for the perceived security of bonds during a stock market meltdown. As a result, April turned out to be the worst month for a stock/bond portfolio since February 2009.

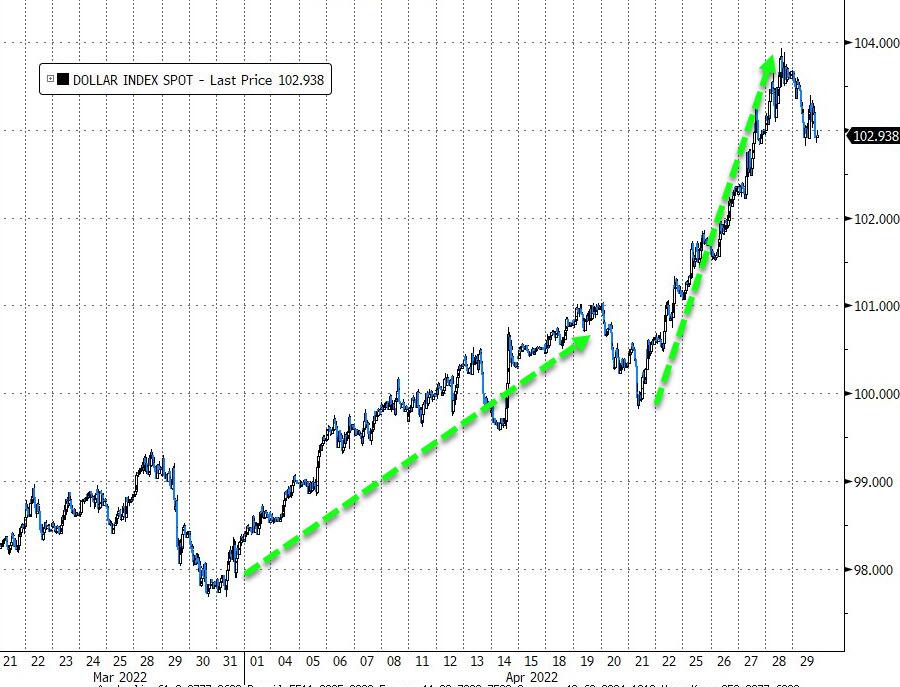
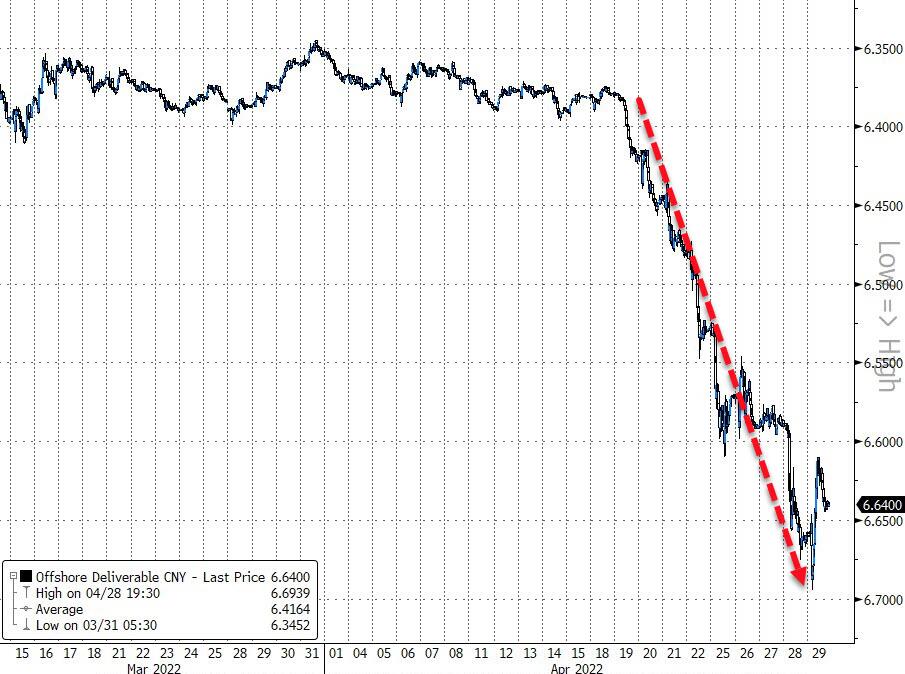
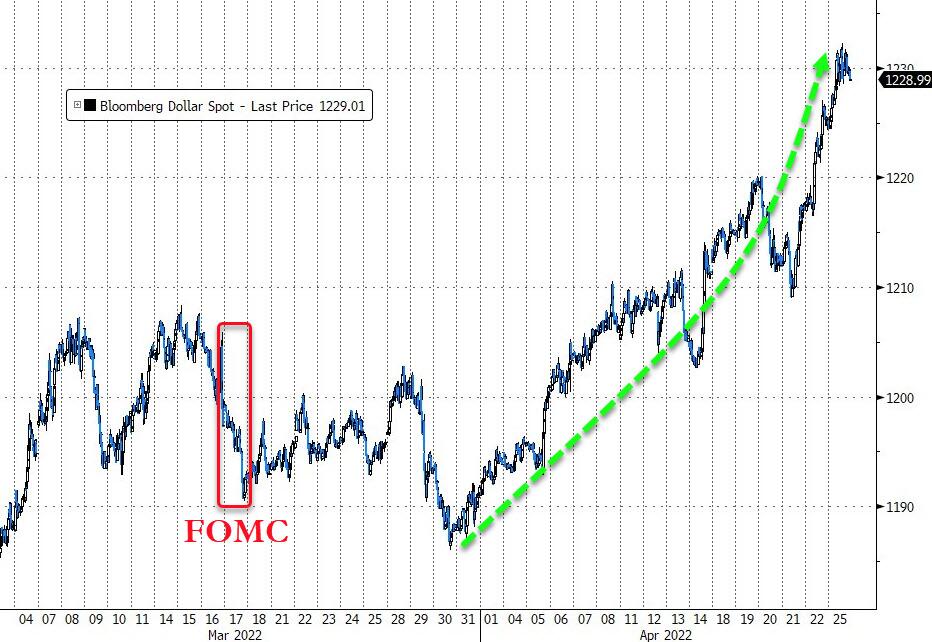
The beneficiary of all this turmoil was the US Dollar when measured vs. its fiat peers, as it jumped 5% and traded at its highest in 20 years, as ZH remarked. The same can’t be said for the Chinese Yuan, which saw its biggest monthly drop against the dollar since 1994.

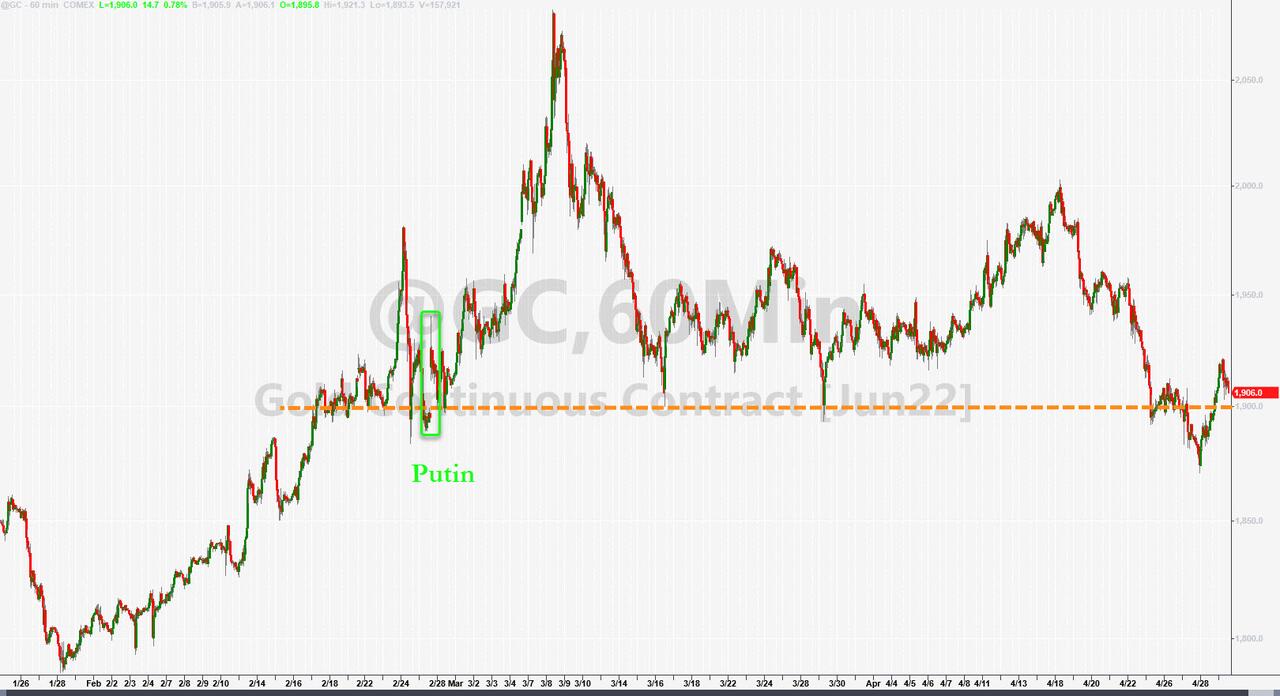
Gold was pretty much flat, which is better than down, and it ended the month just around its $1,900 level.

All this leaves me pondering: “Will Fed head Powell step up to “save” the markets again, or will he seriously fight potential hyper-inflation and save humanity?”

Read More
Weekly StatSheet For The ETF Tracker Newsletter – Updated Through 04/28/2022

Ulli ETF StatSheet Contact

ETF Data updated through Thursday, April 28, 2022

Methodology/Use of this StatSheet:

1. From the universe of over 1,800 ETFs, I have selected only those with a trading volume of over $5 million per day (HV ETFs), so that liquidity and a small bid/ask spread are assured.

2. Trend Tracking Indexes (TTIs)

Buy or Sell decisions for Domestic and International ETFs (section 1 and 2), are made based on the respective TTI and its position either above or below its long-term M/A (Moving Average). A crossing of the trend line from below accompanied by some staying power above constitutes a “Buy” signal. Conversely, a clear break below the line constitutes a “Sell” signal. Additionally, I use an 12% trailing stop loss on all positions in these categories to control downside risk.

3. All other investment arenas do not have a TTI and should be traded based on the position of the individual ETF relative to its own respective trend line (%M/A). That’s why those signals are referred to as a “Selective Buy.” In other words, if an ETF crosses its own trendline to the upside, a “Buy” signal is generated. Here too, I recommend trailing sell stop of 12%, or less, depending on your risk tolerance.

If you are unfamiliar with some of the terminology, please see Glossary of Terms and new subscriber information in section 9.     

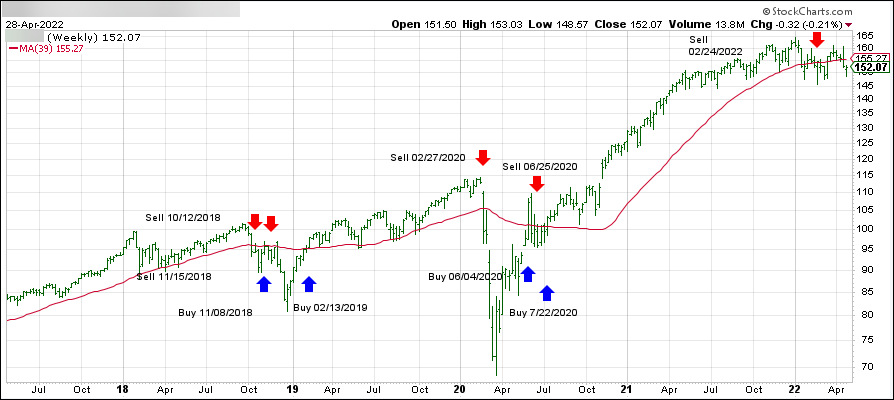
1. DOMESTIC EQUITY ETFs: SELL — since 02/24/2022

Click on chart to enlarge

Our main directional indicator, the Domestic Trend Tracking Index (TTI-green line in the above chart) has only broken below its long-term trend line (red) by -2.05% and remains in “SELL” mode—although it is on the edge of moving back to the Buy side.  

Read More

A Dead-Cat Bounce Loses Its Bounce—Twice

Ulli Market Commentary Contact

[Chart courtesy of MarketWatch.com]

  1. Moving the markets

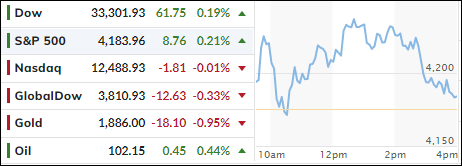
Despite dip buyers stepping in this morning, to take advantage of lower prices caused by yesterday’s drubbing, the effort peaked mid-day, after which the selling resumed with the major indexes ending up only a tad above their respective unchanged lines.

The Nasdaq has now dropped some 12% in April, which is its worst performance since October 2008, with the S&P 500 and Dow being down as well but to a lesser magnitude.

Headwinds increased for equities this month, as uncertainty reigned due a variety of uncontrollable events—like inflation, Fed tightening, the war in Ukraine, and China’s zero-covid policy lockdowns—combining forces and giving the bears the upper hand.

Since my Domestic Trend Tracking Index (TTI) signaled a sell of domestic equities on 2/24/22, we’ve seen strong rebounds at first, however, they have lately turned into a bearish rut. As of today, our TTI hovers -3.72% below its long-term trend line (section 3).

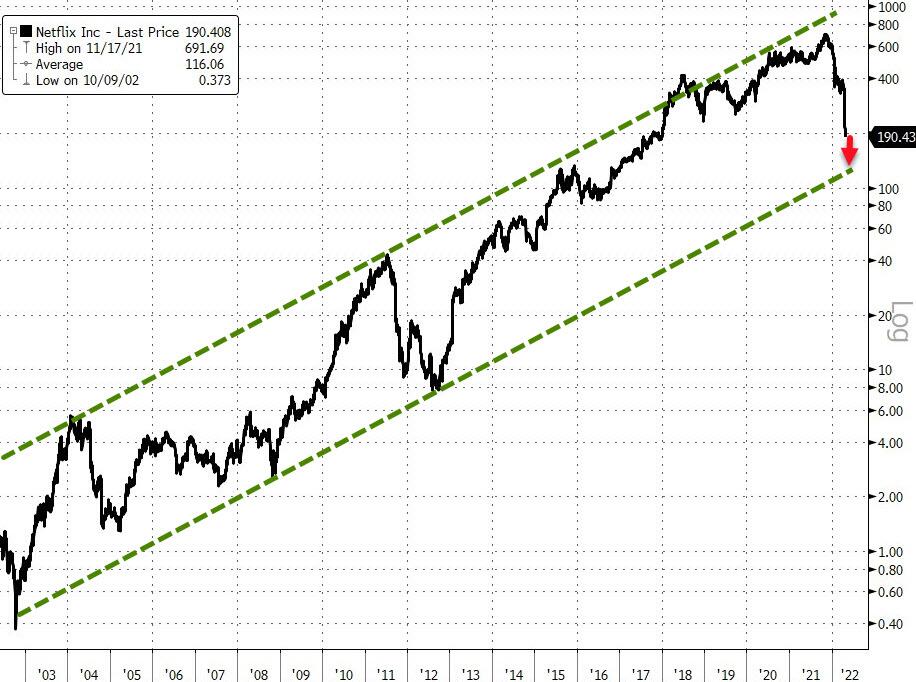
As ZH pointed out, the FANG stocks puked again and have now reached a critical support level from right before the Covid crash, while Netflix still has a long ways to go to find any technical support at all.

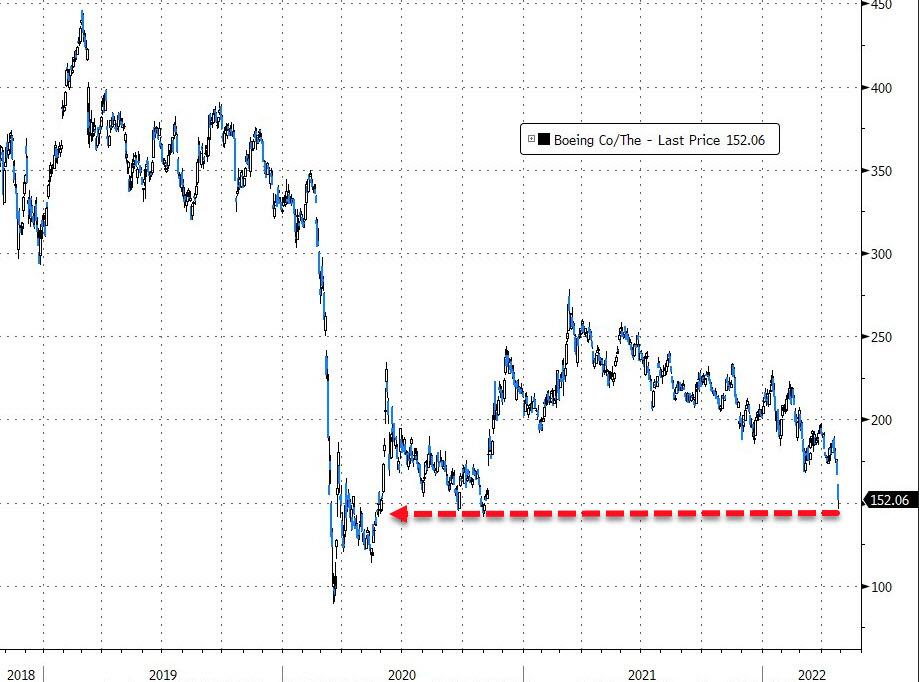
Boeing got hammered as well and has now reached a price level last seen in June 2020. Bond yields, which had weakened yesterday, came back and stormed higher with the 10-year gaining over 10 bps to close at 2.835%.

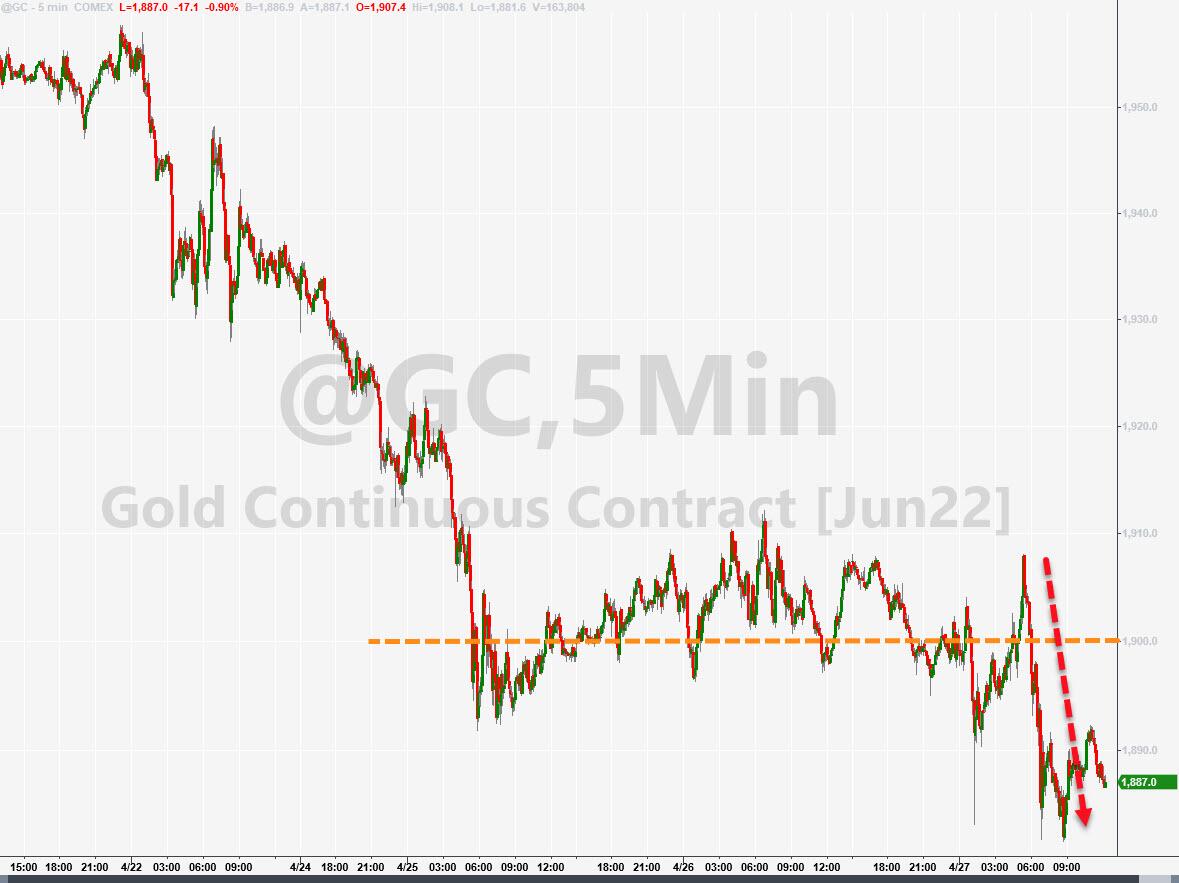
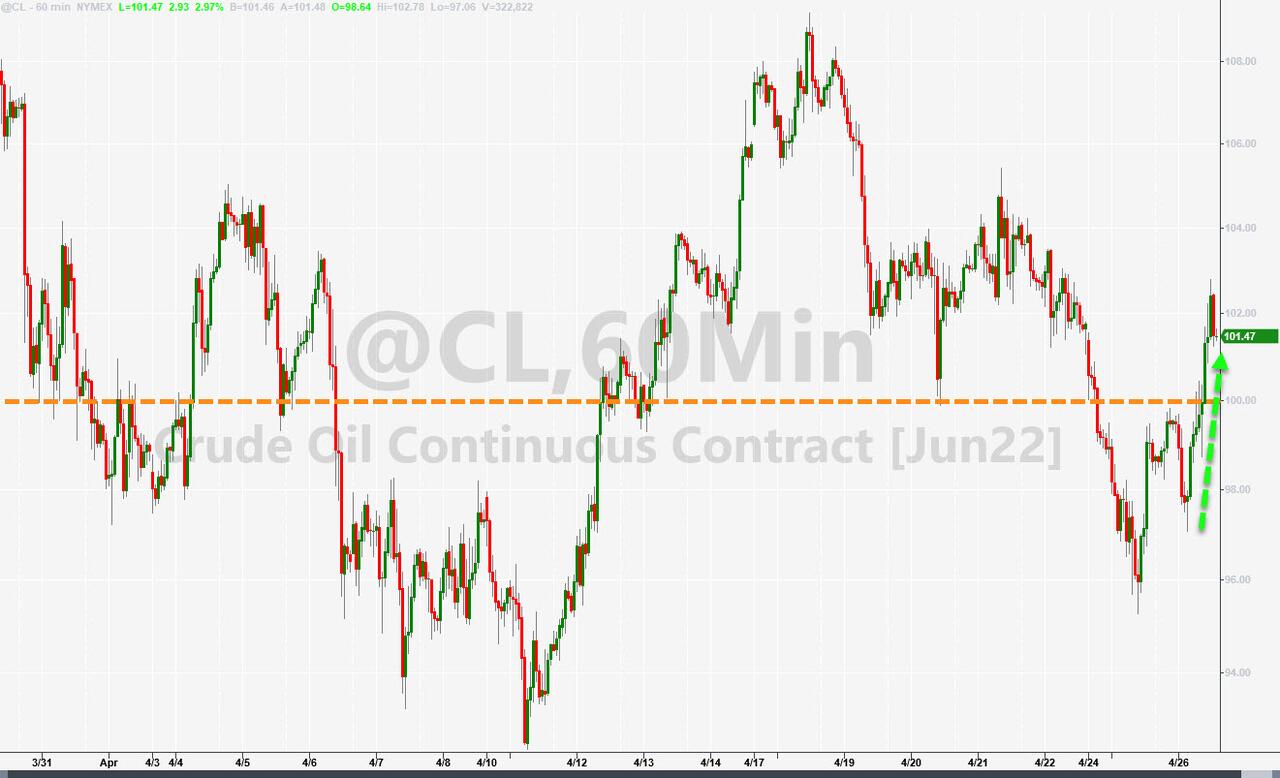
The energy and commodity sectors rose, while Gold dropped and lost its $1,900 level again.

Read More

The Puke-A-Thon Continues

Ulli Market Commentary Contact

[Chart courtesy of MarketWatch.com]

  1. Moving the markets

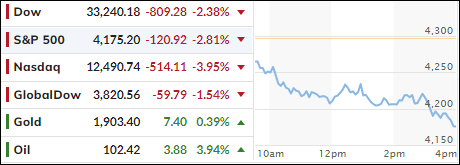
The Nasdaq sustained its recent weakness and plunged some 4% in part due to increasing anxiety ahead of the quarterly earnings reports from the big players like Microsoft and Alphabet (Google) due out this afternoon. The recent Netflix blow-up is still on every trader’s mind.

However, today’s weakness was also assisted by the usual fears, namely the global economy as whole, the Covid surge in China, the war in Ukraine, increasing inflation numbers in the U.S., and the seemingly never-ending supply chain issues.

So far, April has not been kind to domestic equities with the S&P 500 having lost -7.8%, the Nasdaq being down -12.2%, while the Dow fared the best with only a -4.2% drop. This pretty much confirms the bearish position of my Domestic TTI (since 2/24/22), now below its trend line by -3.90%, to either be totally out of domestic equities or only have limited exposure.

And if you thought bonds would have helped to offset some these losses, you would have been wrong, because the widely held 20-year T-Bond ETF TLT lost -7.3% month to date. Ouch! As I posted before, in this high interest rate environment, bonds are no longer a “safe” haven.

In the end, there were not many places to hide. Energy bounced back nicely but ended the session unchanged. Commodities showed signs of life with DBC adding +1.37%, and gold managed to rebound but only by a meager +0.45%.

When the entire equity spectrum is down considerably, owning some sector ETFs with small gains will substantially mitigate the negative effects of the domestic equity arena.

Read More

Fighting Back…And Succeeding

Ulli Market Commentary Contact

[Chart courtesy of MarketWatch.com]

  1. Moving the markets

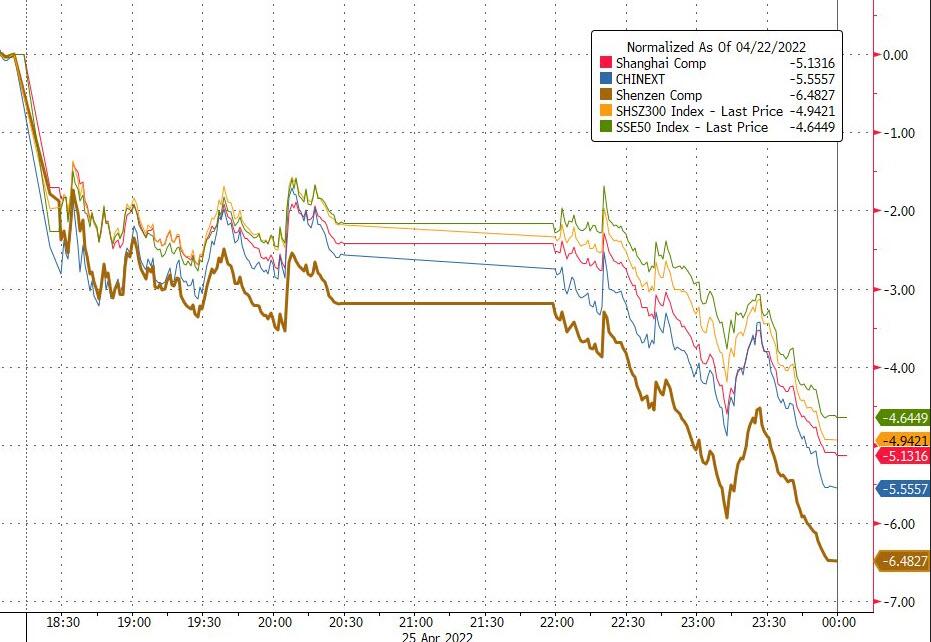
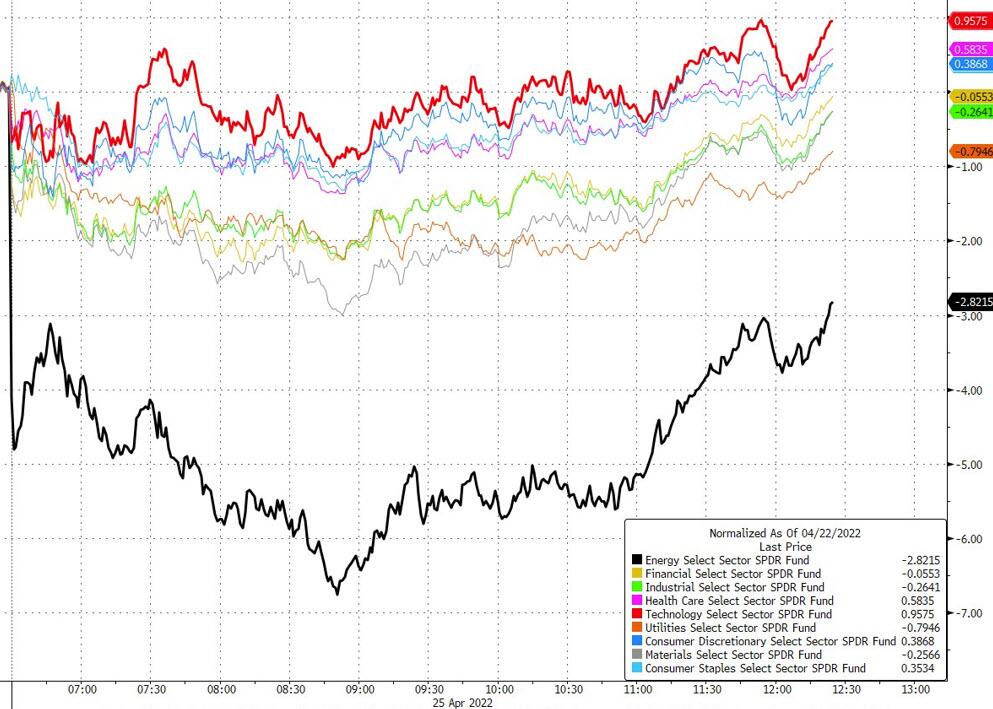
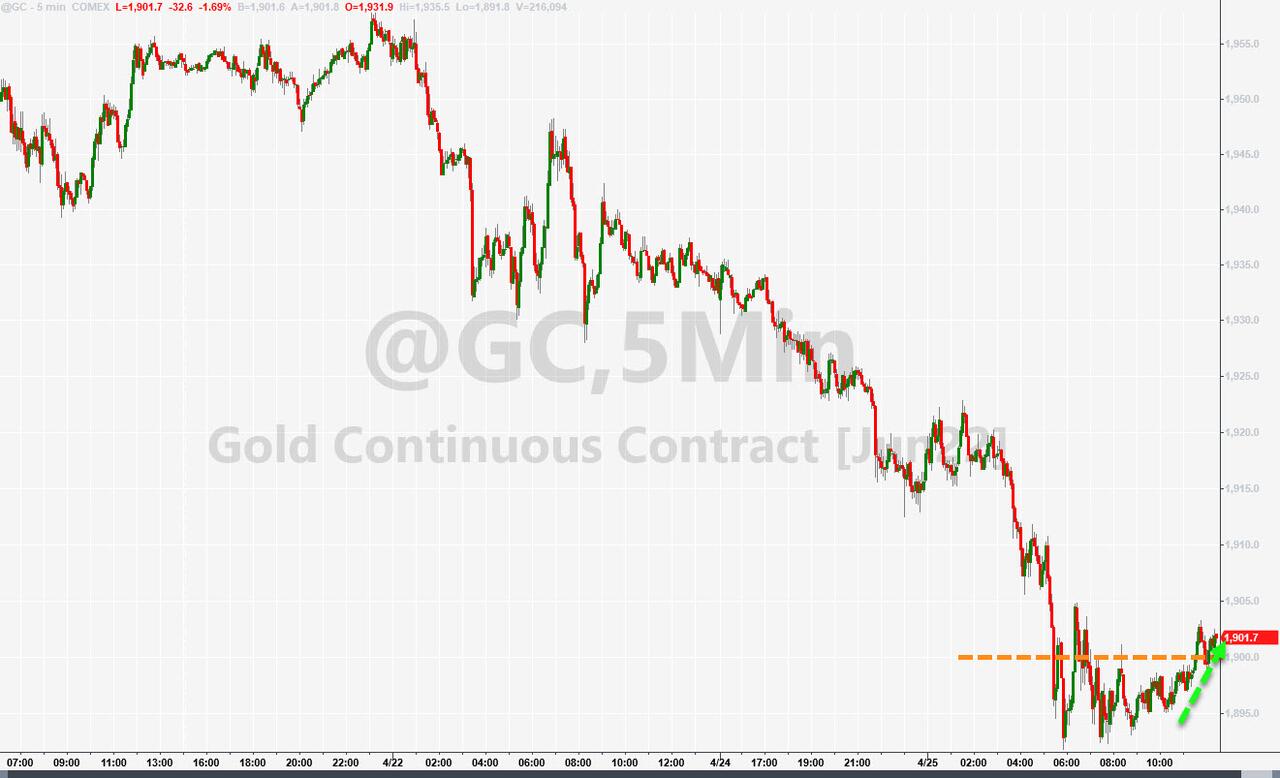
Another early sell off pulled the Dow down by some 400 points, as a one-two punch hit the US markets. Global fears about an economic slowdown loomed large, leading to a slump in Chinese stocks, which pulled energy, commodities, and precious metals off their recent highs—along with all US equities.

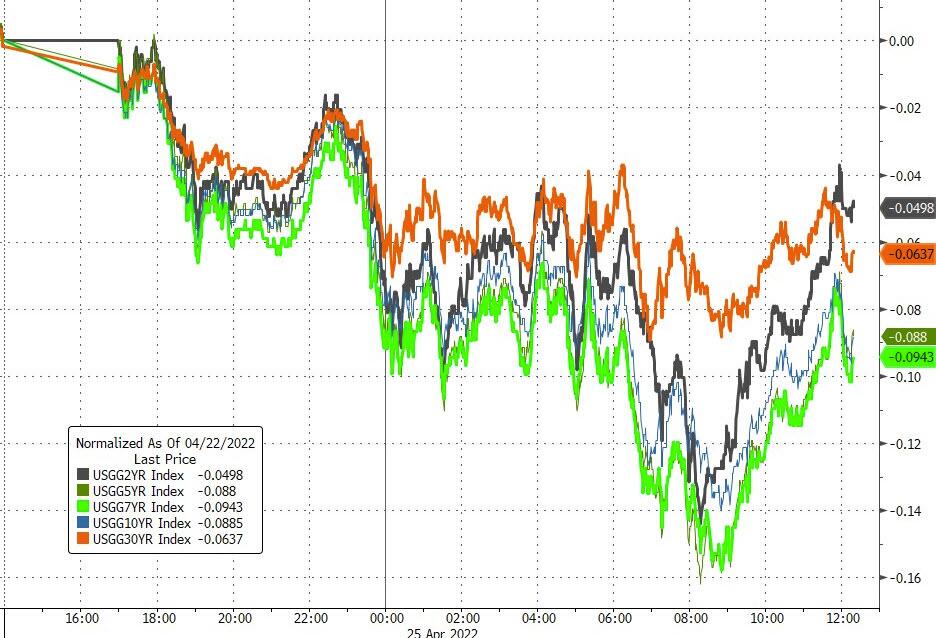
As a result, bond yields cratered for the first time in a while with the widely followed 10-year dropping 7 basis points to close at 2.827%. Uneasiness about this week being a big one for corporate earnings did not help, with about 160 S&P 500 companies scheduled to report and half of the Dow Jones. All eyes are on the big boys like Amazon, Apple, Microsoft, and Alphabet (Google).

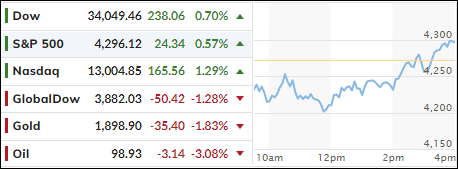
Despite the early dump, the markets found some footing and the subsequent reversal sent the Dow up over 200 points into the close. The lead dog was the Nasdaq with a 1.29% gain, which could be just a temporary bounce of hope, as the index has come off its highs by some 20%.

The loser of the day award goes to SmallCaps, which have dropped to their lowest since December 2020 and are currently down 22% from their highs, as ZH pointed out.

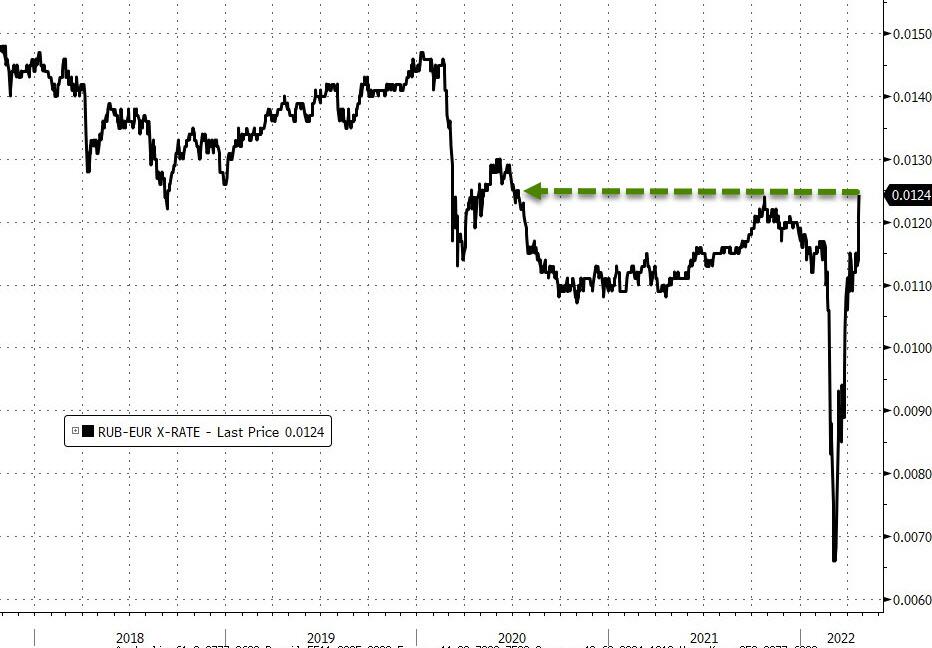
The US Dollar continued its trajectory to higher prices, the Chinese Yuan went the other way, and the Russian Ruble soared to its strongest relative to the Euro in 2 years.  

On deck later this week are the latest CPI numbers from countries around the world, which will have an impact on bond yields and equities.  

Read More

ETFs On The Cutline – Updated Through 04/22/2022

Ulli ETFs on the Cutline Contact

Below, please find the latest High-Volume ETF Cutline report, which shows how far above or below their respective long-term trend lines (39-week SMA) my currently tracked ETFs are positioned.

This report covers the HV ETF Master List from Thursday’s StatSheet and includes 312 High Volume ETFs, defined as those with an average daily volume of more than $5 million, of which currently 80 (last week 106) are hovering in bullish territory. The yellow line separates those ETFs that are positioned above their trend line (%M/A) from those that have dropped below it.

Take a look:                                                                   

The HV ETF Master Cutline Report

In case you are not familiar with some of the terminology used in the reports, please read the Glossary of Terms. If you missed the original post about the Cutline approach, you can read it here.