Sliding Into The Easter Weekend

Ulli Market Commentary Contact

[Chart courtesy of MarketWatch.com]

  1. Moving the markets

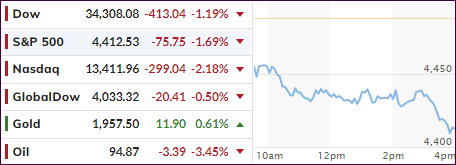
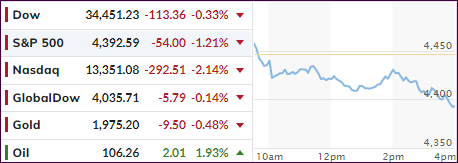
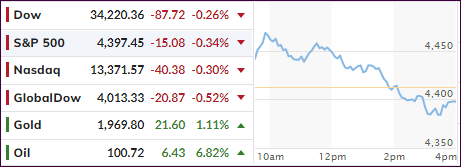
Another early rally bit the dust with the major indexes surrendering morning gains and the S&P 500 and Nasdaq also giving back yesterday’s advances.

Added CNBC:

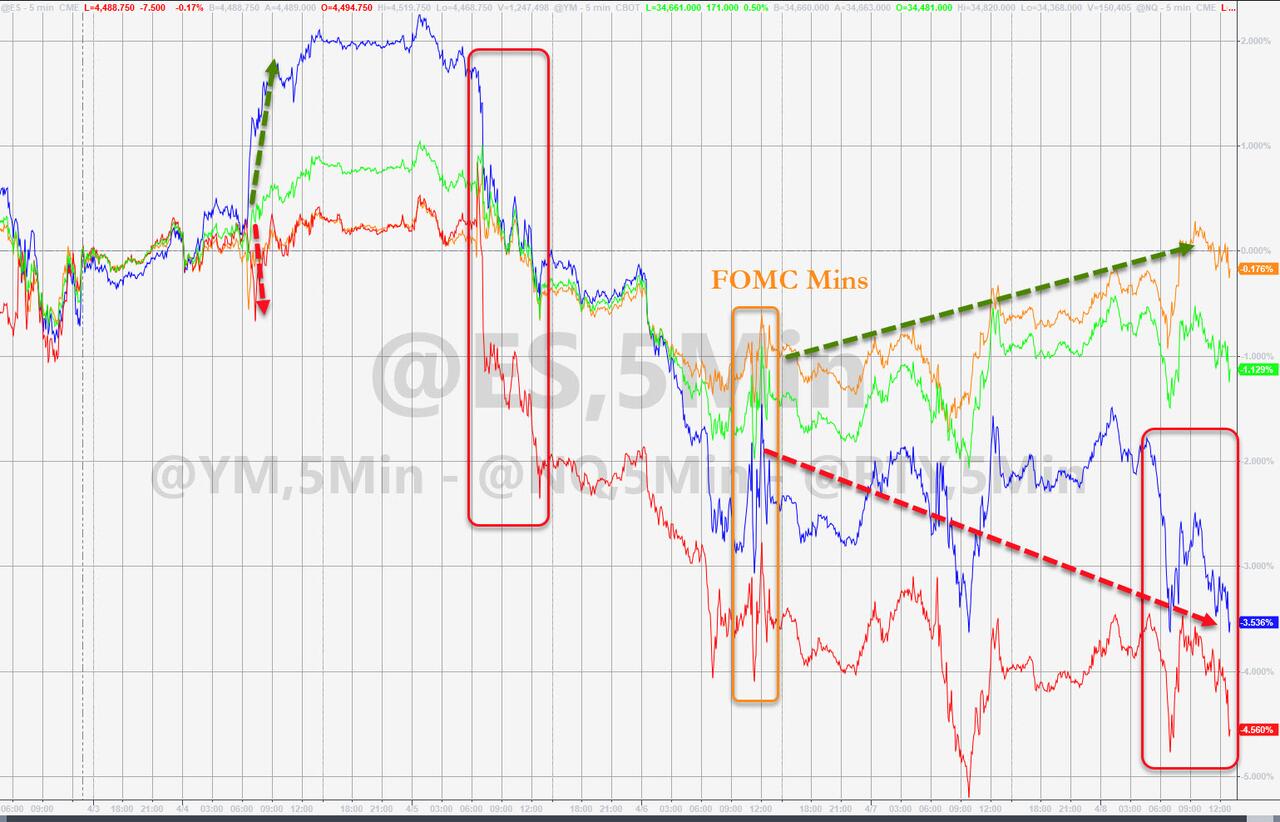
The S&P 500 is down 2% for the week on inflation fears as a Tuesday CPI report showed price increases not seen since 1981. The Nasdaq Composite is off 3.7% and the Dow is flat for the week.

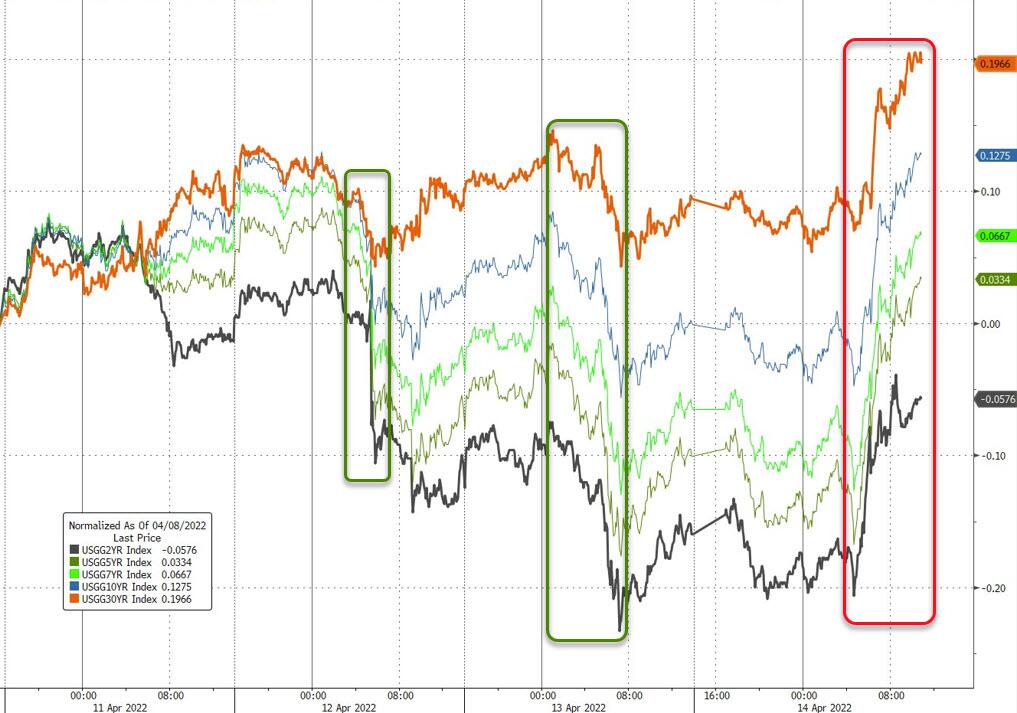
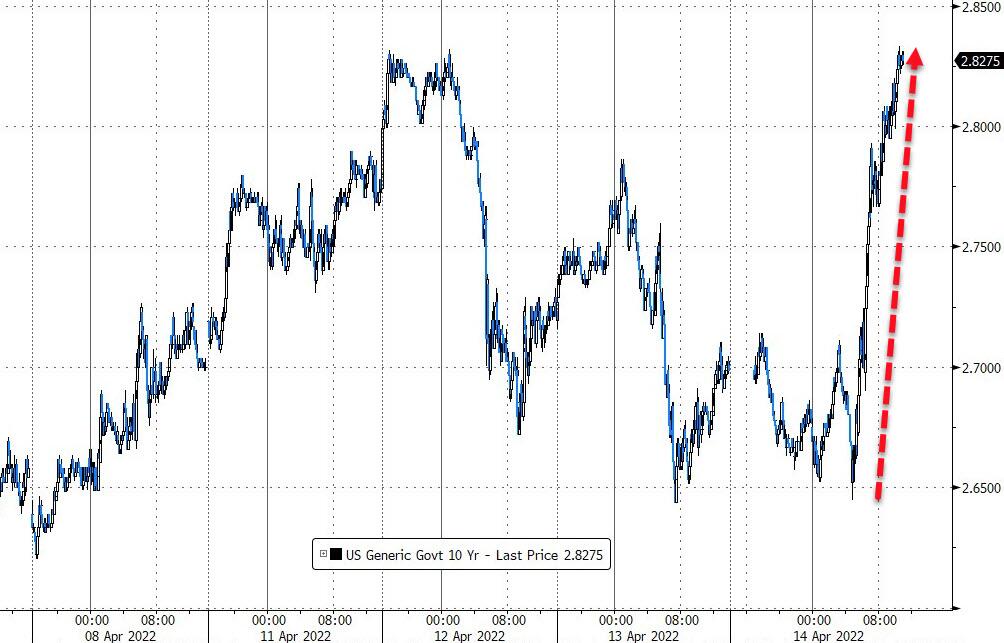
Spiking bond yields pulled the rug out from under equities, with the 10-year adding 13 basis points to push the rate to 2.83%, a multi-year high, as inflation exacted its pound of flesh—again. The widely held 20-year bond ETF TLT got spanked again and lost 2% on the day bringing its YTD losses to -18.51%. Ouch!

As much as traders would have liked to push the 8.5% CPI and 11.2% PPI numbers on the back burner, the reality of a variety of bearish data points set in, as well as speculation on how the Fed will now respond, and south we went.  

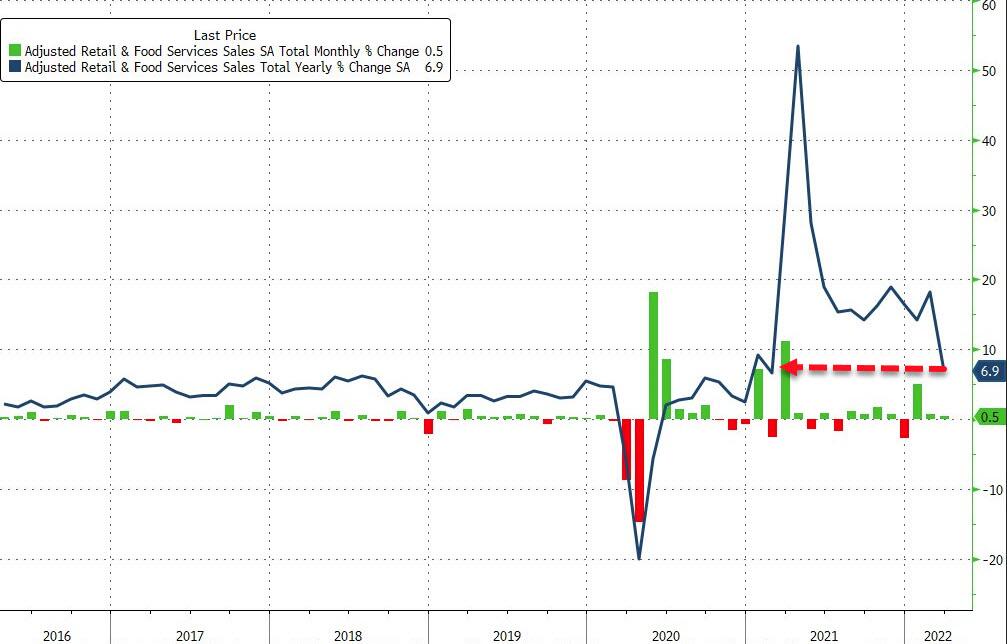
Not helping the bulls was the release of US Retail Sales Growth, which was the slowest in 13 months with online spending plunging, as ZH pointed out.

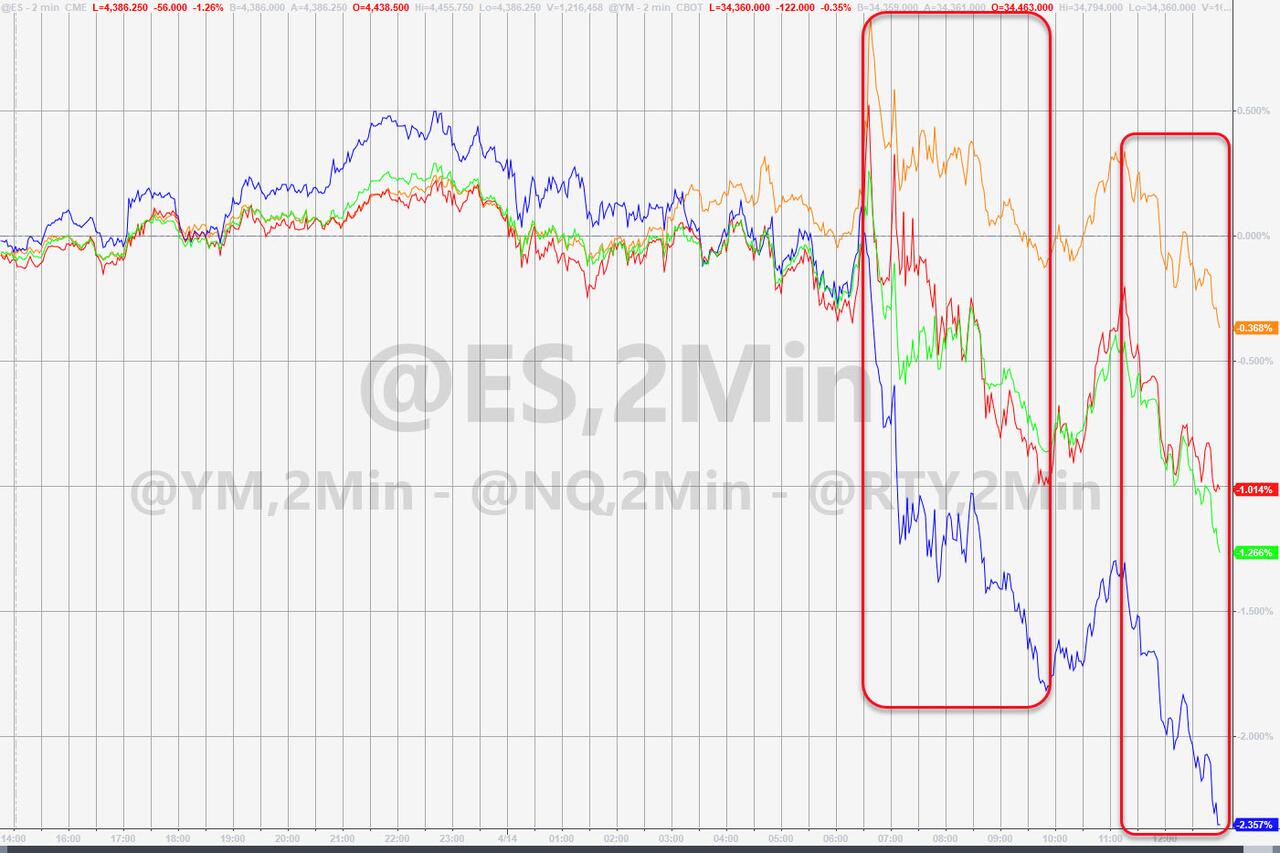
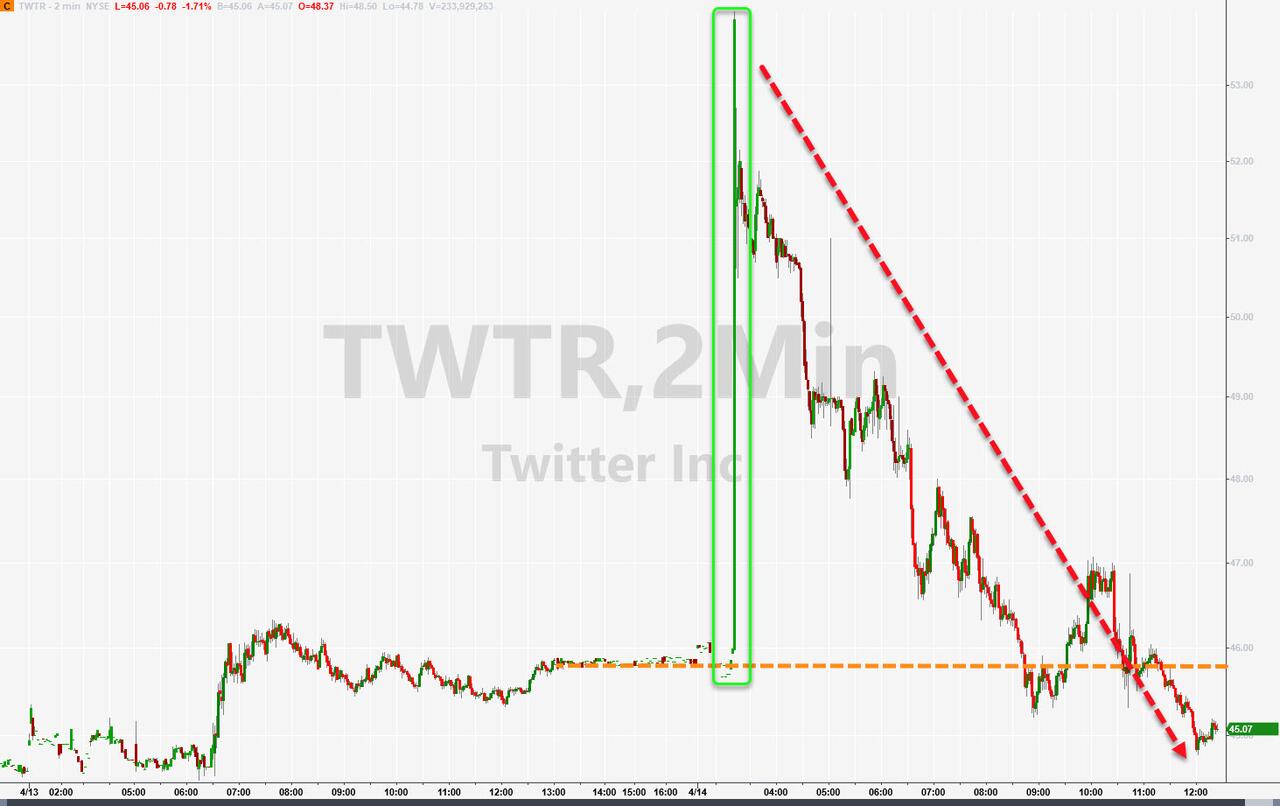
Twitter was headline news, as Elon Musk offered to buy the company, but rumors played havoc with the price, as this chart shows, while $2.1 trillion in options expirations did their number on market volatility.

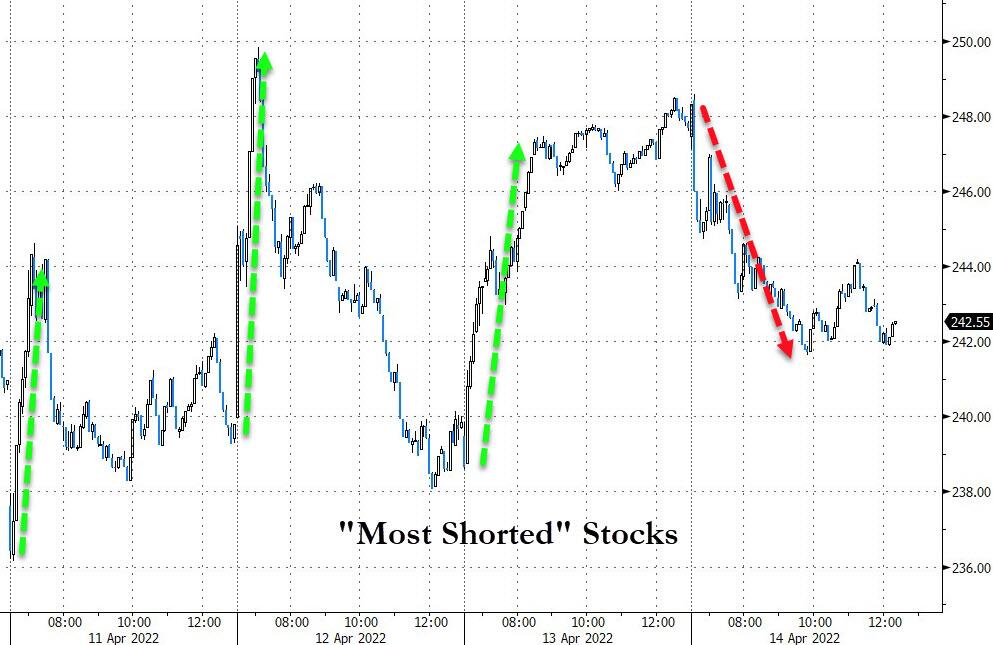
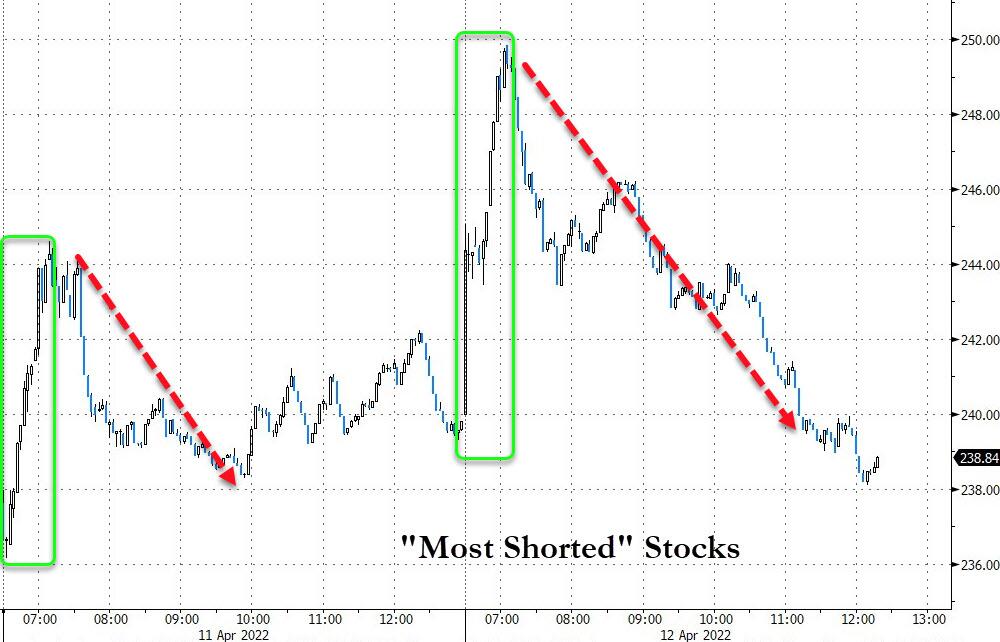
Another roller coaster ride occurred in the ever-ongoing battle between “value” and “growth,”  as well as in the “most shorted stocks” arena, but it the end, it turned out to be a losing week.

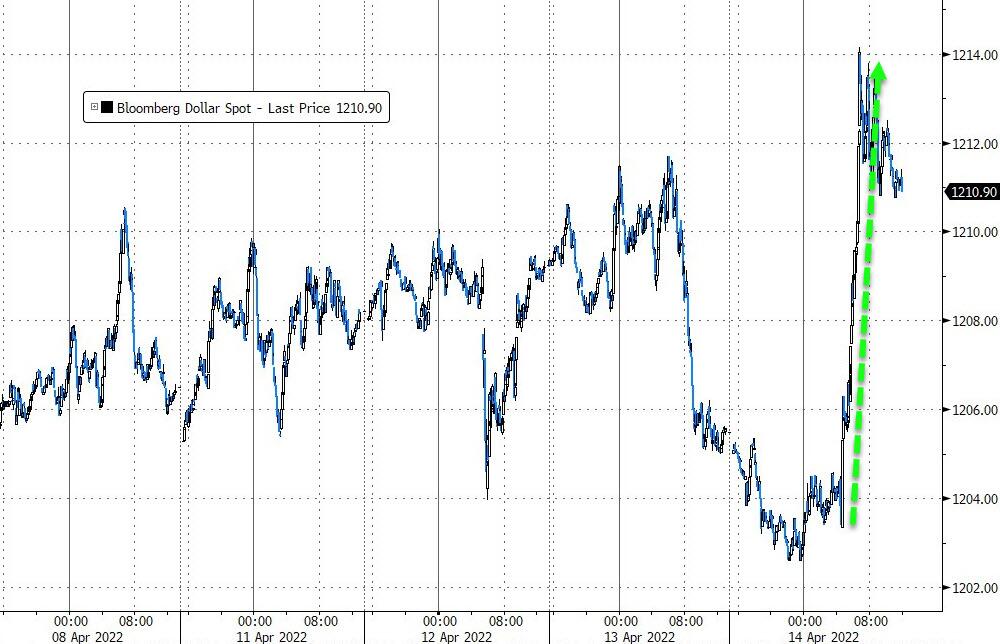
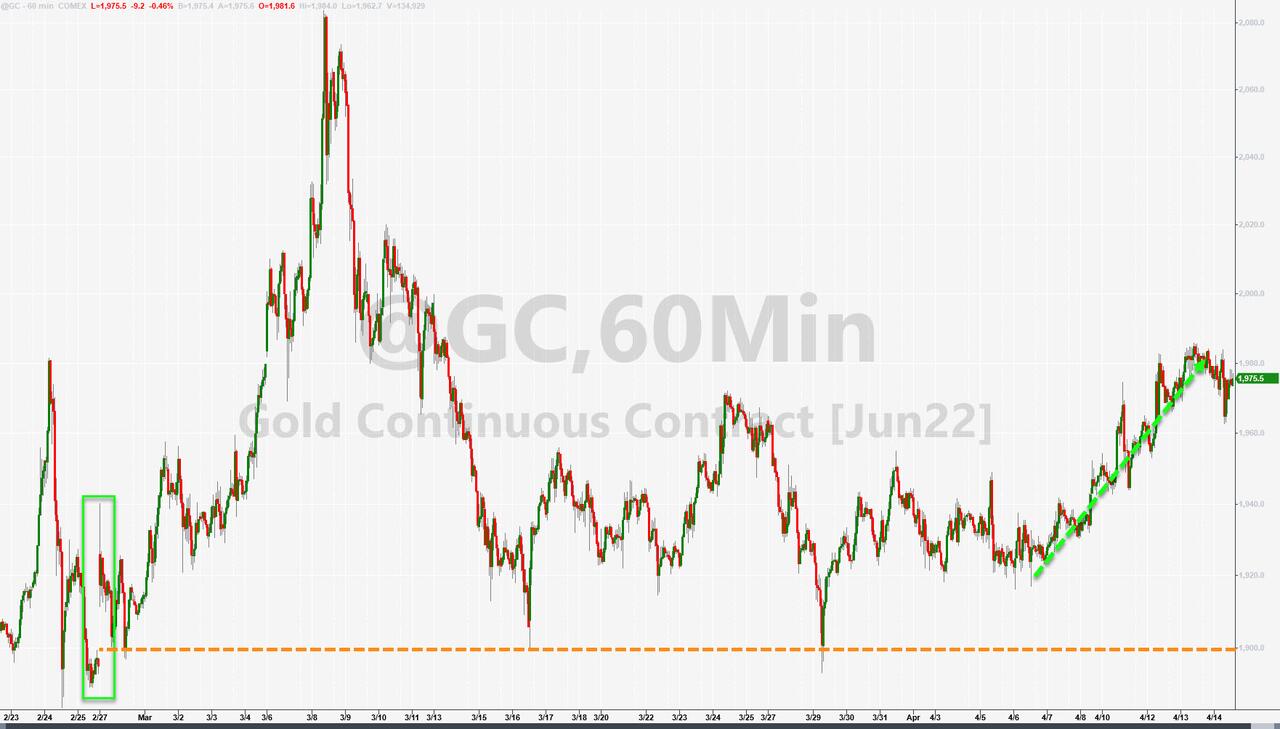
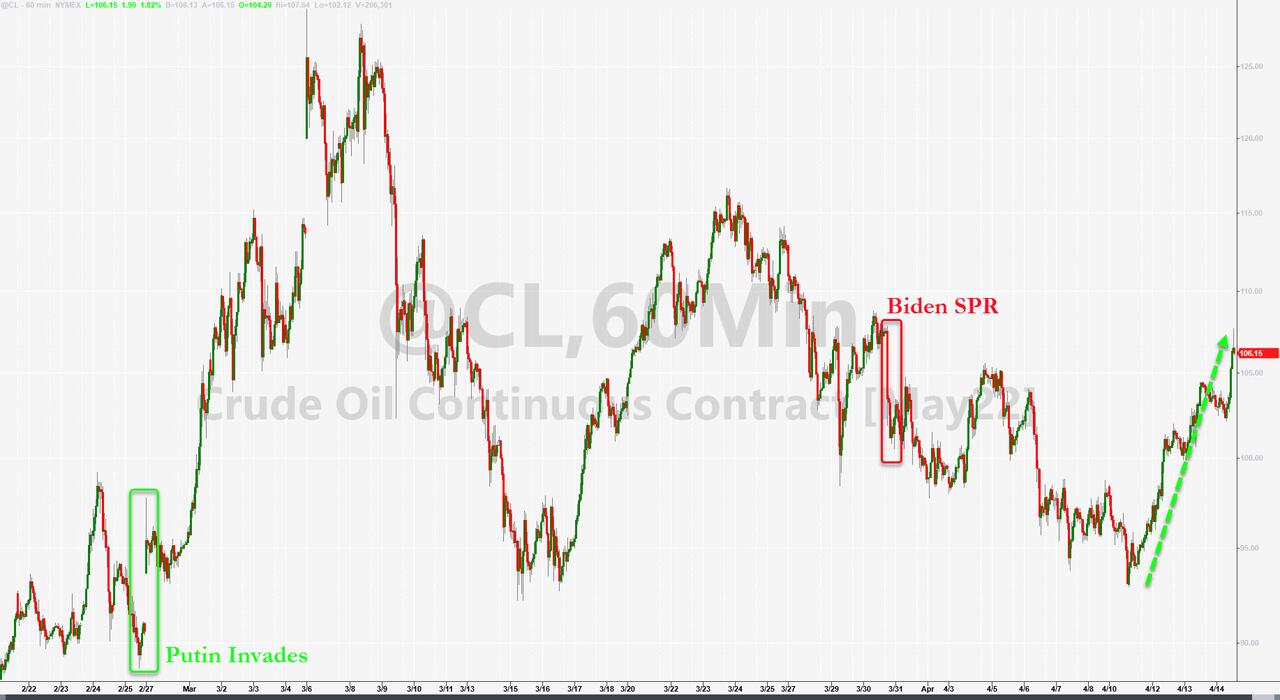
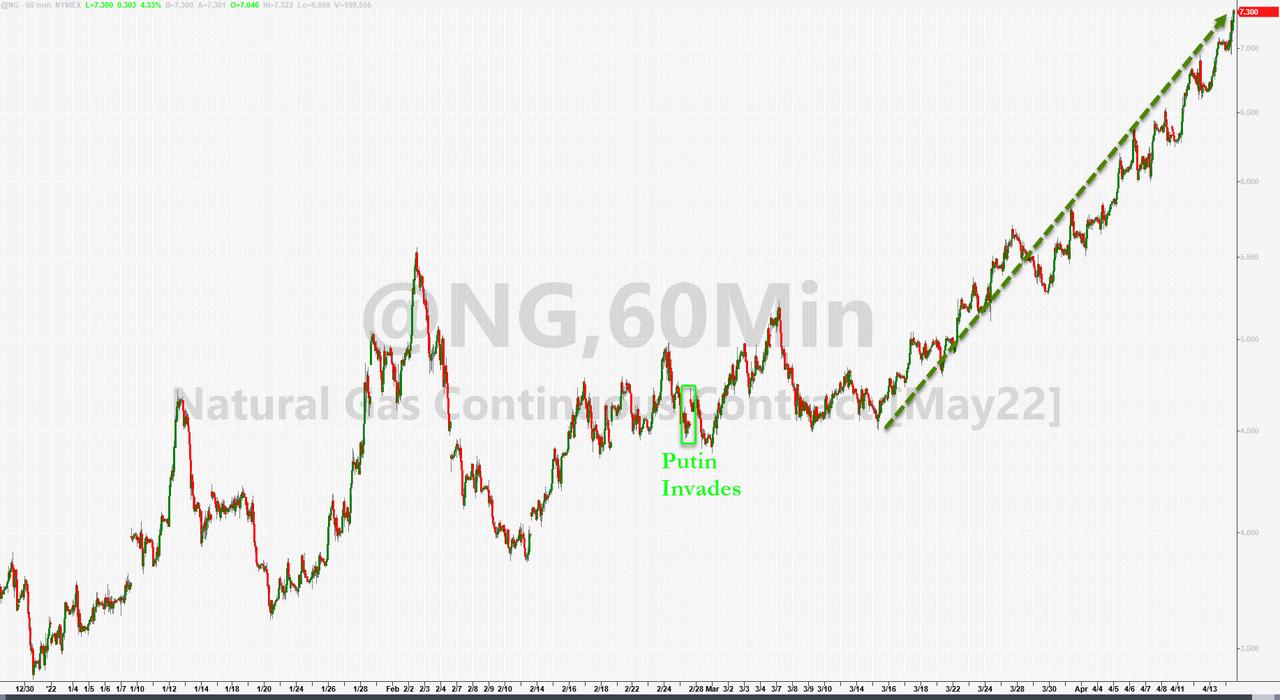
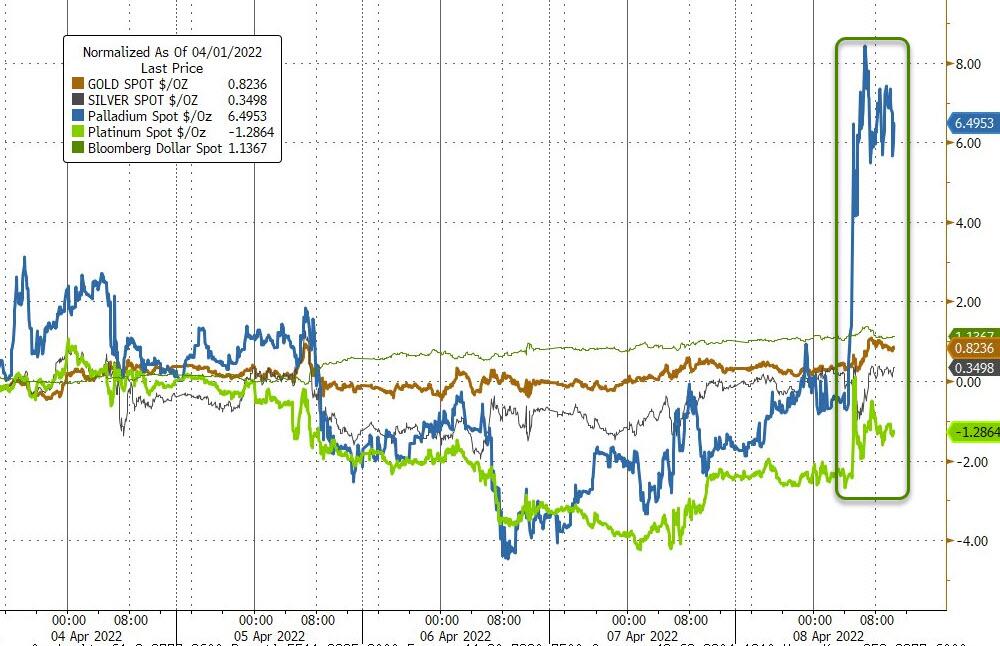
As yields rose, the US Dollar stormed higher and pulled gold slightly lower. The energy complex gained for the week, with oil prices surging, including Natural Gas, which almost went vertical.  

I hope you will enjoy a calm Easter weekend, because the markets will be anything but calm, when trading resumes next Monday.   

Read More
Positive Earnings Win Tug-Of-War With Surging Inflation

Ulli Market Commentary Contact

[Chart courtesy of MarketWatch.com]

  1. Moving the markets

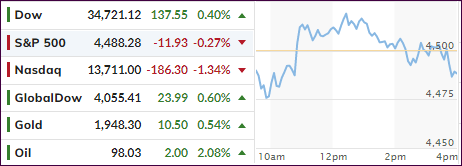
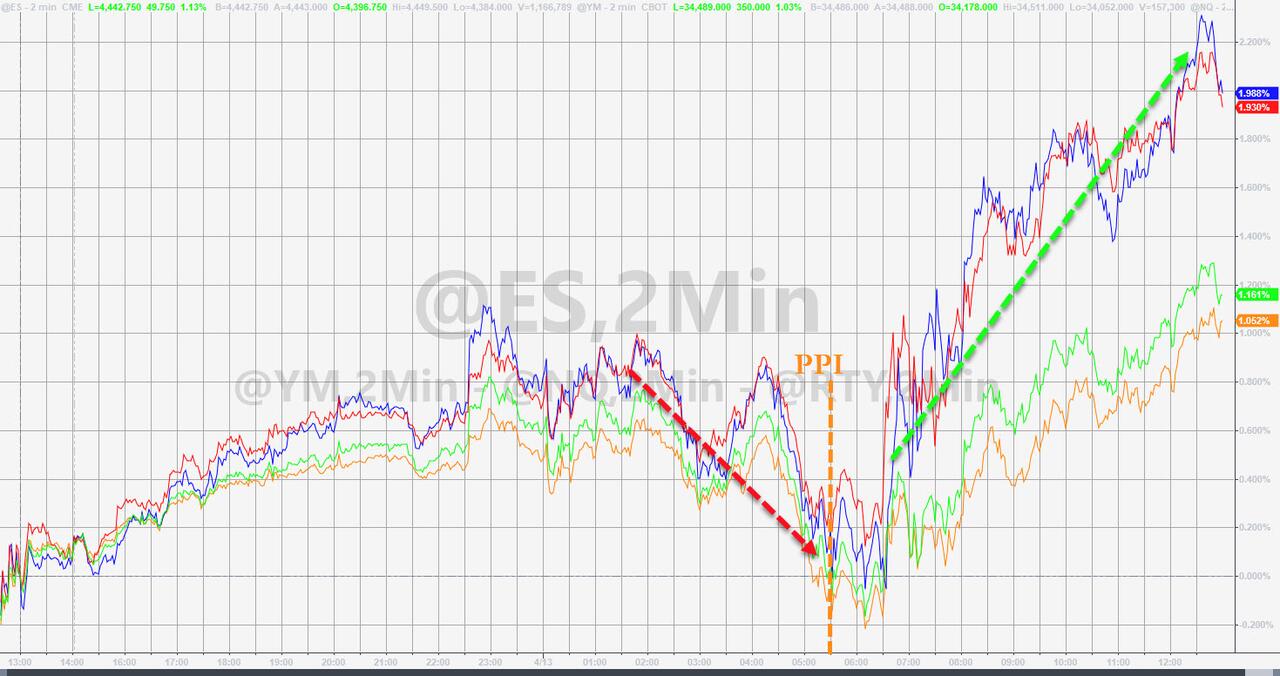
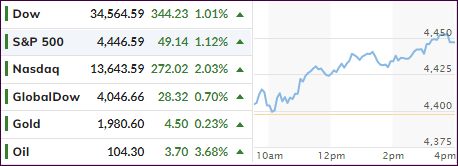
After three consecutive losing sessions, the major indexes managed to score a win, despite another horrific inflation number, which traders simply overlooked. Some corporate earnings came in better than expected (BlackRock, Fastenal, Delta) with the latter one announcing the return to profitability this quarter.

Other airlines, hotel, and travel stocks joined the rebound, which was led by the Nasdaq with a 2% gain.  

The much-awaited Producer Price Index (PPI) jumped a mind-boggling 11.2% YoY in March, while the MoM gain came in at 1.4%, far higher than the expected 1.1%. This follows yesterday’s CPI number, which surged 8.5% YoY in March.

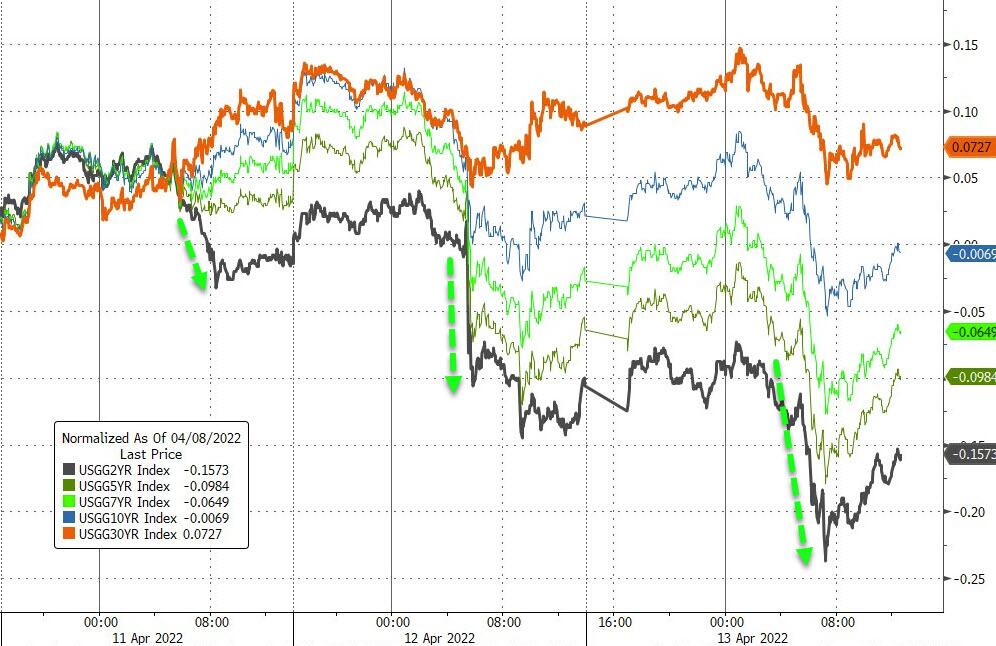
As strange as it may sound, but in the face of the above numbers, bond yields pulled back with the 10-year settling at 2.697%, down 8 basis points.

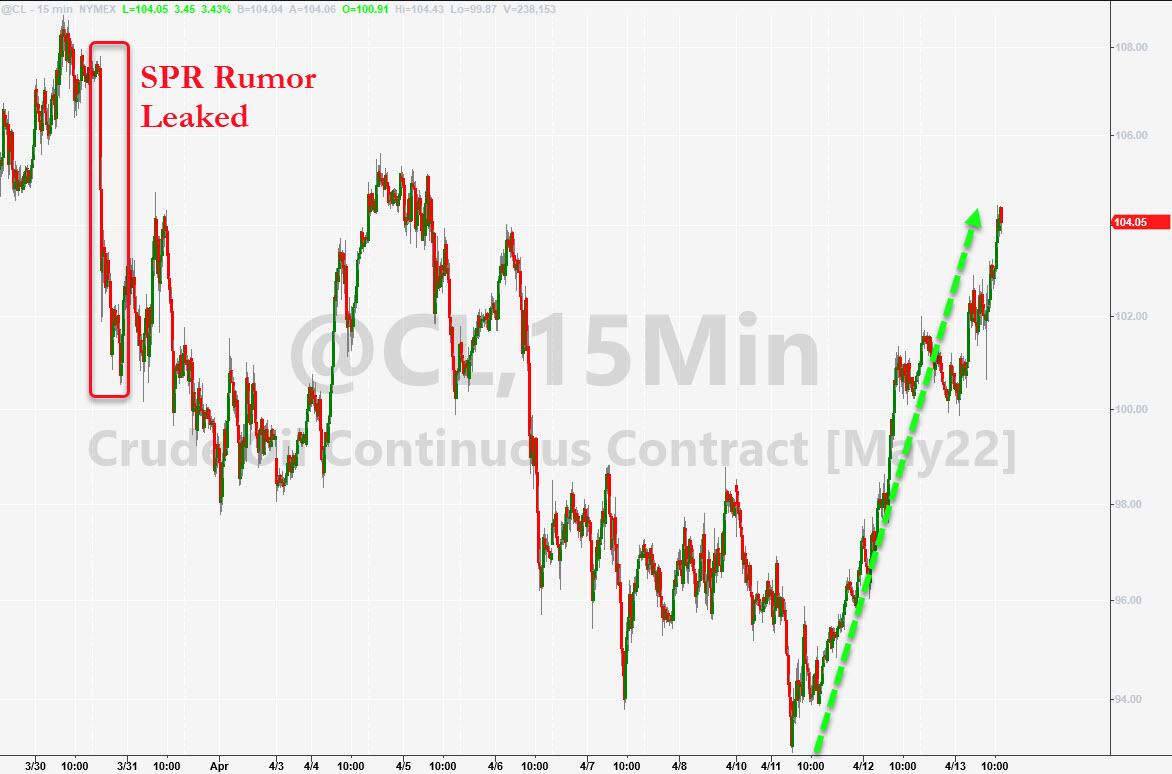
Crude Oil ripped higher despite the greatest SPR (Strategic Petroleum Reserve) release ever, which was pushed into the background on news that Russia is shutting down oil production at a more rapid rate. That will likely reverse the tiny reduction in gas prices of the recent past.

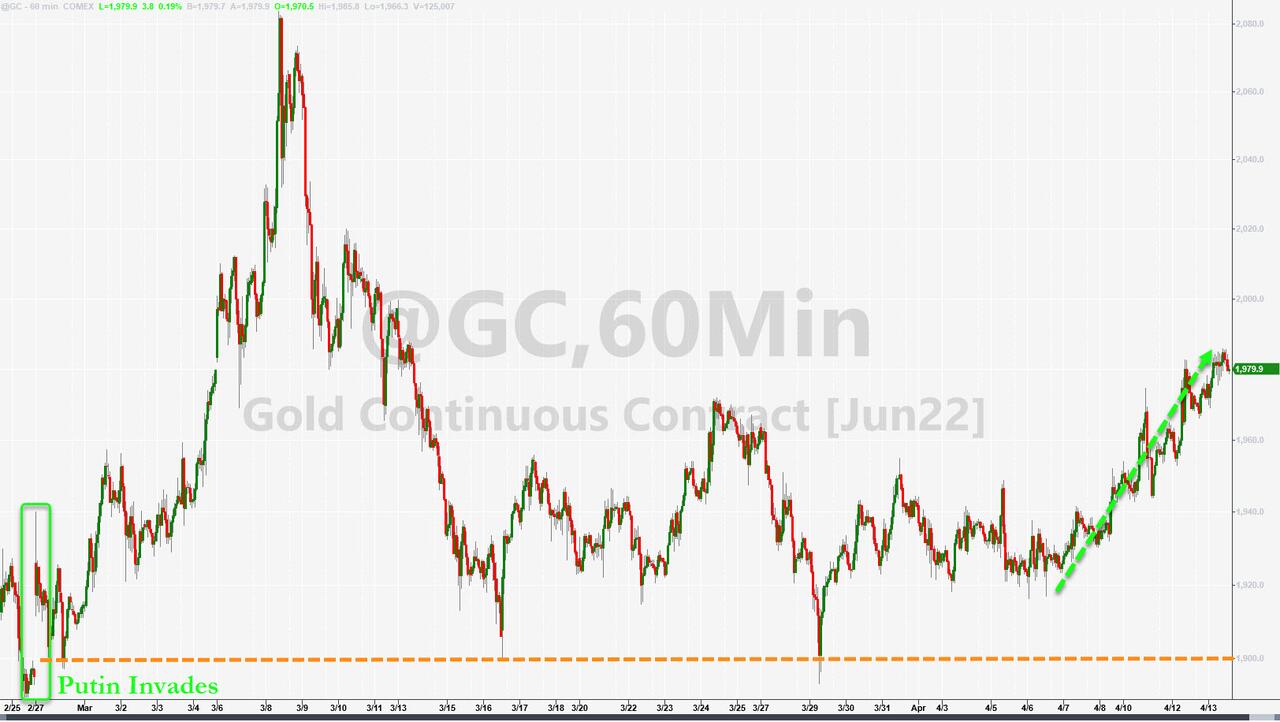
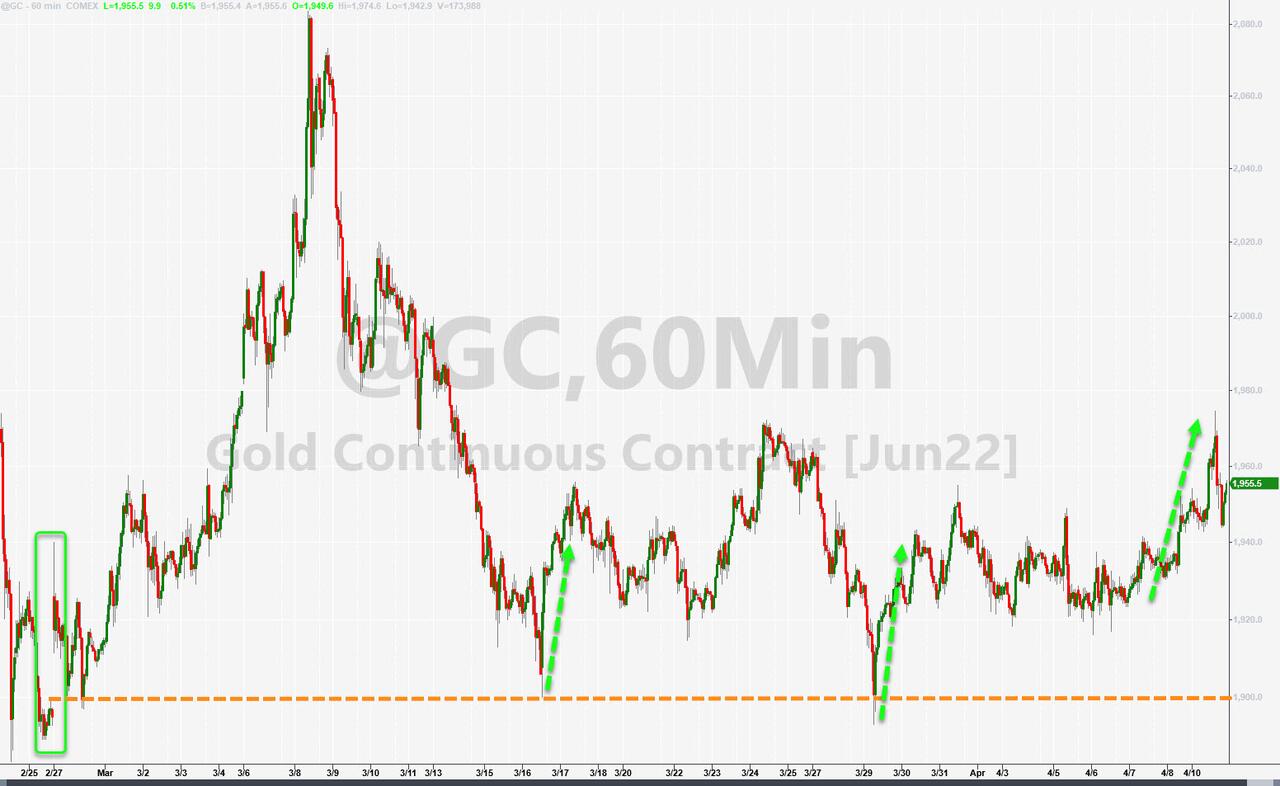
Gold maintained its upward momentum and is heading closer to breaking its $2k glass ceiling again.

Read More
CPI Reaction: Melting Up—Then Melting Down

Ulli Market Commentary Contact

[Chart courtesy of MarketWatch.com]

  1. Moving the markets

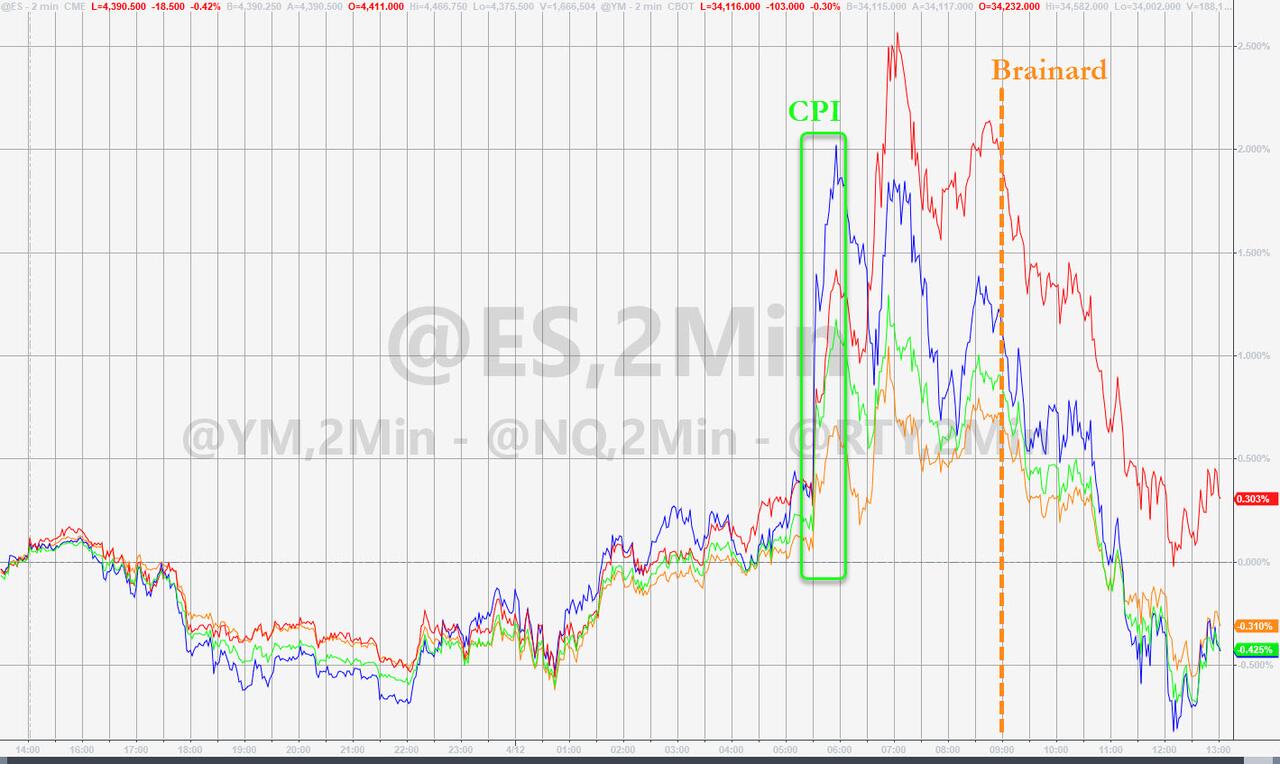
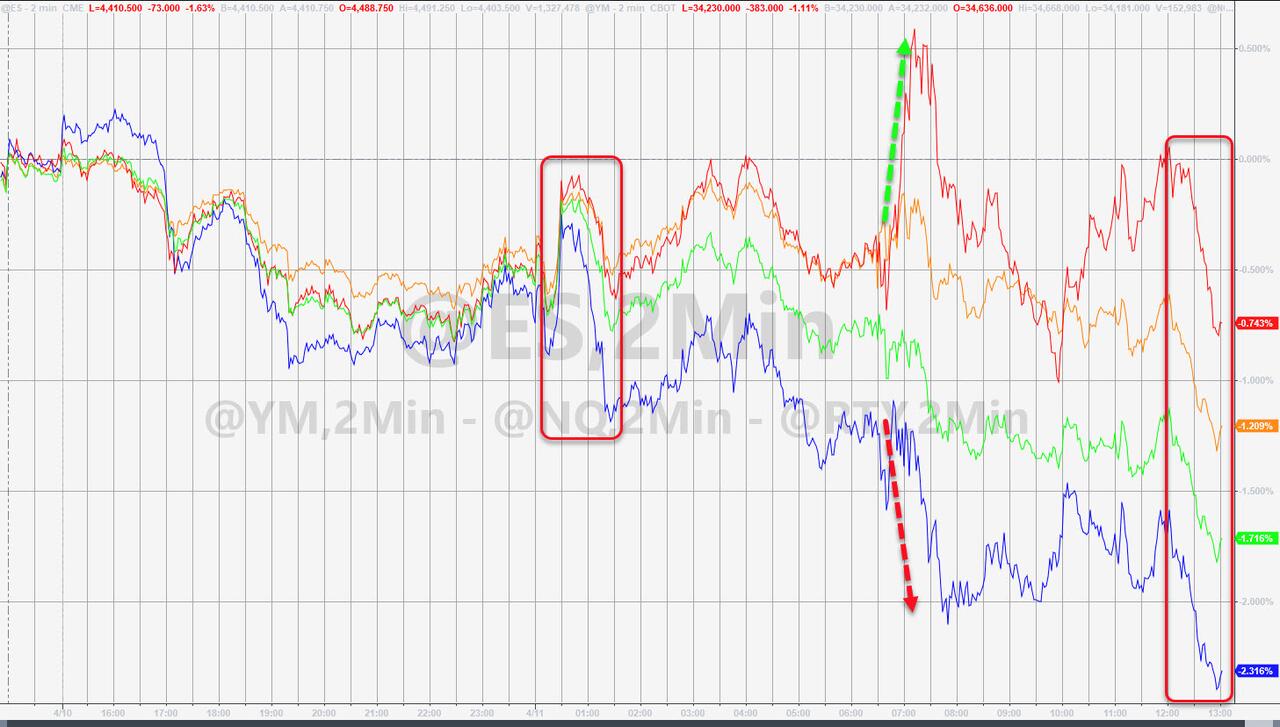
Despite the CPI coming in at an annual rate of 8.5%, worse than expected (8.4%), the fact that the index increased a horrible 1.2% MoM was simply ignored, as traders, and computer algos were encouraged by the Core CPI (excluding food and energy), which “only” rose 0.3% in March vs. an expected gain of 0.5%.  

That got the bullish juices flowing, and up we went with the Dow at one point being in the plus by over 250 points. However, there was not much conviction behind the move, especially after the Fed’s Lael Brainard confirmed her hawkishness, as ZH noted:

The Fed will move “expeditiously” to raise interest rates and return surging inflation to its 2% target, and that a decision on the balance sheet “could be as soon as May, which would lead to reductions in that balance sheet starting in June.”

That reversed the early optimism, and down we went with all 3 major indexes diving into the red, giving the bears something to cheer about. An early assist came from a short squeeze, but that attempt died on the vine.

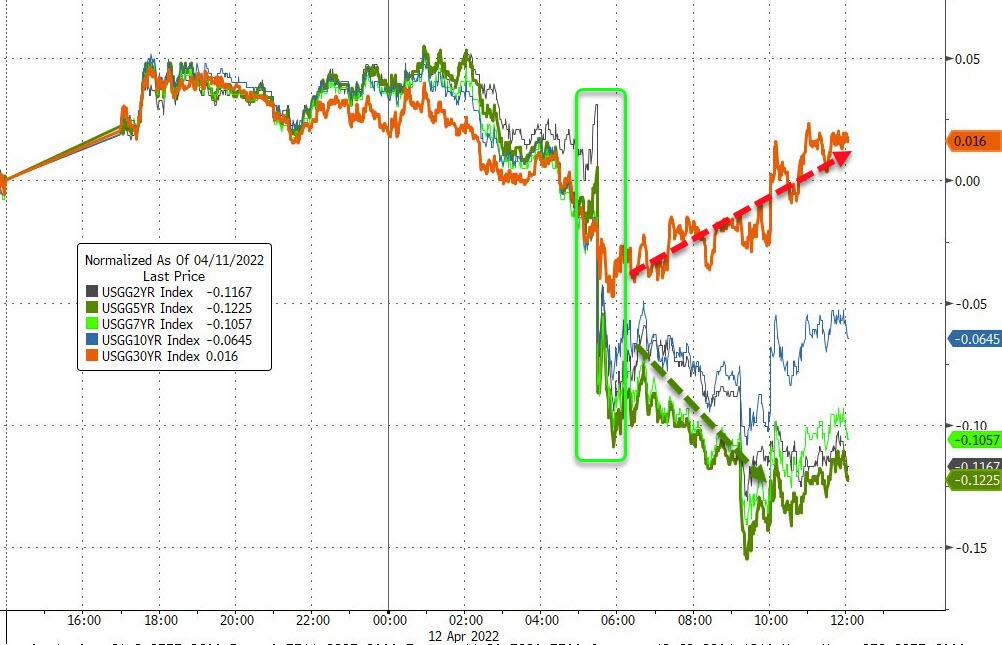
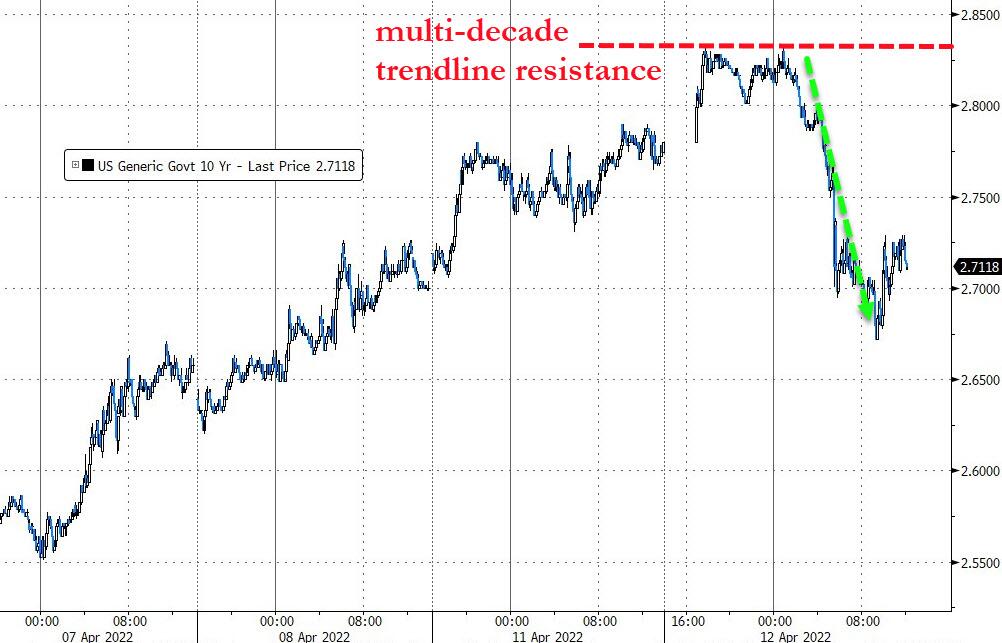
After setting early intra-day highs, bond yields slipped with the 10-year closing at 2.725%, which was quite a drop after having touched its multi-decade downtrend resistance level of 2.83%, as ZH pointed out.

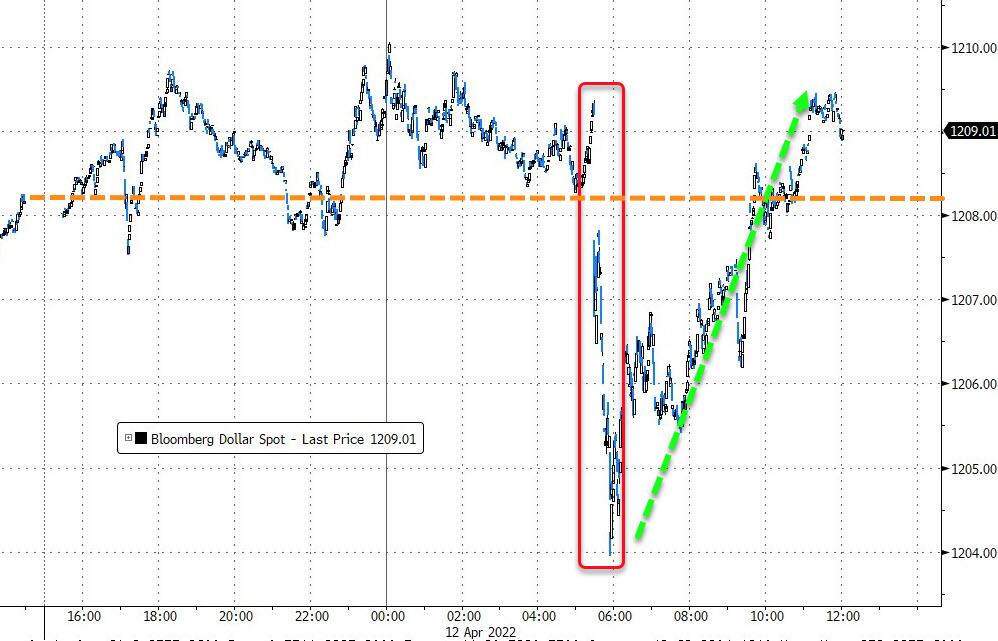
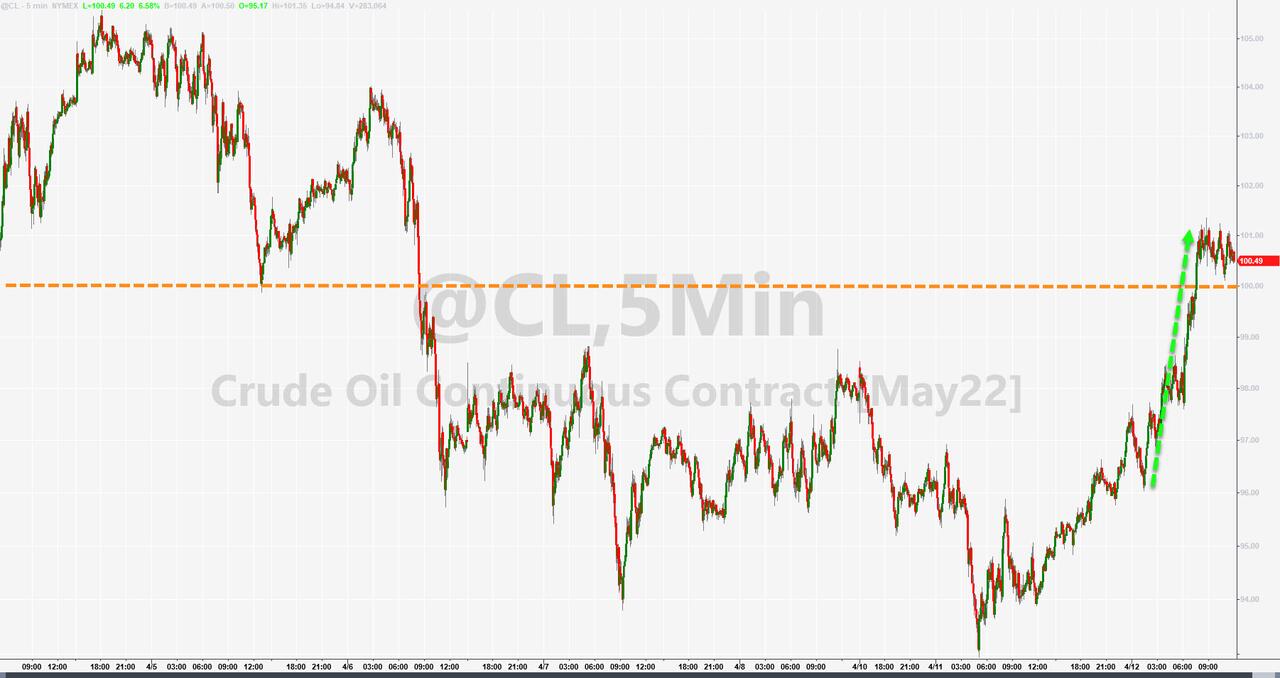
The US Dollar dumped and pumped and closed moderately higher. The energy sector ripped higher (VDE +1.67%) with Crude Oil back over $100 and the commodity index DBC gaining +2.96%.

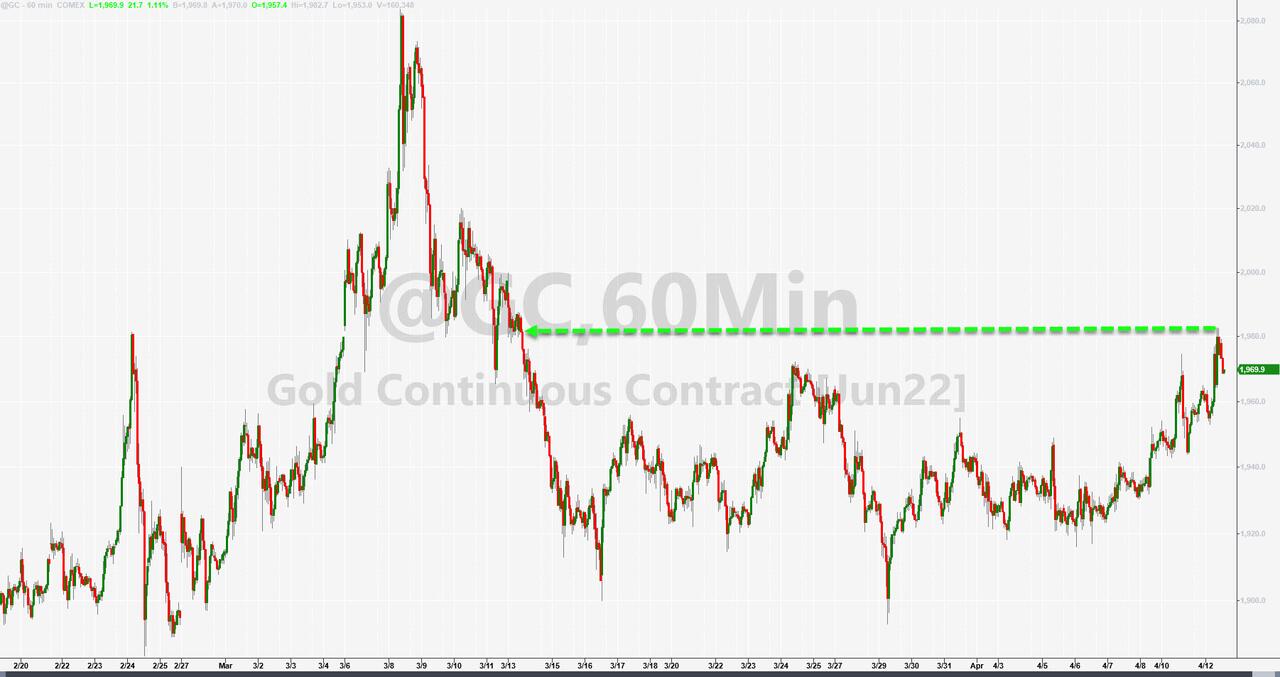
Gold danced to the beat of its own drummer by ignoring the dollar’s comeback and gained a solid +1.14% for the day, thereby again approaching its $2k level.

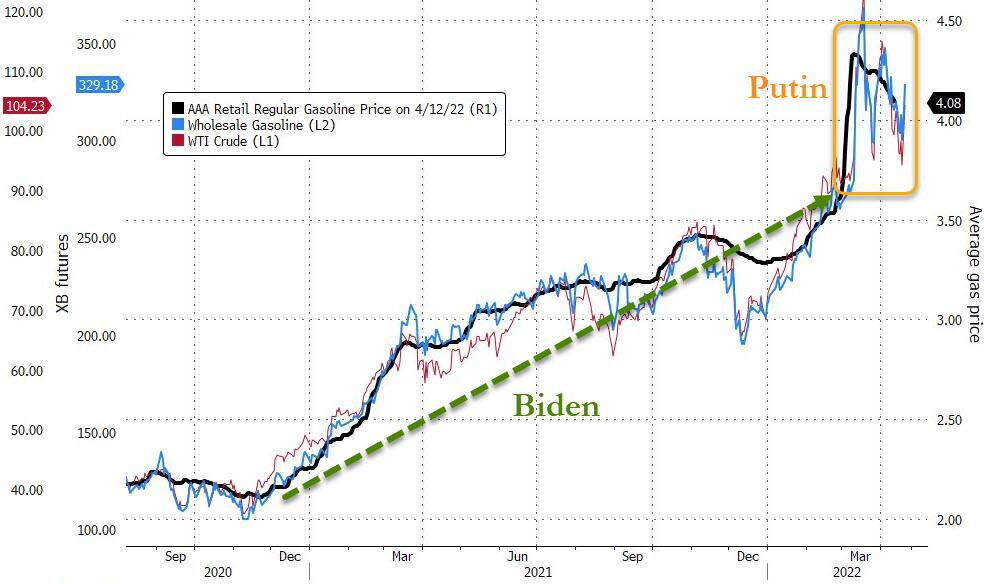
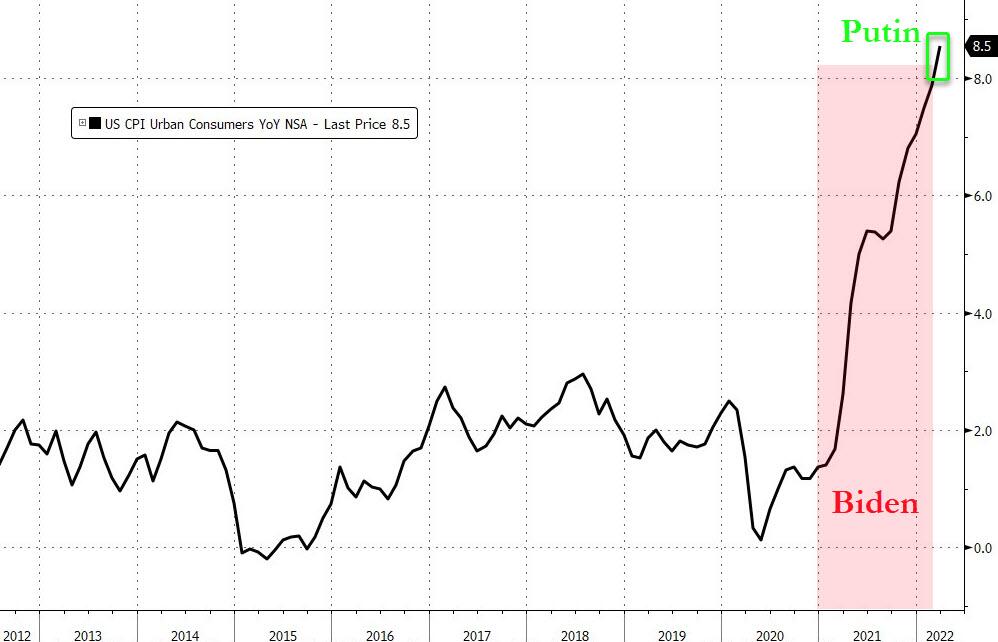
Mainstream media has been focusing on who to blame for this inflationary environment with the fingers pointing to “Putin-flation,” an accusation that this chart by Bloomberg disputes.

Yes, a picture is truly worth a thousand words.

Read More
Soaring Bond Yields Slam Equities

Ulli Market Commentary Contact

[Chart courtesy of MarketWatch.com]

  1. Moving the markets

There was no question as to who oversaw market direction today. With bond yields soaring, and the 10-year spiking to 2.78%, its highest level since January 2019 when it topped out at 2.799%, the bears clearly had the upper hand.

The major indexes got smacked with the Nasdaq leading the downturn by surrendering 2.18%, hotly pursued by the S&P 500 with a -1.69% drop. Other than gold, there was no place to hide, as bond holders were taking behind the barn for another spanking, as the most widely held TLT slumped another -1.73% bringing its YTD loss to a stunning -15.57%.

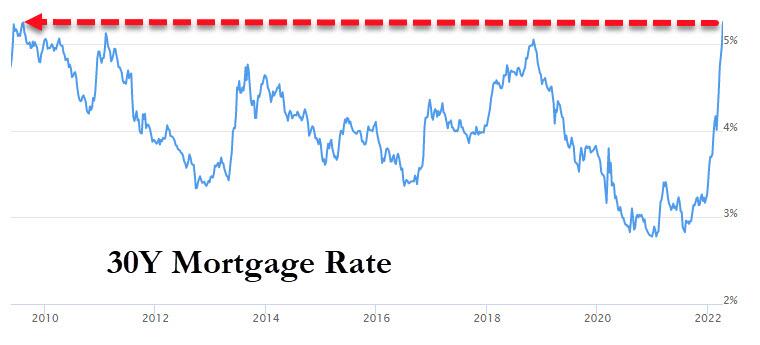
I have cautioned about bond investments for a long time. After all, when yields are at all-time lows, and inflation is raging, the most logical outcome are rising yields, which destroy bond prices. Mortgage rates were also affected with the 30-year reaching 5.25% today, it’s highest since 2009.

As a result, risk assets, especially in the tech area have been shed by traders, as the reality that we may be at the end of the bond super cycle slowly sinks in. If the Fed is serious about fighting inflation, and follows through with their accelerated hiking schedule, there will be much more downside equity pain on deck, which is why it’s critical to limit risk via an exit strategy.

One analyst summed it up like this:

And right now, the Fed has an urgent and fateful decision to make.

It can keep printing trillions of dollars, let inflation skyrocket, or tighten monetary policy, and watch the stock market crash.

In other words, it can sacrifice the stock market or the dollar.

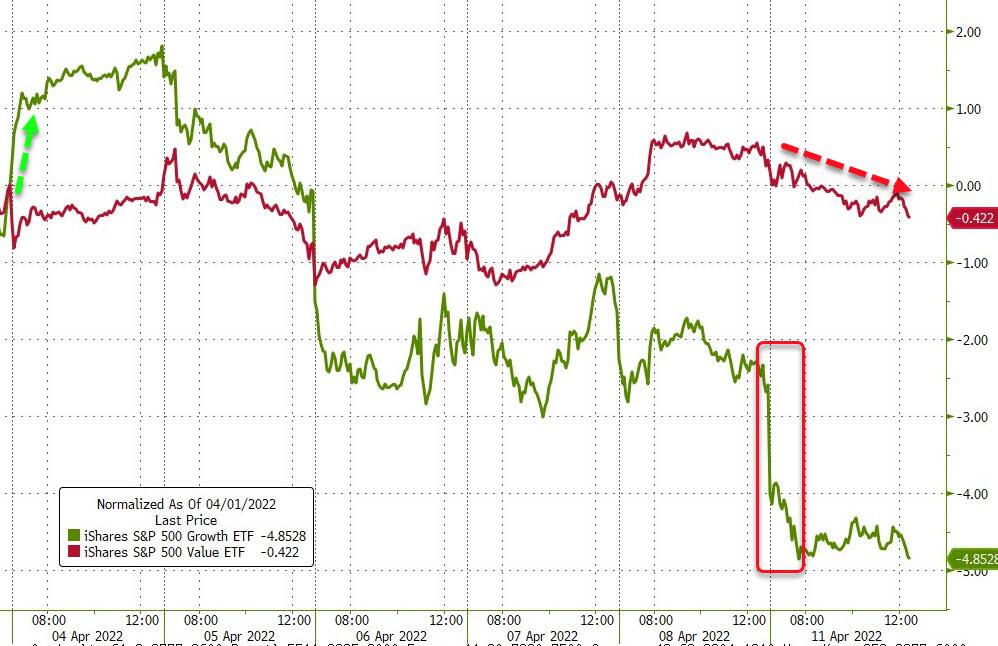
Despite “value” ending up moderately in the red, “growth” got slapped, as Bloomberg demonstrates in this chart.

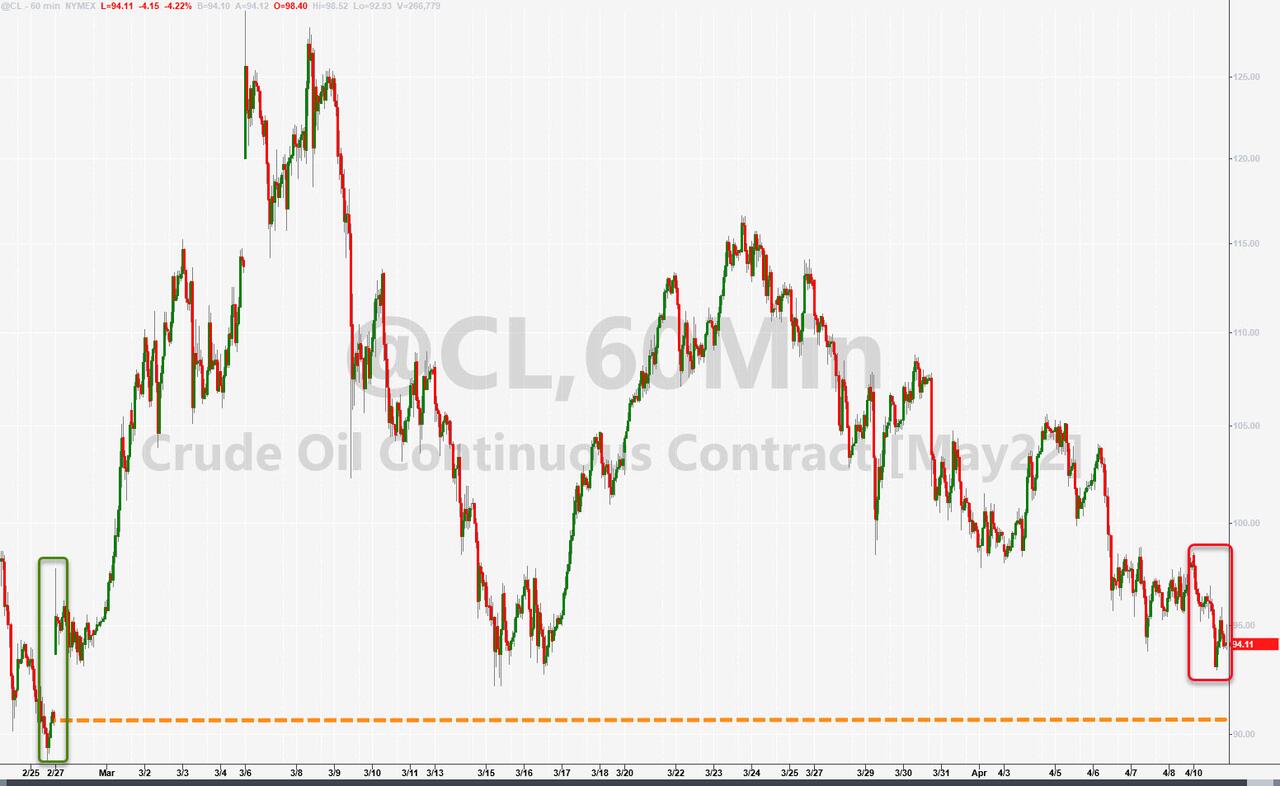
Crude oil pulled back again and currently sits a tad below $95, with the Energy sector slipping as well, but Gold was the savior of the day by gaining +0.64%.

The most anticipated number will be tomorrow’s CPI with consensus estimates being in the 8.4% range. Ouch.

A tip of the hat goes to ZeroHedge for this quote by Chicago Fed President Charles Evans, who said today:

“We will know a lot more about persistent inflation the end of the year” and (here’s the best line), he is “hopeful it’s receding…”

Ah yes, I feel much better now…

Read More
ETFs On The Cutline – Updated Through 04/08/2022

Ulli ETFs on the Cutline Contact

Below, please find the latest High-Volume ETF Cutline report, which shows how far above or below their respective long-term trend lines (39-week SMA) my currently tracked ETFs are positioned.

This report covers the HV ETF Master List from Thursday’s StatSheet and includes 312 High Volume ETFs, defined as those with an average daily volume of more than $5 million, of which currently 106 (last week 117) are hovering in bullish territory. The yellow line separates those ETFs that are positioned above their trend line (%M/A) from those that have dropped below it.
Take a look:                                                                   

The HV ETF Master Cutline Report

In case you are not familiar with some of the terminology used in the reports, please read the Glossary of Terms. If you missed the original post about the Cutline approach, you can read it here.      

ETF Tracker Newsletter For April 8, 2022

Ulli ETF Tracker Contact

ETF Tracker StatSheet          

You can view the latest version here.

TRYING TO OVERCOME FED ANGST

[Chart courtesy of MarketWatch.com]

  1. Moving the markets

A former Fed president said what he was not allowed to when he was in office, namely that the Fed needs to push down equities to get inflation under control. This was followed by a current Fed member uttering that he wants the Fund Funds rate at 3.5% by the end of this year.

Both comments should have been enough to send the bulls packing, but instead, after an early drop, an algo driven rebound pushed the major indexes in the green, with the Dow at one point sporting a 230-point gain.

However, in the end, only the Dow eked out a meager advance during another whip-saw session that merely represented the continued tug-of-war between bulls and bears with the latter scoring a win for the week.

Even the most optimistic Wall Street bulls can no longer ignore the changing tone of the Fed, which continues to signal a more aggressive stance towards fighting inflation. Even the Fed’s Bill Dudley explained that, after watching stocks rise, this simply means “The Fed will just have an even bigger bubble to crash in order to get inflation under control.”

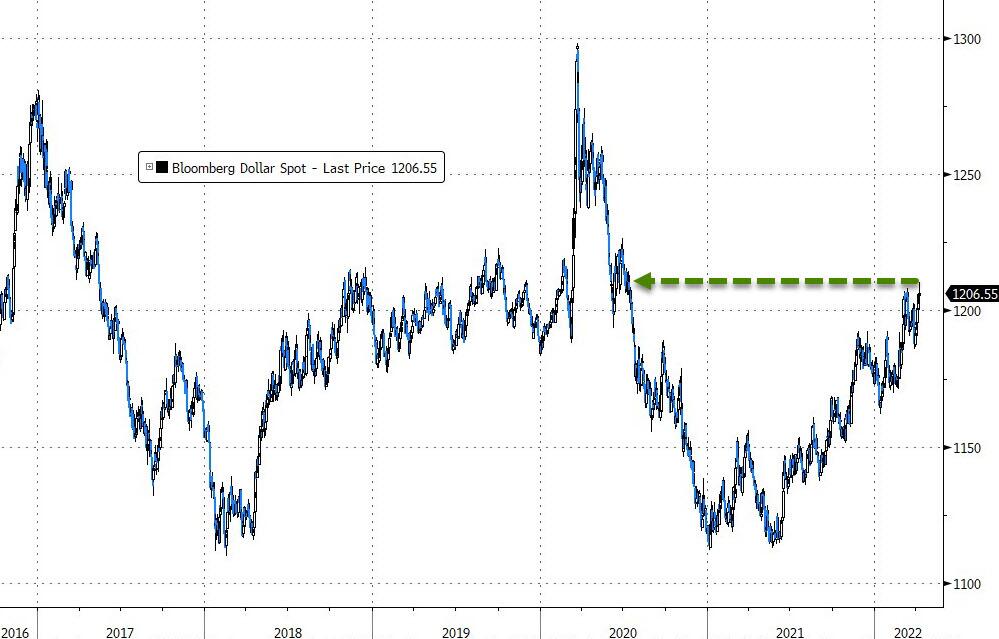
This was very apparent in bond land with the 10-year jumping sharply by 9 bps to close the day at 2.707%. The US Dollar followed suit and reached its highest level since July 2020, as ZH pointed out.  

Despite the strong dollar, gold and silver inched higher this week with gold adding another 0.54% during today’s session. My favorite energy ETF for this environment had another great showing with a day’s gain of +2.68%.

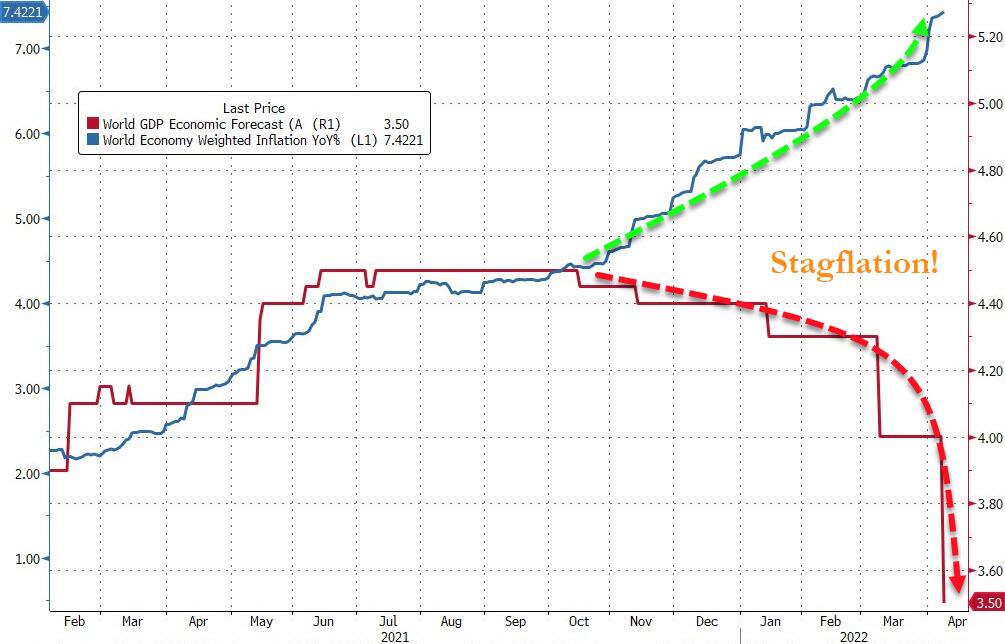
Looking at the World GDP forecast and the World weighted inflation index, it’s clear that the dreaded “S” word, as in Stagflation, which I have repeatedly commented on, seems to be on deck, as Bloomberg demonstrates in this chart.

That translates to “equities beware.”

Read More