Weekly StatSheet For The ETF Tracker Newsletter – Updated Through 05/05/2022

Ulli ETF StatSheet Contact

ETF Data updated through Thursday, May 5, 2022
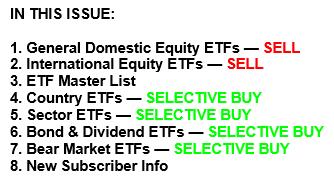
Methodology/Use of this StatSheet:

1. From the universe of over 1,800 ETFs, I have selected only those with a trading volume of over $5 million per day (HV ETFs), so that liquidity and a small bid/ask spread are assured.

2. Trend Tracking Indexes (TTIs)

Buy or Sell decisions for Domestic and International ETFs (section 1 and 2), are made based on the respective TTI and its position either above or below its long-term M/A (Moving Average). A crossing of the trend line from below accompanied by some staying power above constitutes a “Buy” signal. Conversely, a clear break below the line constitutes a “Sell” signal. Additionally, I use an 12% trailing stop loss on all positions in these categories to control downside risk.

3. All other investment arenas do not have a TTI and should be traded based on the position of the individual ETF relative to its own respective trend line (%M/A). That’s why those signals are referred to as a “Selective Buy.” In other words, if an ETF crosses its own trendline to the upside, a “Buy” signal is generated. Here too, I recommend trailing sell stop of 12%, or less, depending on your risk tolerance.

If you are unfamiliar with some of the terminology, please see Glossary of Terms and new subscriber information in section 9.     

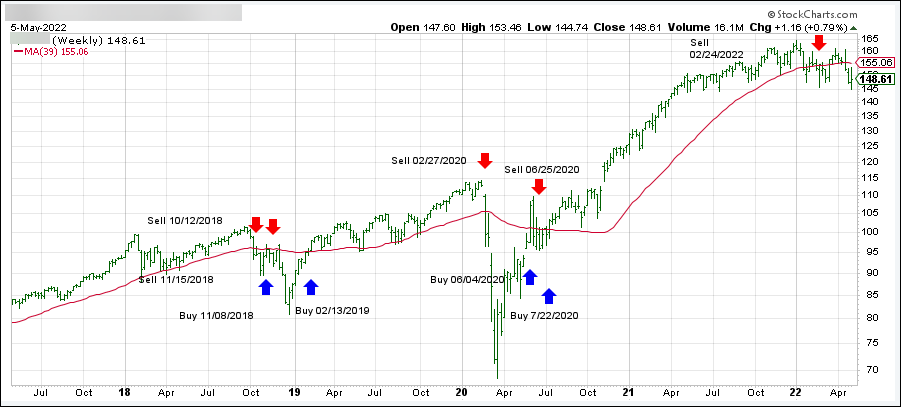
1. DOMESTIC EQUITY ETFs: SELL — since 02/24/2022
Click on chart to enlarge

Our main directional indicator, the Domestic Trend Tracking Index (TTI-green line in the above chart) has broken below its long-term trend line (red) by -4.22% and remains in “SELL” mode.

Read More
From Relief Rally To Bloodbath

Ulli Market Commentary Contact

[Chart courtesy of MarketWatch.com]

  1. Moving the markets

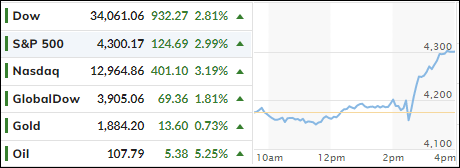
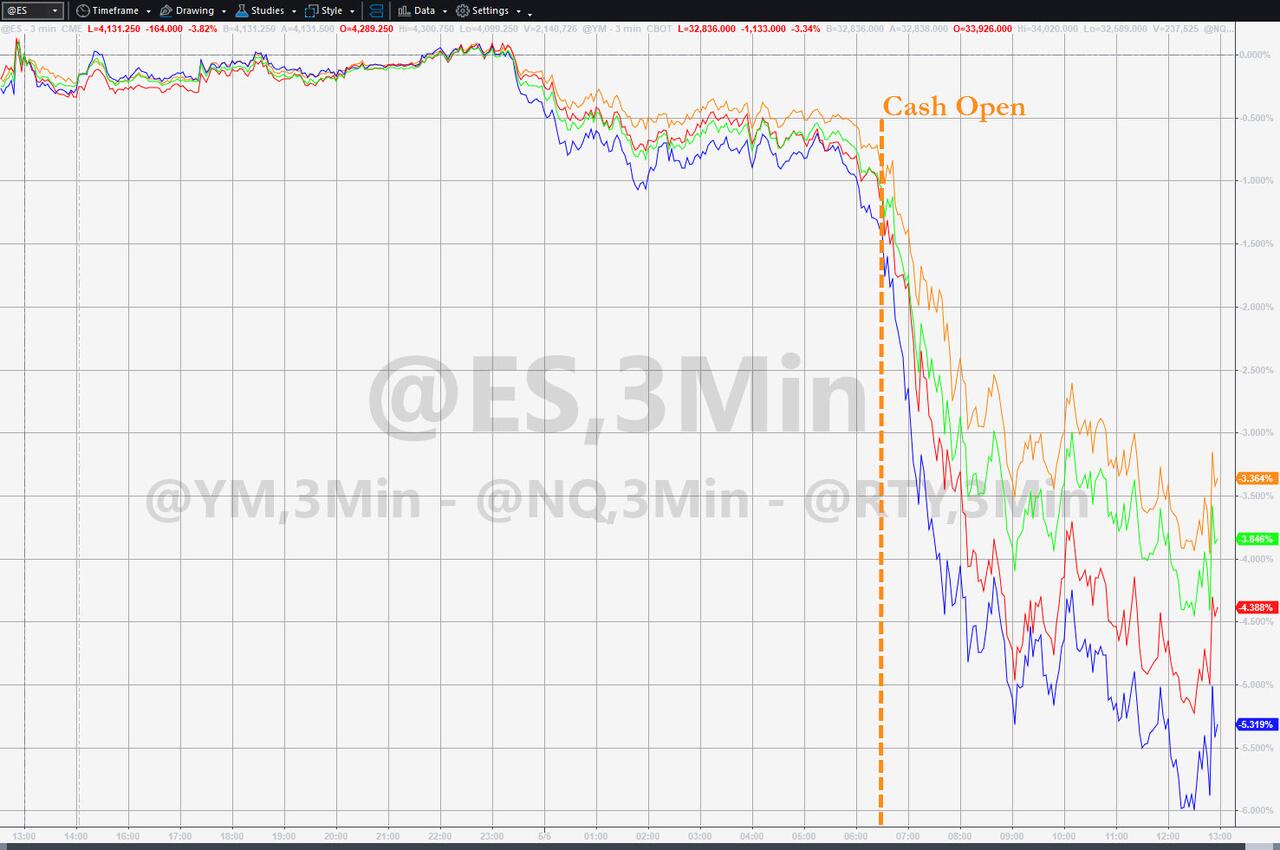
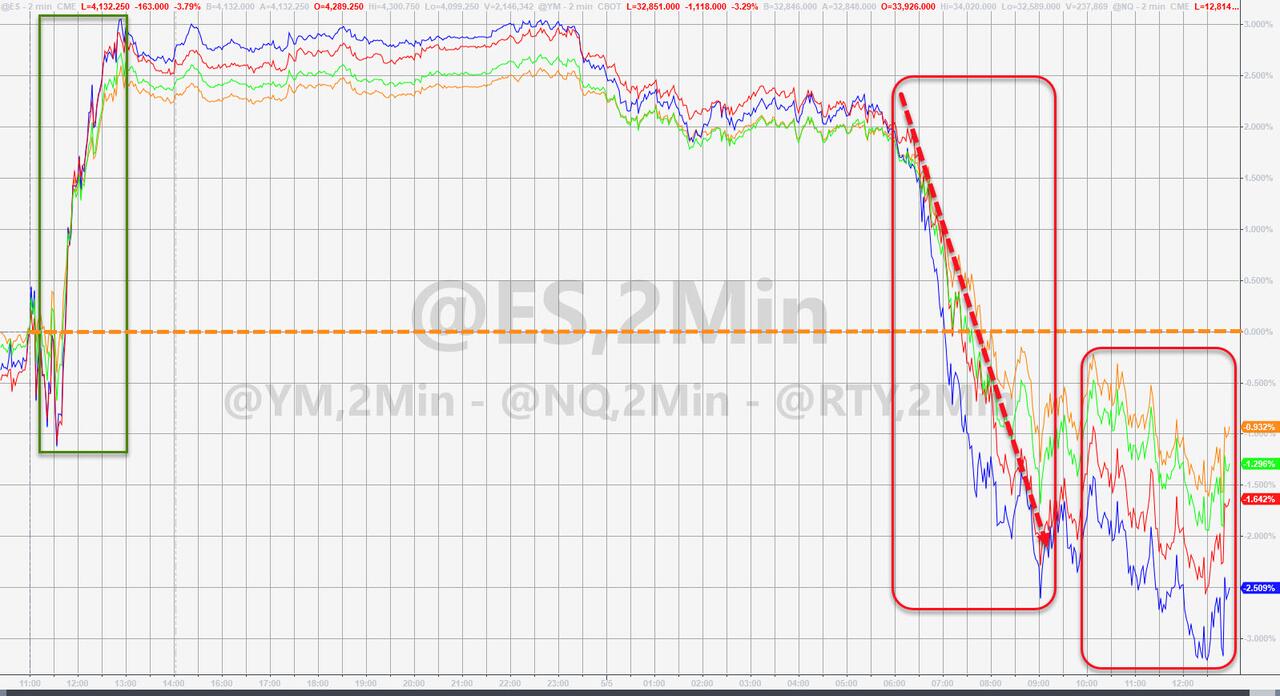
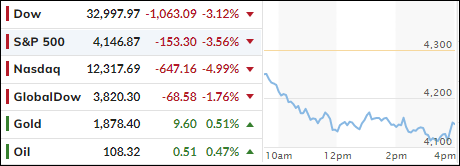
Today’s bloodbath in equities makes yesterday’s “rebound of hope” look like a dead cat bounce, as dip buyers were not to be found anywhere. “Stunning” best describes this sudden reversal, which erased yesterday’s profits and then some.

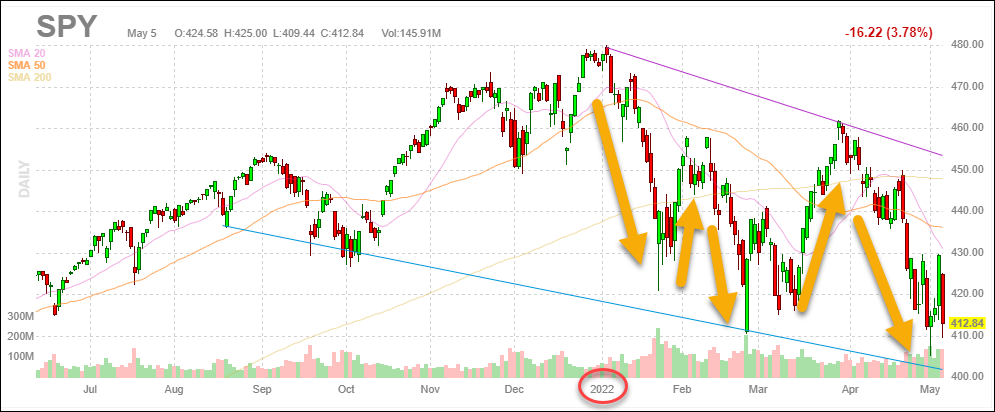
With the Dow tumbling over 1,000 points, domestic equities notched their worst day of the year on top of the already stunning losses YTD. This chart, courtesy of FinViz.com, shows the wild ride we have seen in 2022:

With lower highs and lower lows dominating, and my Domestic TTI now hovering below its long-term trend line by -4.22%, we are clearly stuck in bear market territory and are watching endless rebound attempts.

While there was no place to hide, our selected sector ETFs, took only a small hit, with our latest addition, TBF, being the only one to score a solid gain of +2.81%.

As ZeroHedge noted:

  • Remember yesterday was the best performance for a Fed rate-hike day since 1978!
  • And today, the Nasdaq 100 Index fell 6% at its lows, the most since March 2020…
  • …fully reversing yesterday’s post-FOMC gains

In the past week we have had:

  • Friday: biggest drop since June 2020
  • Wednesday: biggest surge since May 2020
  • Thursday: biggest drop since June 2020

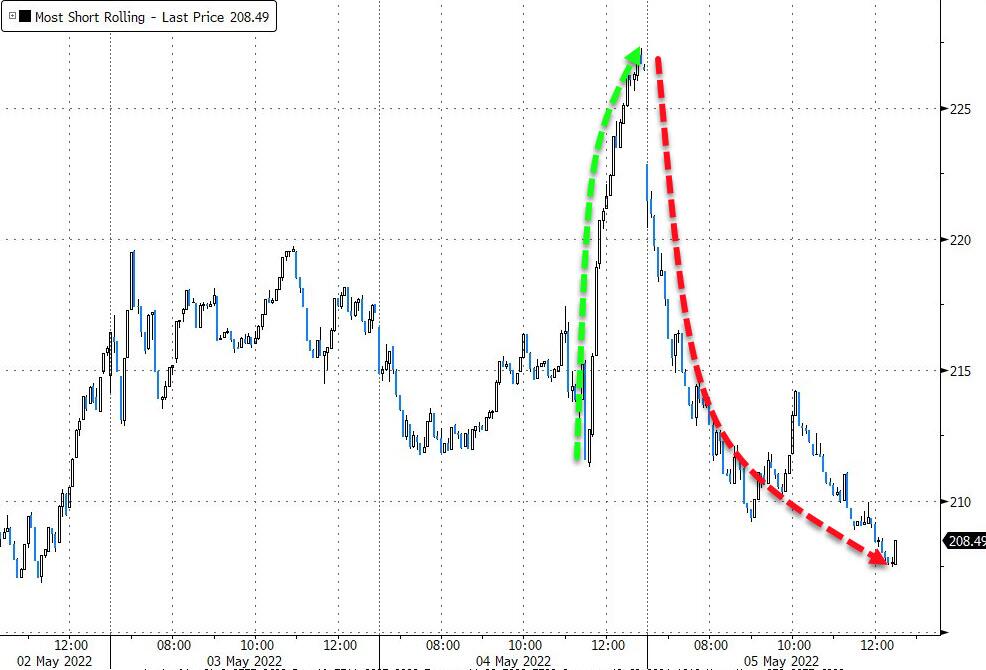
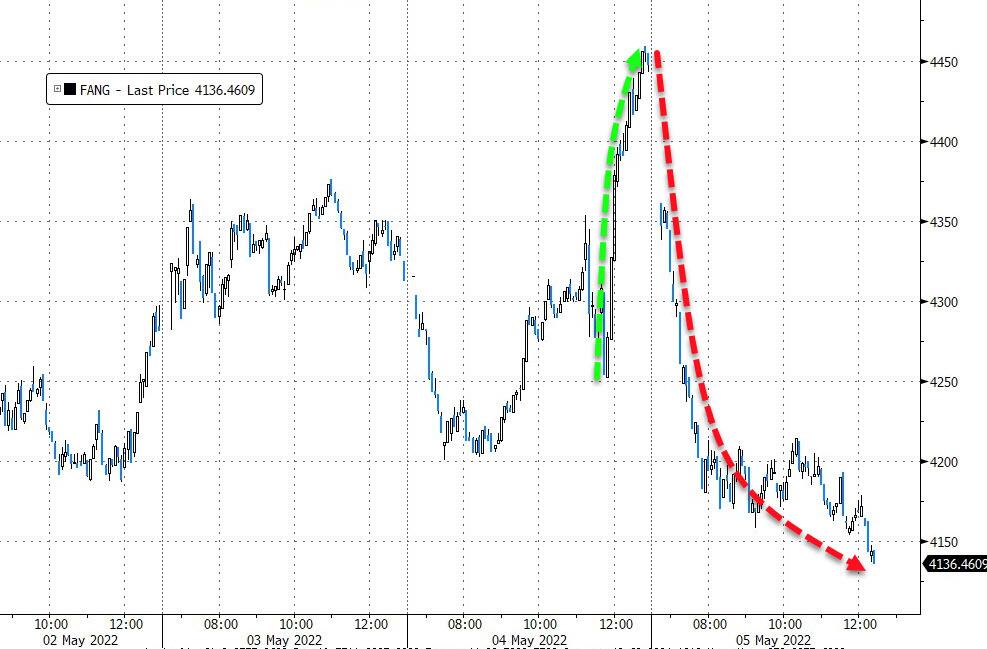
And, not helping matters today was the huge unwind of yesterday’s massive short-squeeze causing FANG stocks to chuck-up the hardest.  

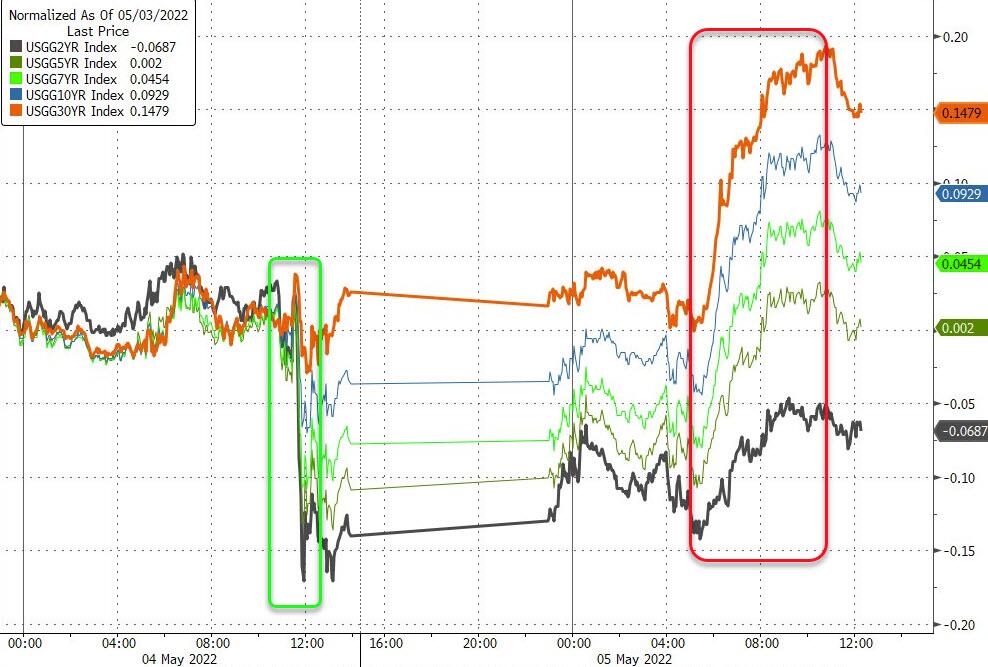
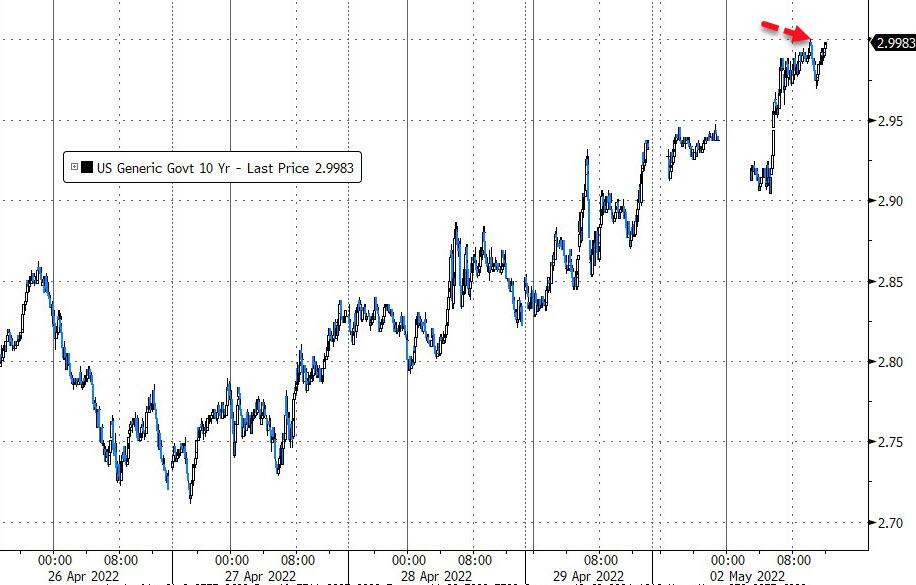
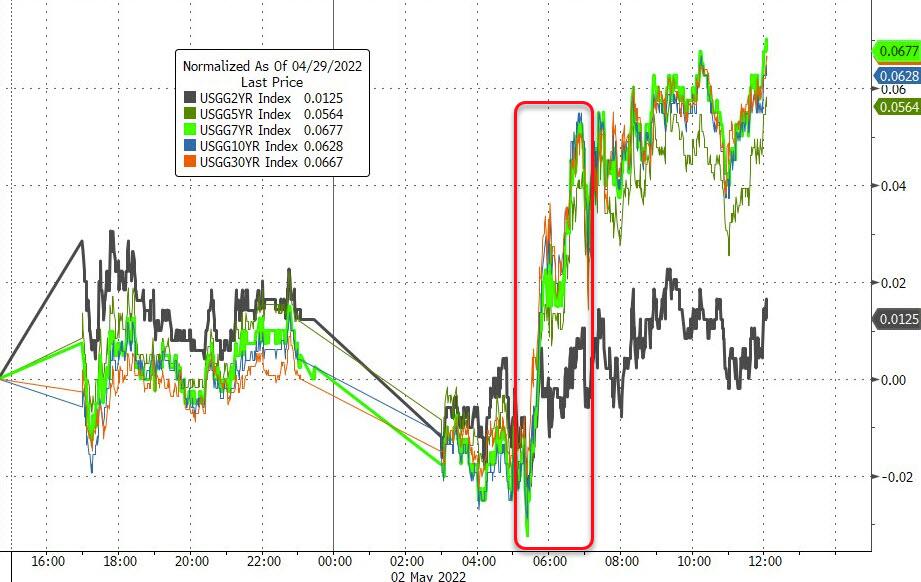
Spiking bond yields were at the center of today’s debacle with the 10-year breaking through the 3% barrier and closing up 8.2 bps at 3.045%.

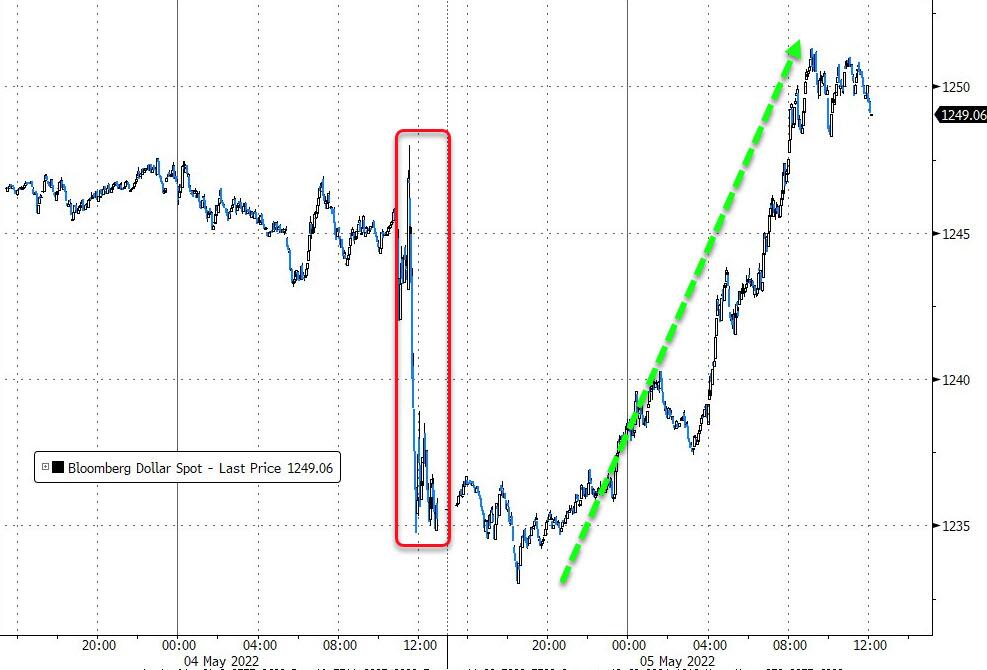
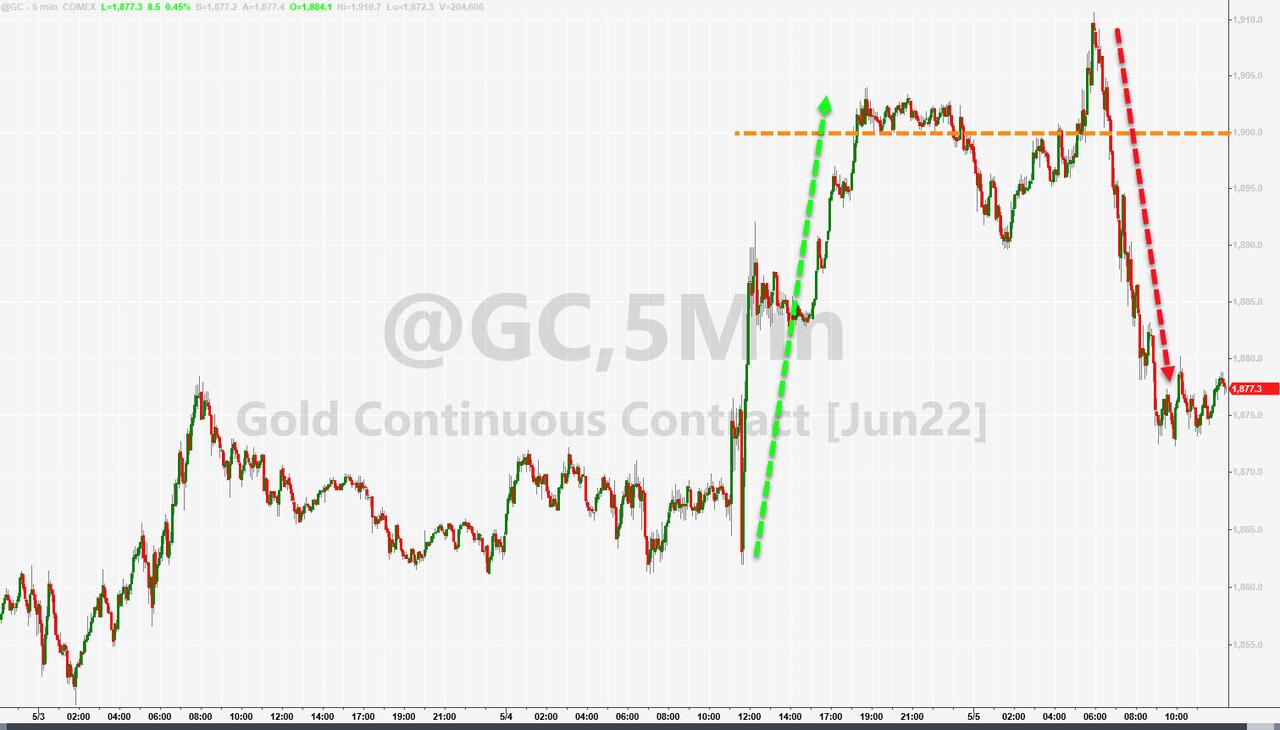
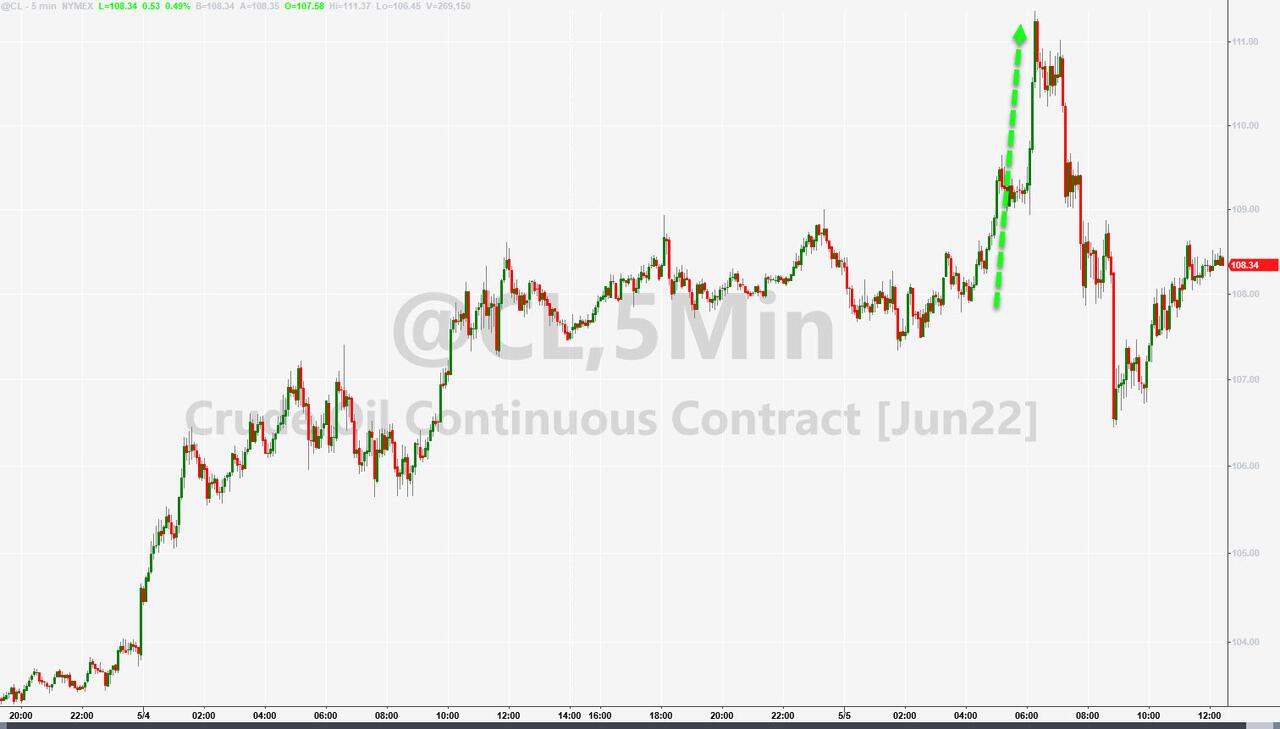
The US Dollar rebounded after yesterday’s losses, Gold jumped but could not hold on to early gains, but Crude Oil ended the day higher.

It was a wild and crazy session in the markets, and I believe this type of uncertainty is far from being over.

Read More

Fed’s Modest Rate Hike Pleases Markets

Ulli Market Commentary Contact

[Chart courtesy of MarketWatch.com]

  1. Moving the markets

While the headlines were screaming “Fed fires off biggest interest-rate hike since 2000,” the reality of it is that the increase in the Fed Funds rate from 0.5% t0 1% is hardly enough to fight inflation with a current CPI of 8.5%, which likely will explode higher next week with the latest data release.

For the moment, however, the big news was that the Fed hiked in line with market expectations, which catapulted the indexes sharply higher and wiped-out last Friday’s losses. It also shows that the Fed is beholden to the markets, which by many has been considered a policy error, as they hung on way too long to the “inflation is transitory” theme and ignored the magnitude of the growing inflationary forces.

Be that as it may, for today, a bear market relief rally finally gave the bulls some hope, as the opinion that the Fed can slow inflation without causing a recession prevailed. Just because Fed head Powell placated markets today does not mean he won’t turn more hawkish once the inflation numbers worsen.

For today, that thought was not on deck, as Powell explained:

“So a 75 basis point increase is not something that committee is actively considering, I think expectations are that we’ll start to see inflation, you know, flattening out.”

“I would say we have a good chance to have a soft, or soft-ish, landing.”

Really? I think the Fed chair will eat these words in the future but, at this moment in time, that was all it took to shift the computer algos into overdrive, and up went.

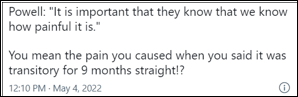
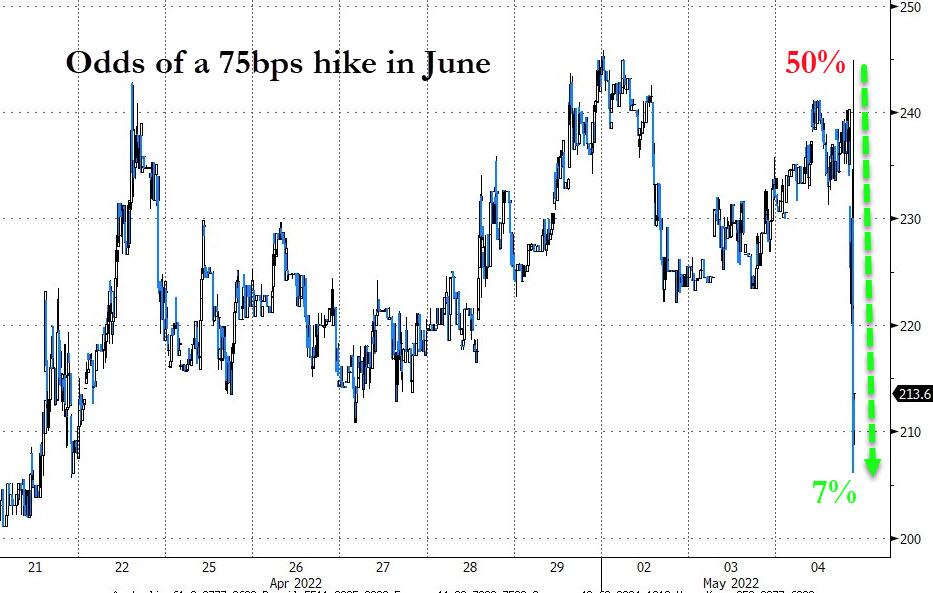
Since the bullish theme overrode all common sense, ZeroHedge tried to instill some reality with this tweet:

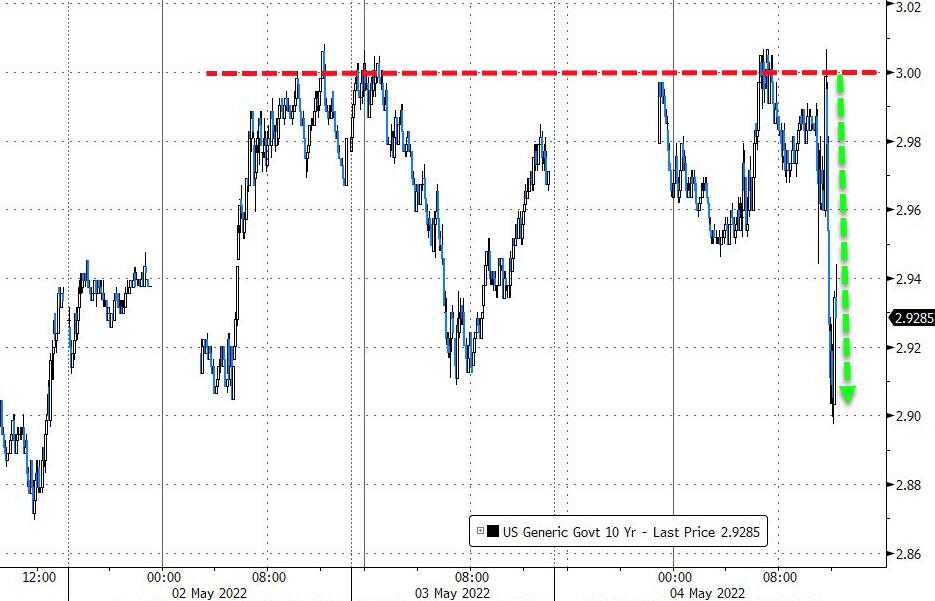
Bond yields jumped initially, with the 10-year touching its 3% level twice before backing off on Powell’s statements.

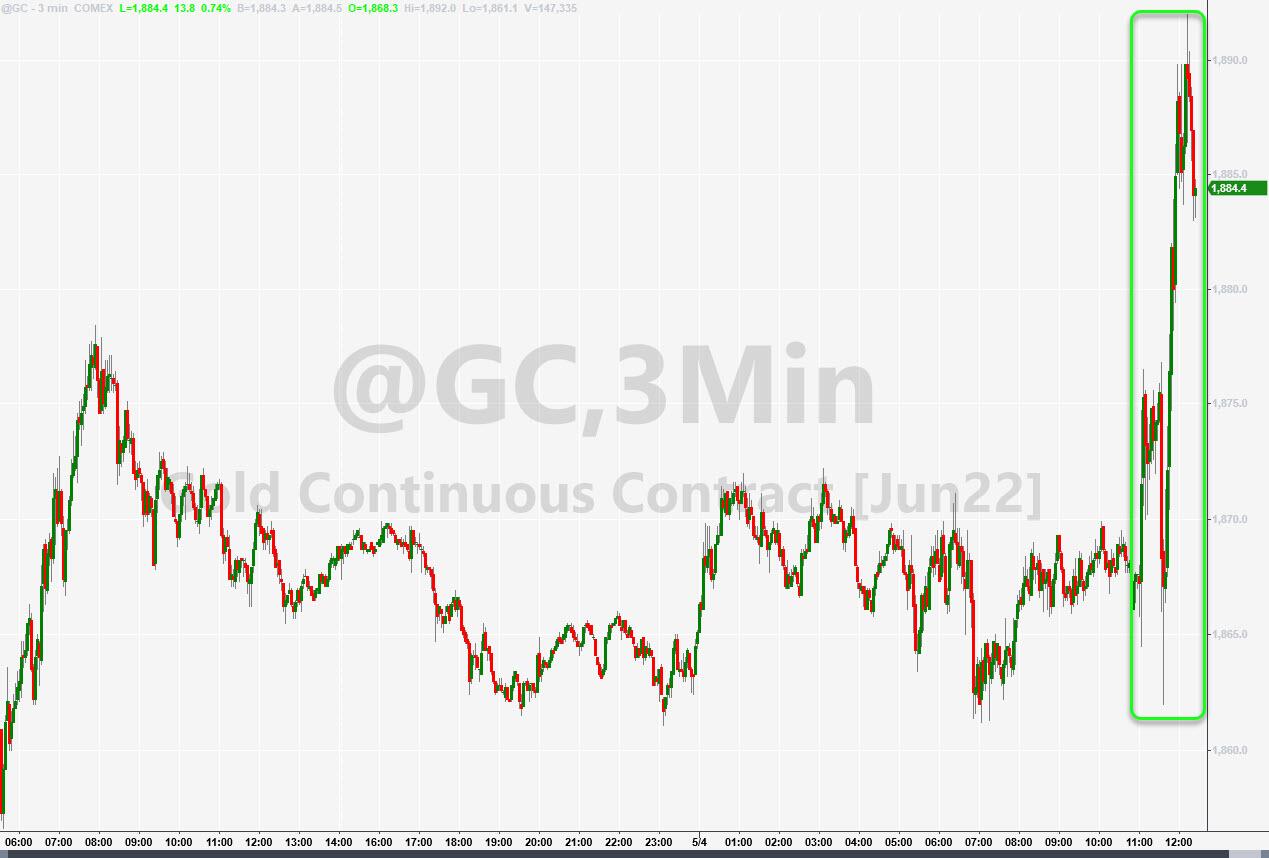
All sectors joined the rebound, but energy, VDE, took top billing with a gain of +4.13%, while commodities (DBC) performed very well by adding +3.12%. Gold lagged but managed to rally +0.98% but could not climb above its $1,900 level.

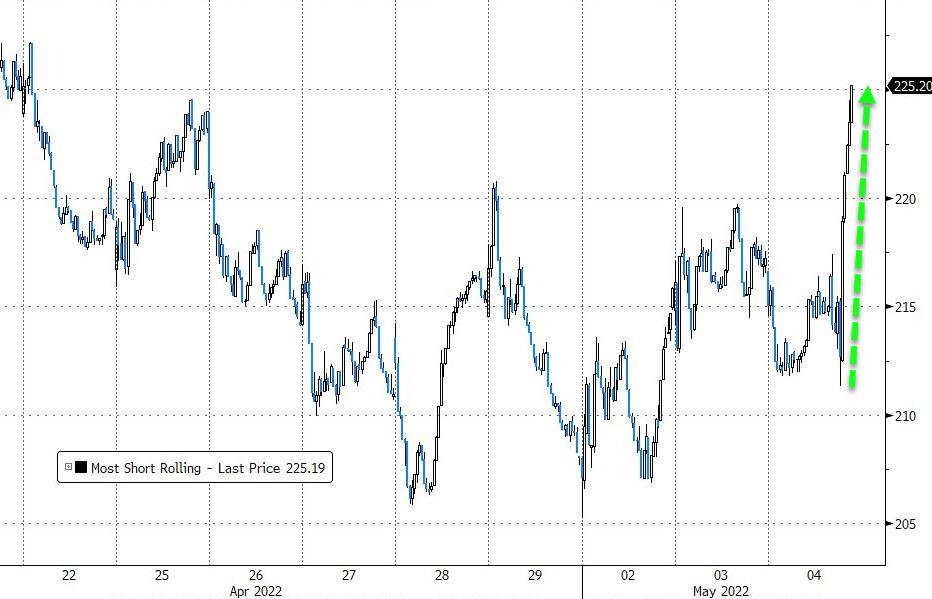
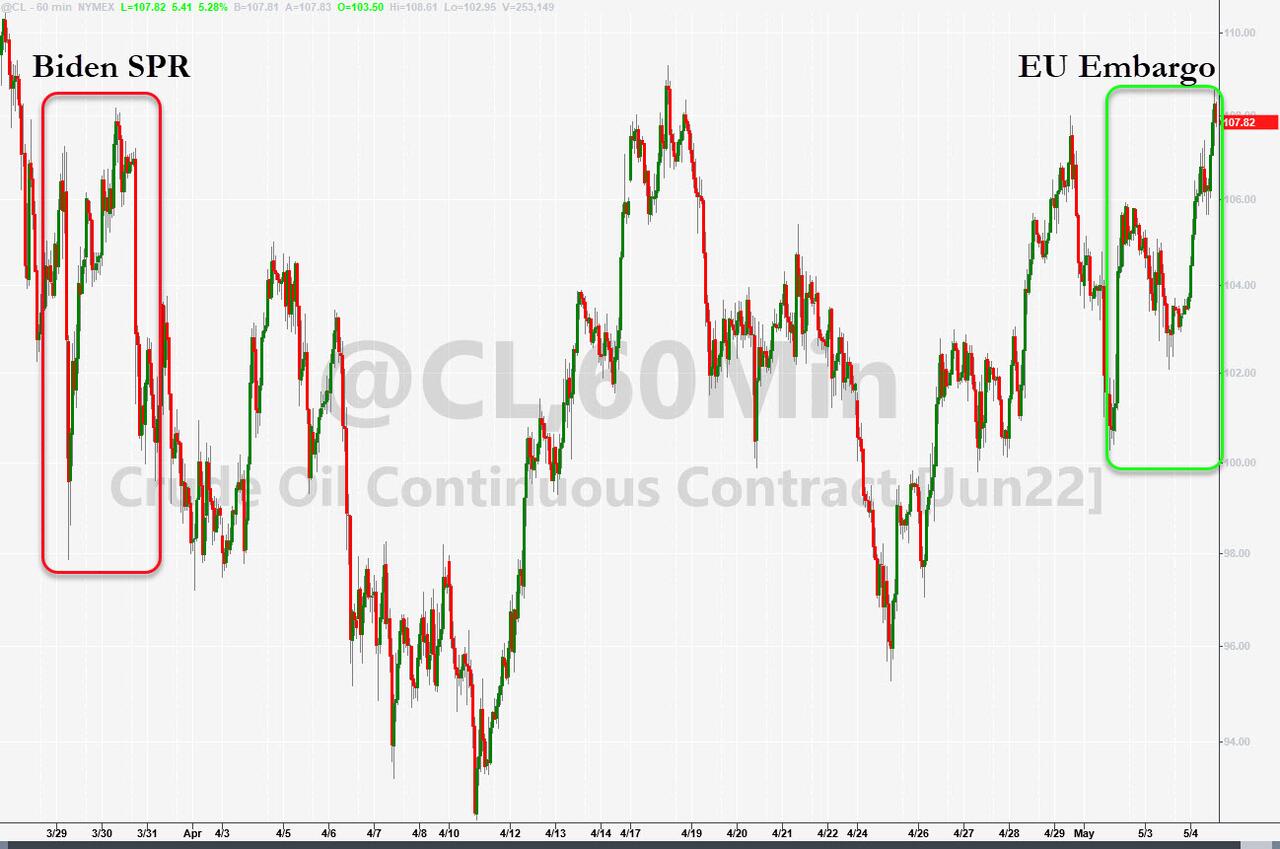
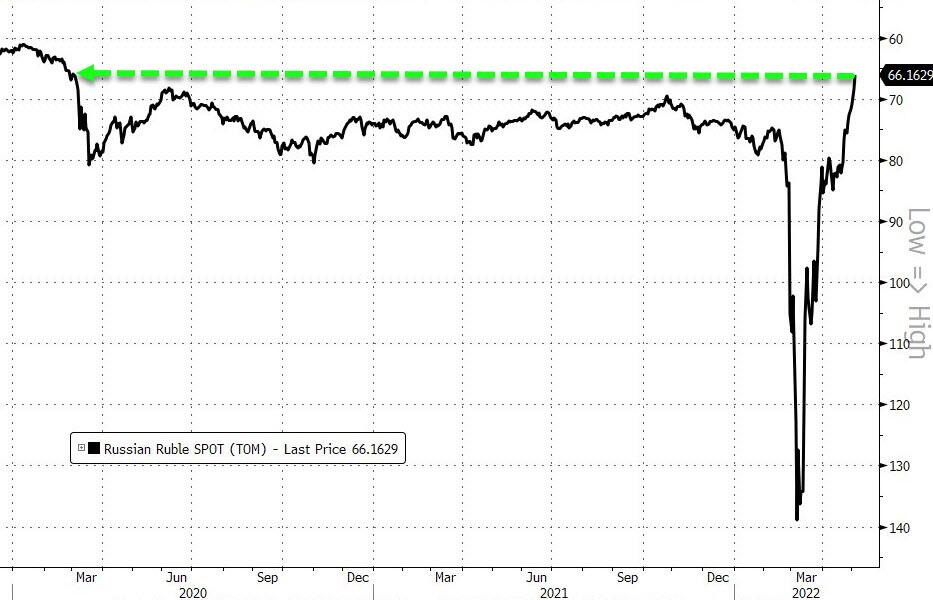
Of course, no rally can happen without a short squeeze, and today was no exception. Crude Oil soared, the dollar tumbled, while the Russian Ruble rallied to it strongest relative to the dollar since February 2020, as ZH pointed out.     

Then Powell ended with this:  

“Our tools don’t really work on supply shocks, our tools work on demand.”

Makes me go “hmm.”

Read More

Waiting For The Fed

Ulli Market Commentary Contact

[Chart courtesy of MarketWatch.com]

  1. Moving the markets

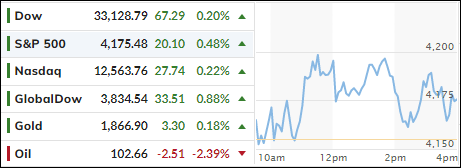
Aimless meandering best describes today’s session during which rally attempts were rebuffed with the major indexes dropping, bouncing off their respective unchanged lines and ending up moderately in the green.

Ahead of the Fed’s decision on interest rates tomorrow, the market environment was one of nervousness with the tug-of-war continuing between those traders who believe “the bottom” is in vs. the bears who are anxious about the potential of a sharp rebound rally.

With opposite forces at play, namely a slowing economy and a tightening Fed, hedge fund manager Paul Tudor Jones took time out from his busy schedule to utter these words of wisdom that “capital preservation should be the main goal for investors.”

No kidding. This is the purpose of engaging in Trend Tracking and the use of trailing sell stops to begin with, because there will always be periods where risk and uncertainty have risen to an all-time high, such as we are experiencing now.

Of course, not everyone understands the prudence of riding out bearish periods on the sidelines, which prompted ZeroHedge to tweet this keen and spot-on observation:

Bond yields dropped and popped, but the 10-year stopped short of reaching its 3% level again. Energy took top billing with VDE adding a solid +3.05%. Gold found some stability as well but only gained a tad and remains short of reaching its $1,900 level.

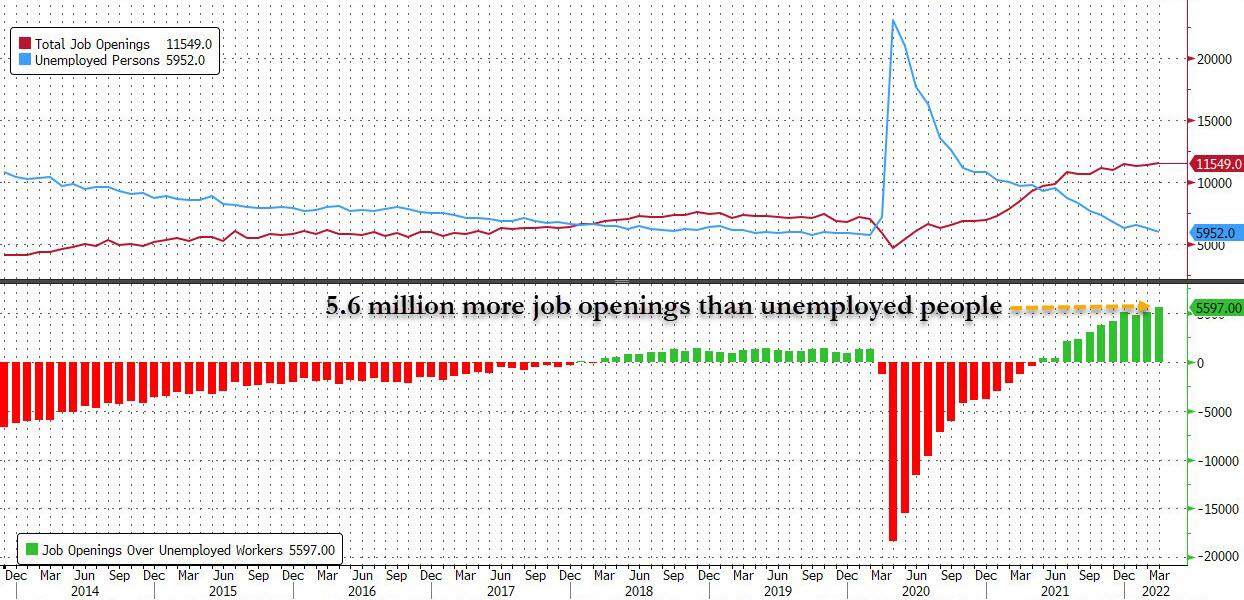
On the economic side, ZH reported that a record number of Americans just quit their job, as Job Openings surpassed unemployed workers by a record 5.6 million causing hedge fund manager Jeff Gundlach to quip:

Now it’s up to the Fed to determine future market direction, which will be based on the aggressiveness with which it will battle the inflation monster.

Read More

Dropping And Popping

Ulli Market Commentary Contact

[Chart courtesy of MarketWatch.com]

  1. Moving the markets

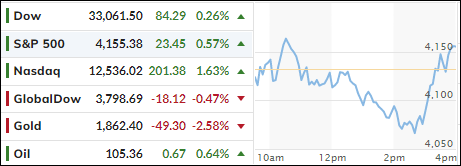
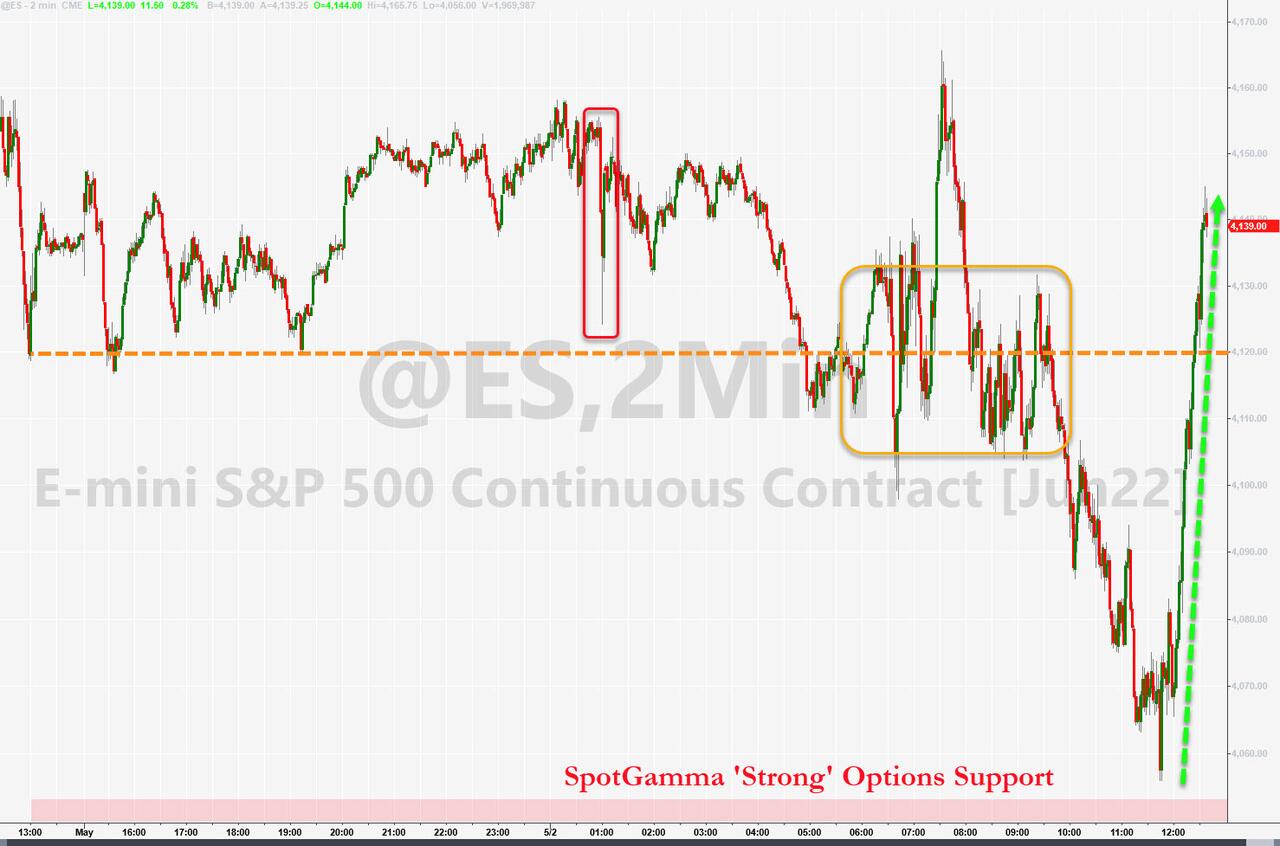
Last week’s downtrend continued during the first trading session of May, as the Dow stumbled some 400 points early on, but a last hour rebound pulled the major indexes out of the doldrums and back into the green.

The S&P 500 fell to new lows for the year, which is viewed as a sign of more weakness to come, before being saved by the afternoon bounce. This index and its compatriot, the Dow, recorded April as being their worst month since March of 2020, which marked the beginning of the pandemic.

The tug-of-war continues between those that see the current setback as an opportunity to buy the dip vs. their opponents, who believe that stocks have further to fall.

Europe’s markets got hammered after a flash-crash in Stockholm gave an assist to the bears, who carried the torch through the regular session with all European indexes ending in the red.

Bonds were the story of the day with yields surging, as the 10-year topped 3% for the first time since December of 2018, after which equities tanked, and the Fed folded like a cheap suit by lowering rates again to prop up the stock market.  

All eyes are on this Wednesday’s Fed meeting on rate increases. Expectations are for a 50-bps hike this week and priced in odds are 25% of a 75-bps hike in June.

Read More
ETFs On The Cutline – Updated Through 04/29/2022

Ulli ETFs on the Cutline Contact

Below, please find the latest High-Volume ETF Cutline report, which shows how far above or below their respective long-term trend lines (39-week SMA) my currently tracked ETFs are positioned.

This report covers the HV ETF Master List from Thursday’s StatSheet and includes 312 High Volume ETFs, defined as those with an average daily volume of more than $5 million, of which currently 54 (last week 80) are hovering in bullish territory. The yellow line separates those ETFs that are positioned above their trend line (%M/A) from those that have dropped below it.

Take a look:                                                                   

The HV ETF Master Cutline Report

In case you are not familiar with some of the terminology used in the reports, please read the Glossary of Terms. If you missed the original post about the Cutline approach, you can read it here.