
- Moving the markets
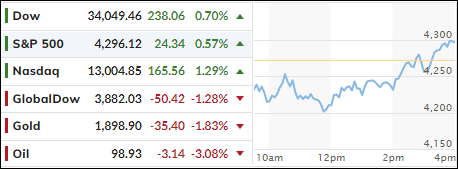
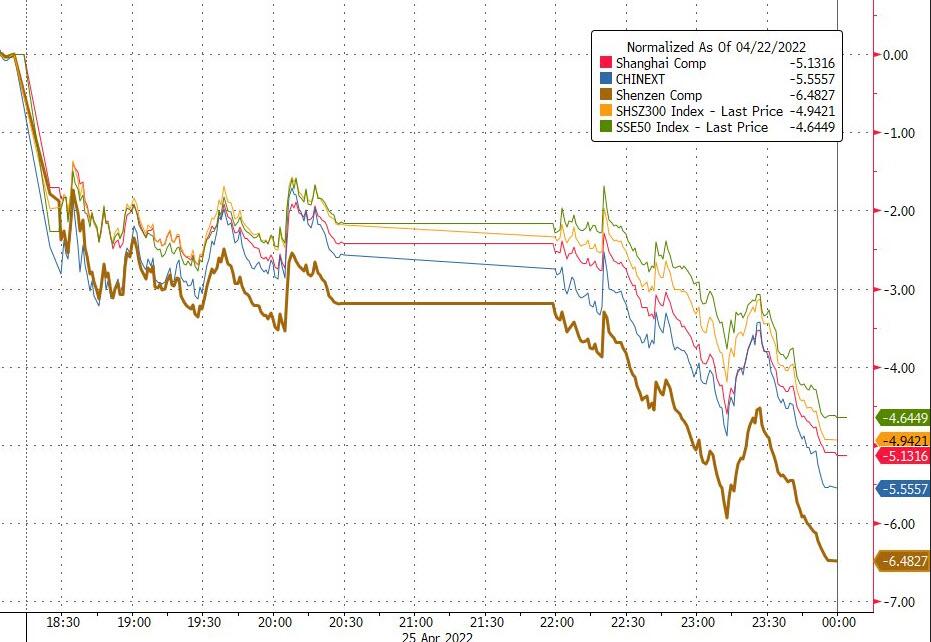
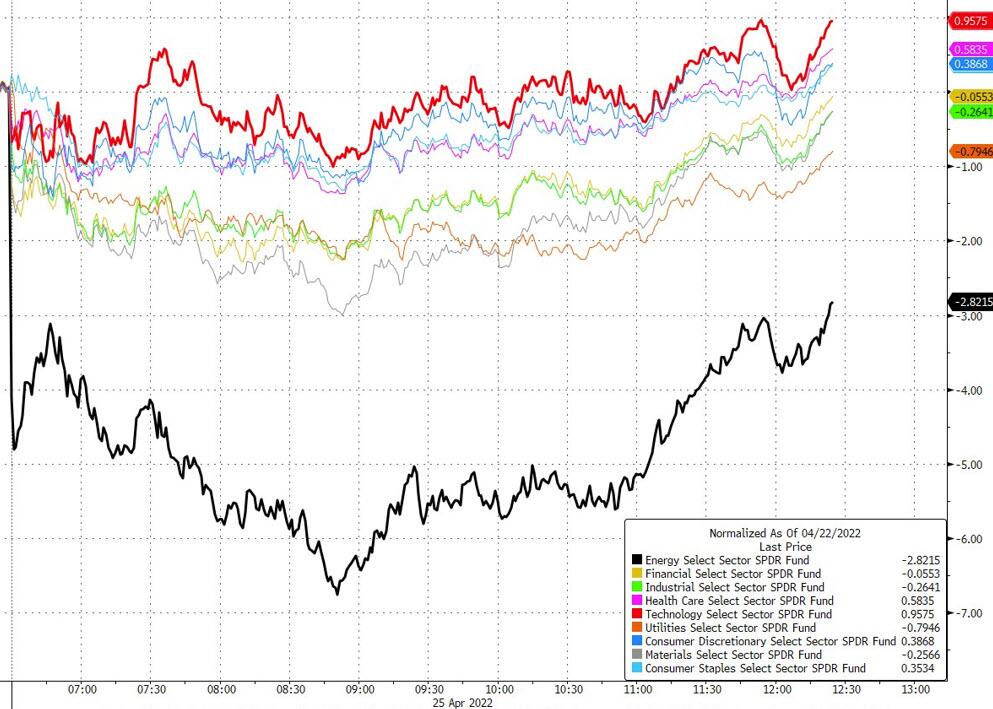
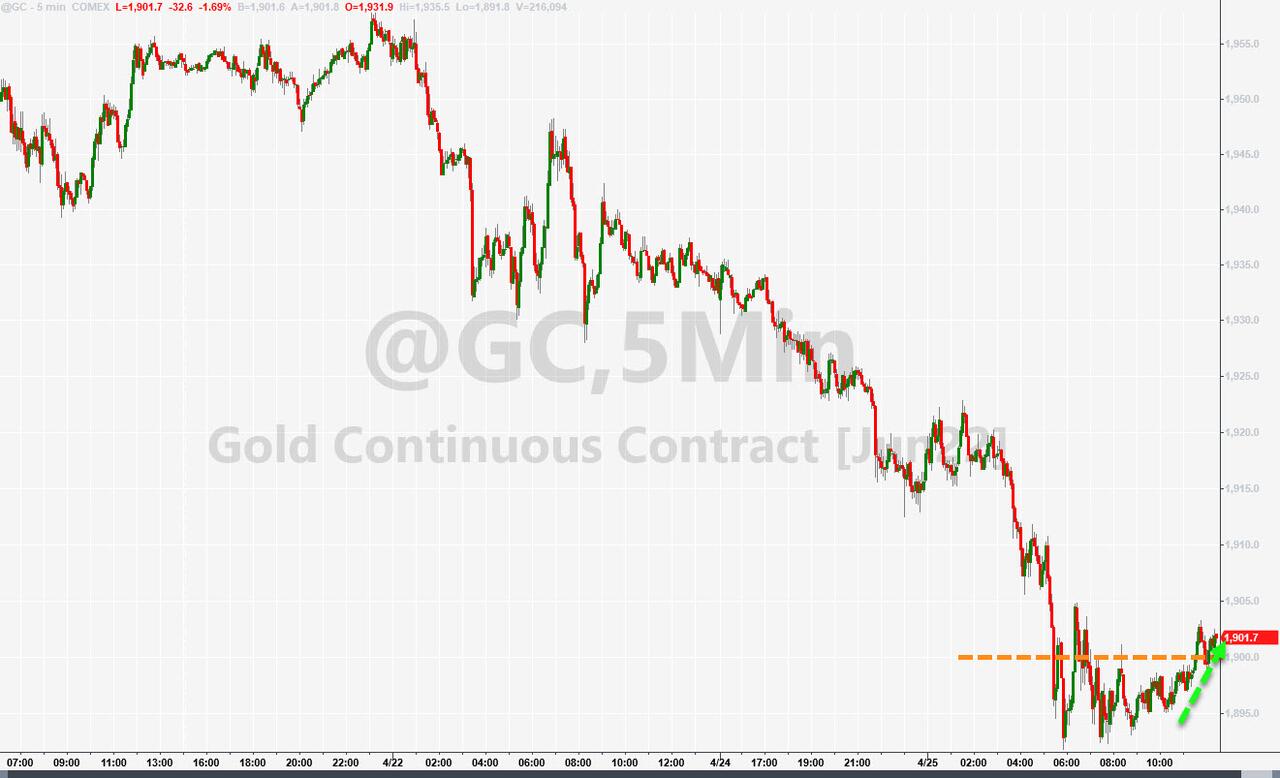
Another early sell off pulled the Dow down by some 400 points, as a one-two punch hit the US markets. Global fears about an economic slowdown loomed large, leading to a slump in Chinese stocks, which pulled energy, commodities, and precious metals off their recent highs—along with all US equities.
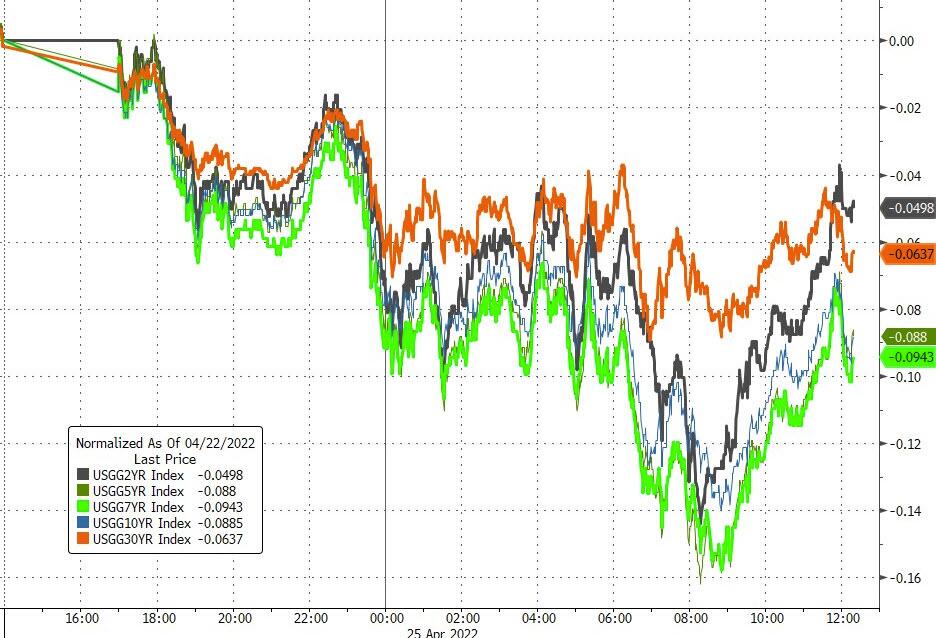
As a result, bond yields cratered for the first time in a while with the widely followed 10-year dropping 7 basis points to close at 2.827%. Uneasiness about this week being a big one for corporate earnings did not help, with about 160 S&P 500 companies scheduled to report and half of the Dow Jones. All eyes are on the big boys like Amazon, Apple, Microsoft, and Alphabet (Google).
Despite the early dump, the markets found some footing and the subsequent reversal sent the Dow up over 200 points into the close. The lead dog was the Nasdaq with a 1.29% gain, which could be just a temporary bounce of hope, as the index has come off its highs by some 20%.
The loser of the day award goes to SmallCaps, which have dropped to their lowest since December 2020 and are currently down 22% from their highs, as ZH pointed out.
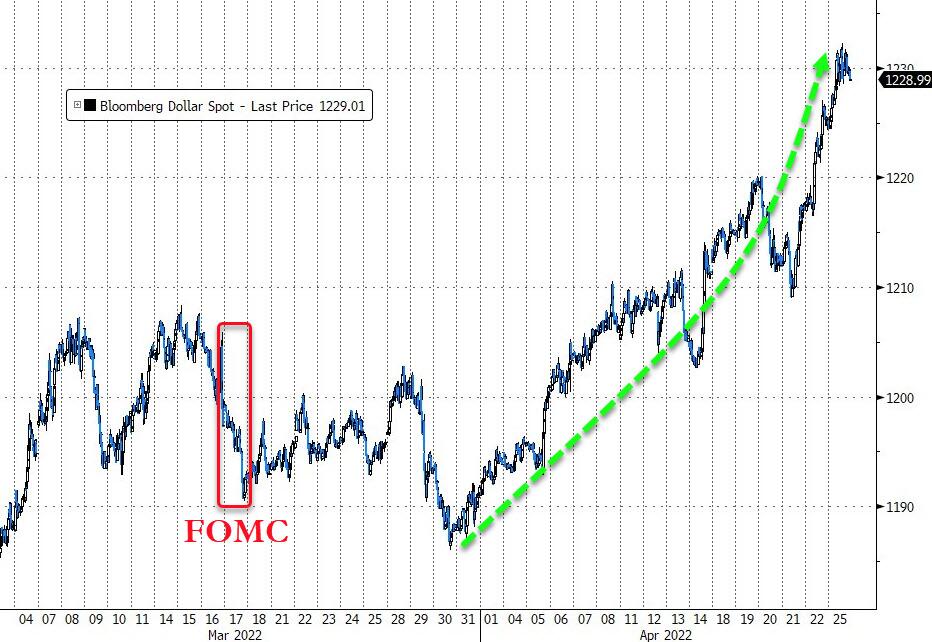
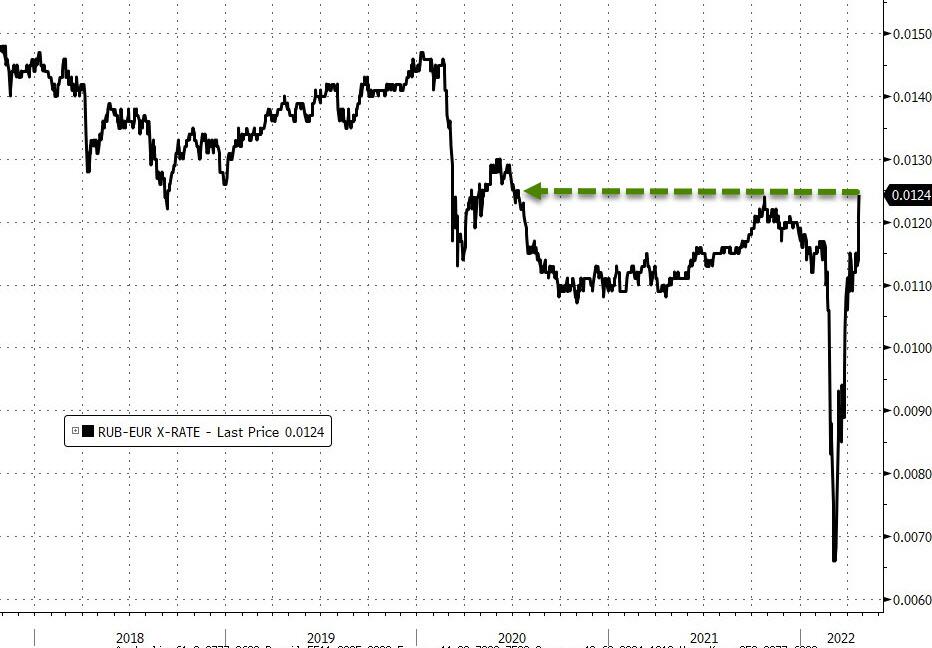
The US Dollar continued its trajectory to higher prices, the Chinese Yuan went the other way, and the Russian Ruble soared to its strongest relative to the Euro in 2 years.
On deck later this week are the latest CPI numbers from countries around the world, which will have an impact on bond yields and equities.
2. ETFs in the Spotlight
In case you missed the announcement and description of this section, you can read it here again.
It features some of the 10 broadly diversified domestic and sector ETFs from my HighVolume list as posted every Saturday. Furthermore, they are screened for the lowest MaxDD% number meaning they have been showing better resistance to temporary sell offs than all others over the past year.
The below table simply demonstrates the magnitude with which these ETFs are fluctuating above or below their respective individual trend lines (%+/-M/A). A break below, represented by a negative number, shows weakness, while a break above, represented by a positive percentage, shows strength.
For hundreds of ETF choices, be sure to reference Thursday’s StatSheet.
For this just closed-out domestic “Buy” cycle, here’s how some of our candidates have fared:
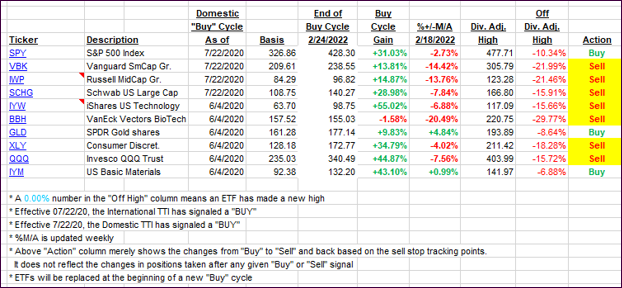
Click image to enlarge.
Again, the %+/-M/A column above shows the position of the various ETFs in relation to their respective long-term trend lines, while the trailing sell stops are being tracked in the “Off High” column. The “Action” column will signal a “Sell” once the -12% point has been taken out in the “Off High” column, which has replaced the prior -8% to -10% limits.
3. Trend Tracking Indexes (TTIs)
Our Domestic TTI recovered slightly from an early dive, as the markets rebounded into the close. The International one showed more weakness and dropped further into bear market territory.
This is how we closed 04/25/2022:
Domestic TTI: -1.55% below its M/A (prior close -1.84%)—Sell signal effective 02/24/2022.
International TTI: -4.56% below its M/A (prior close -3.30%)—Sell signal effective 03/08/2022.
Disclosure: I am obliged to inform you that I, as well as my advisory clients, own some of the ETFs listed in the above table. Furthermore, they do not represent a specific investment recommendation for you, they merely show which ETFs from the universe I track are falling within the specified guidelines.
All linked charts above are courtesy of Bloomberg via ZeroHedge.
Contact Ulli