
- Moving the markets
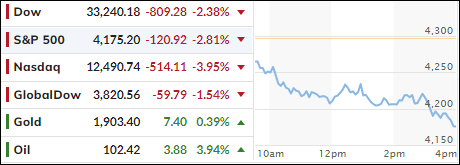
The Nasdaq sustained its recent weakness and plunged some 4% in part due to increasing anxiety ahead of the quarterly earnings reports from the big players like Microsoft and Alphabet (Google) due out this afternoon. The recent Netflix blow-up is still on every trader’s mind.
However, today’s weakness was also assisted by the usual fears, namely the global economy as whole, the Covid surge in China, the war in Ukraine, increasing inflation numbers in the U.S., and the seemingly never-ending supply chain issues.
So far, April has not been kind to domestic equities with the S&P 500 having lost -7.8%, the Nasdaq being down -12.2%, while the Dow fared the best with only a -4.2% drop. This pretty much confirms the bearish position of my Domestic TTI (since 2/24/22), now below its trend line by -3.90%, to either be totally out of domestic equities or only have limited exposure.
And if you thought bonds would have helped to offset some these losses, you would have been wrong, because the widely held 20-year T-Bond ETF TLT lost -7.3% month to date. Ouch! As I posted before, in this high interest rate environment, bonds are no longer a “safe” haven.
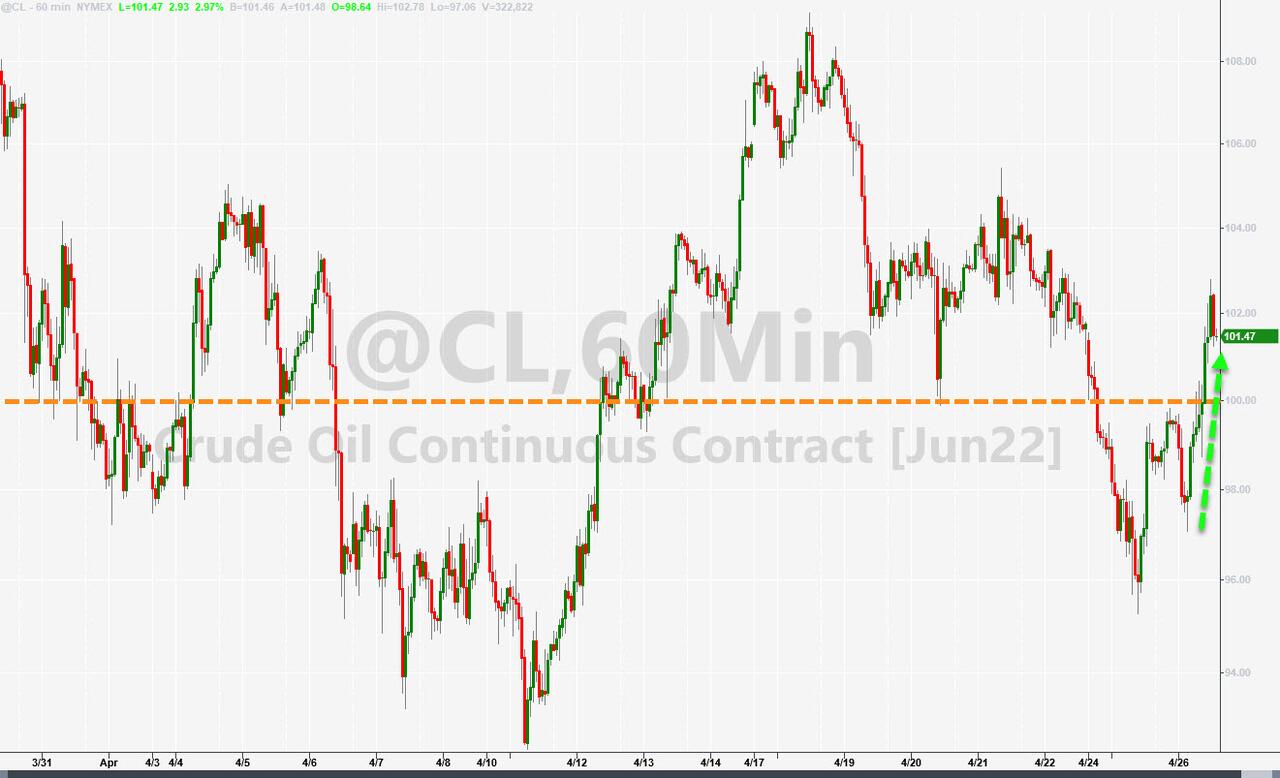
In the end, there were not many places to hide. Energy bounced back nicely but ended the session unchanged. Commodities showed signs of life with DBC adding +1.37%, and gold managed to rebound but only by a meager +0.45%.
When the entire equity spectrum is down considerably, owning some sector ETFs with small gains will substantially mitigate the negative effects of the domestic equity arena.
2. ETFs in the Spotlight
In case you missed the announcement and description of this section, you can read it here again.
It features some of the 10 broadly diversified domestic and sector ETFs from my HighVolume list as posted every Saturday. Furthermore, they are screened for the lowest MaxDD% number meaning they have been showing better resistance to temporary sell offs than all others over the past year.
The below table simply demonstrates the magnitude with which these ETFs are fluctuating above or below their respective individual trend lines (%+/-M/A). A break below, represented by a negative number, shows weakness, while a break above, represented by a positive percentage, shows strength.
For hundreds of ETF choices, be sure to reference Thursday’s StatSheet.
For this just closed-out domestic “Buy” cycle, here’s how some of our candidates have fared:
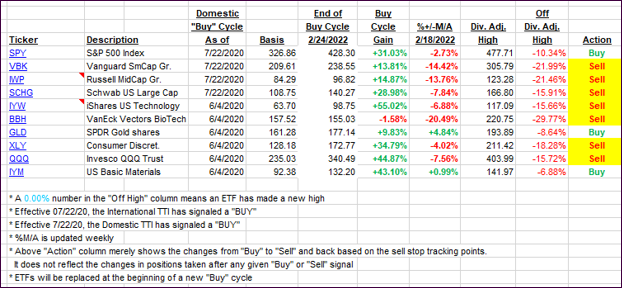
Click image to enlarge.
Again, the %+/-M/A column above shows the position of the various ETFs in relation to their respective long-term trend lines, while the trailing sell stops are being tracked in the “Off High” column. The “Action” column will signal a “Sell” once the -12% point has been taken out in the “Off High” column, which has replaced the prior -8% to -10% limits.
3. Trend Tracking Indexes (TTIs)
Both of our TTIs plunged with the broad equity market and solidified their positions below their respective trend lines in bear market territory.
This is how we closed 04/26/2022:
Domestic TTI: -3.90% below its M/A (prior close -1.55%)—Sell signal effective 02/24/2022.
International TTI: -6.08% below its M/A (prior close -4.56%)—Sell signal effective 03/08/2022.
Disclosure: I am obliged to inform you that I, as well as my advisory clients, own some of the ETFs listed in the above table. Furthermore, they do not represent a specific investment recommendation for you, they merely show which ETFs from the universe I track are falling within the specified guidelines.
All linked charts above are courtesy of Bloomberg via ZeroHedge.
Contact Ulli