
- Moving the markets
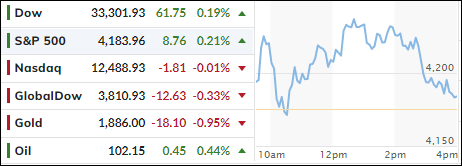
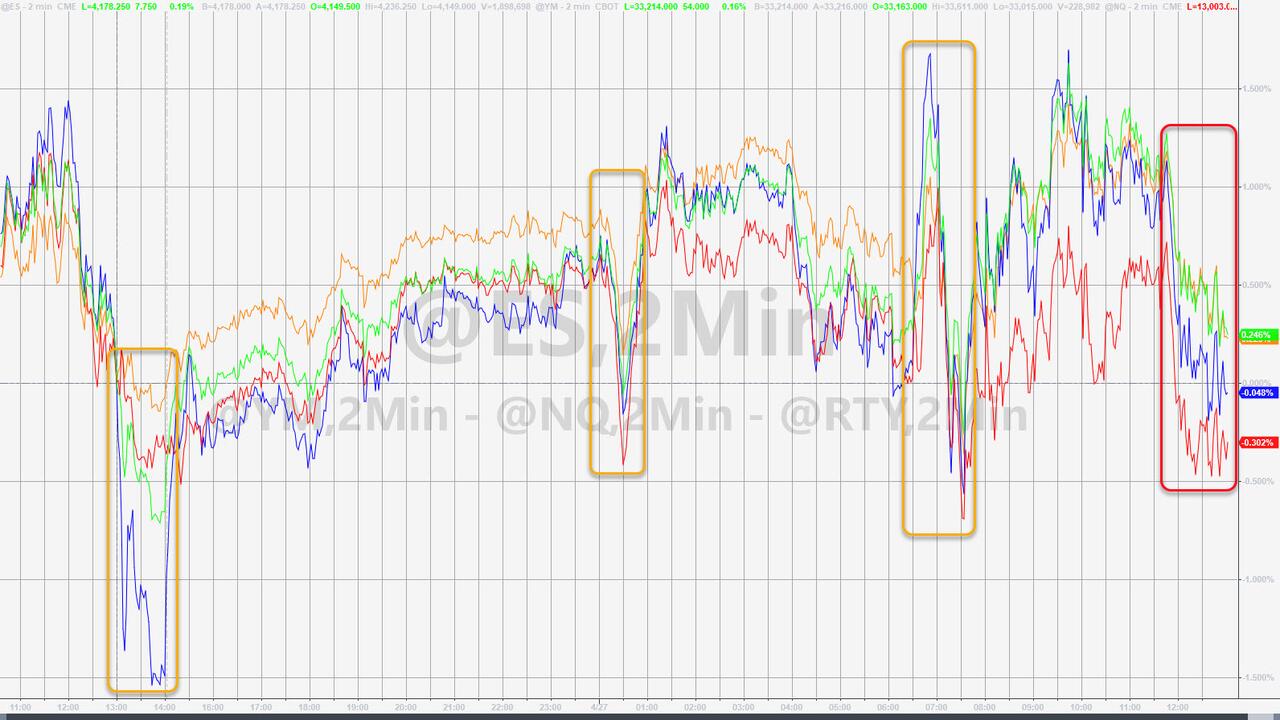
Despite dip buyers stepping in this morning, to take advantage of lower prices caused by yesterday’s drubbing, the effort peaked mid-day, after which the selling resumed with the major indexes ending up only a tad above their respective unchanged lines.
The Nasdaq has now dropped some 12% in April, which is its worst performance since October 2008, with the S&P 500 and Dow being down as well but to a lesser magnitude.
Headwinds increased for equities this month, as uncertainty reigned due a variety of uncontrollable events—like inflation, Fed tightening, the war in Ukraine, and China’s zero-covid policy lockdowns—combining forces and giving the bears the upper hand.
Since my Domestic Trend Tracking Index (TTI) signaled a sell of domestic equities on 2/24/22, we’ve seen strong rebounds at first, however, they have lately turned into a bearish rut. As of today, our TTI hovers -3.72% below its long-term trend line (section 3).
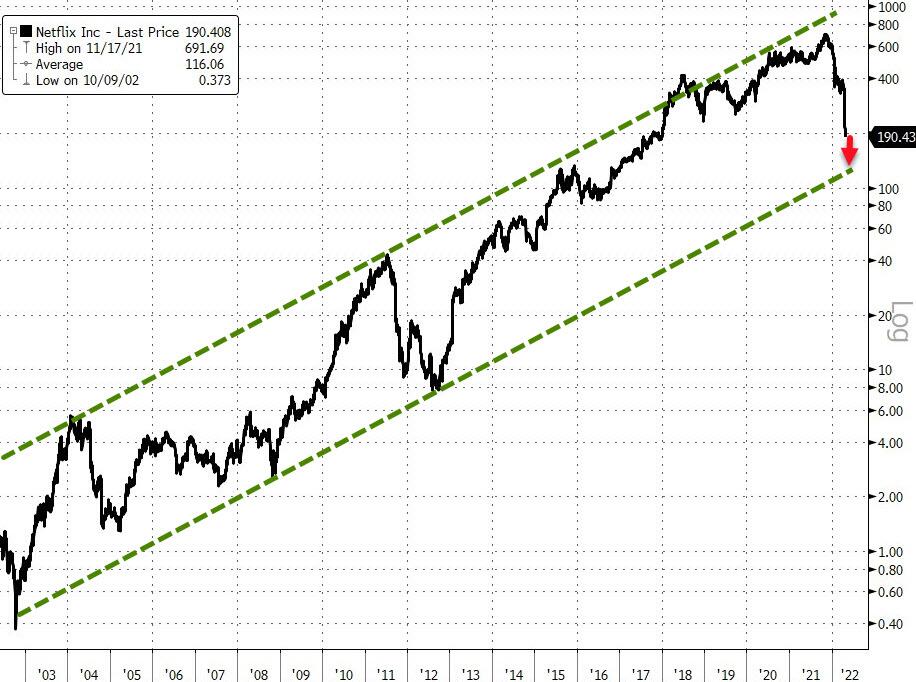
As ZH pointed out, the FANG stocks puked again and have now reached a critical support level from right before the Covid crash, while Netflix still has a long ways to go to find any technical support at all.
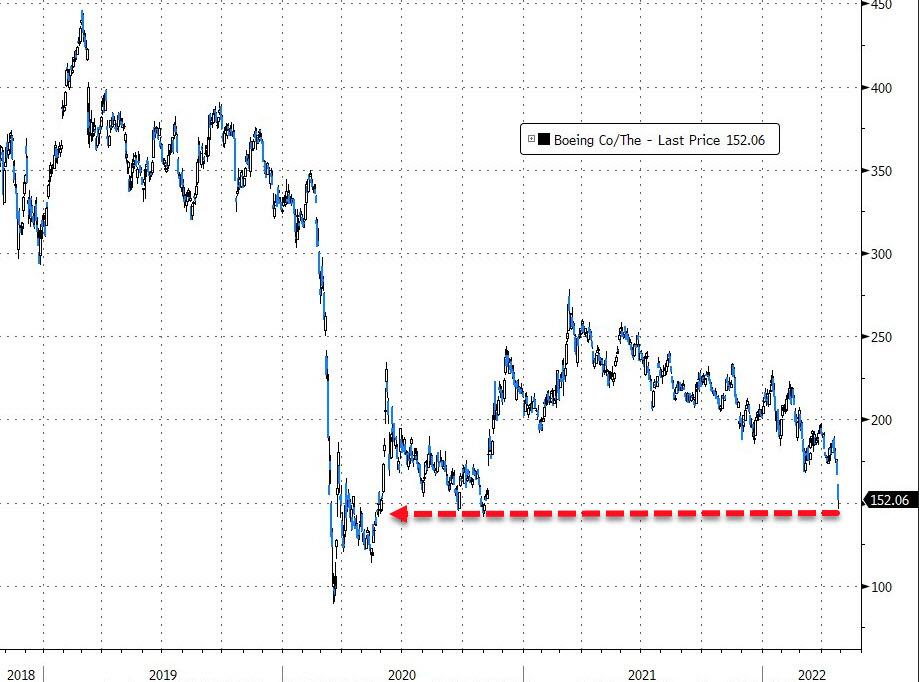
Boeing got hammered as well and has now reached a price level last seen in June 2020. Bond yields, which had weakened yesterday, came back and stormed higher with the 10-year gaining over 10 bps to close at 2.835%.
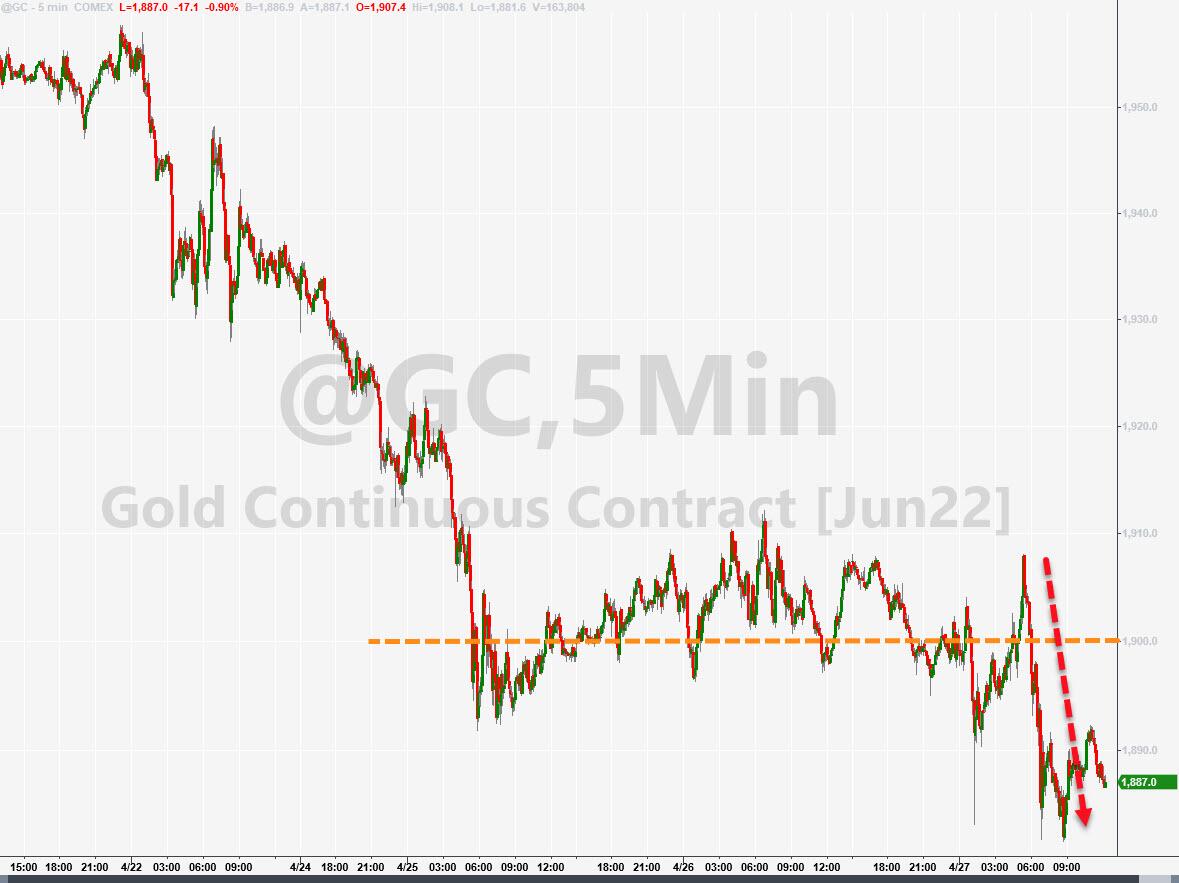
The energy and commodity sectors rose, while Gold dropped and lost its $1,900 level again.
2. ETFs in the Spotlight
In case you missed the announcement and description of this section, you can read it here again.
It features some of the 10 broadly diversified domestic and sector ETFs from my HighVolume list as posted every Saturday. Furthermore, they are screened for the lowest MaxDD% number meaning they have been showing better resistance to temporary sell offs than all others over the past year.
The below table simply demonstrates the magnitude with which these ETFs are fluctuating above or below their respective individual trend lines (%+/-M/A). A break below, represented by a negative number, shows weakness, while a break above, represented by a positive percentage, shows strength.
For hundreds of ETF choices, be sure to reference Thursday’s StatSheet.
For this just closed-out domestic “Buy” cycle, here’s how some of our candidates have fared:
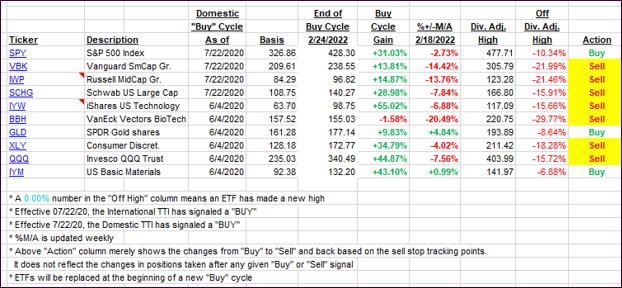
Click image to enlarge.
Again, the %+/-M/A column above shows the position of the various ETFs in relation to their respective long-term trend lines, while the trailing sell stops are being tracked in the “Off High” column. The “Action” column will signal a “Sell” once the -12% point has been taken out in the “Off High” column, which has replaced the prior -8% to -10% limits.
3. Trend Tracking Indexes (TTIs)
Our TTIs diverged with the International dropping further, while the Domestic one recovered at tad. Both are still positioned in bear market territory.
This is how we closed 04/27/2022:
Domestic TTI: -3.72% below its M/A (prior close -3.90%)—Sell signal effective 02/24/2022.
International TTI: -6.30% below its M/A (prior close -6.08%)—Sell signal effective 03/08/2022.
Disclosure: I am obliged to inform you that I, as well as my advisory clients, own some of the ETFs listed in the above table. Furthermore, they do not represent a specific investment recommendation for you, they merely show which ETFs from the universe I track are falling within the specified guidelines.
All linked charts above are courtesy of Bloomberg via ZeroHedge.
Contact Ulli