
ETF Tracker StatSheet
You can view the latest version here.
RED APRIL
- Moving the markets
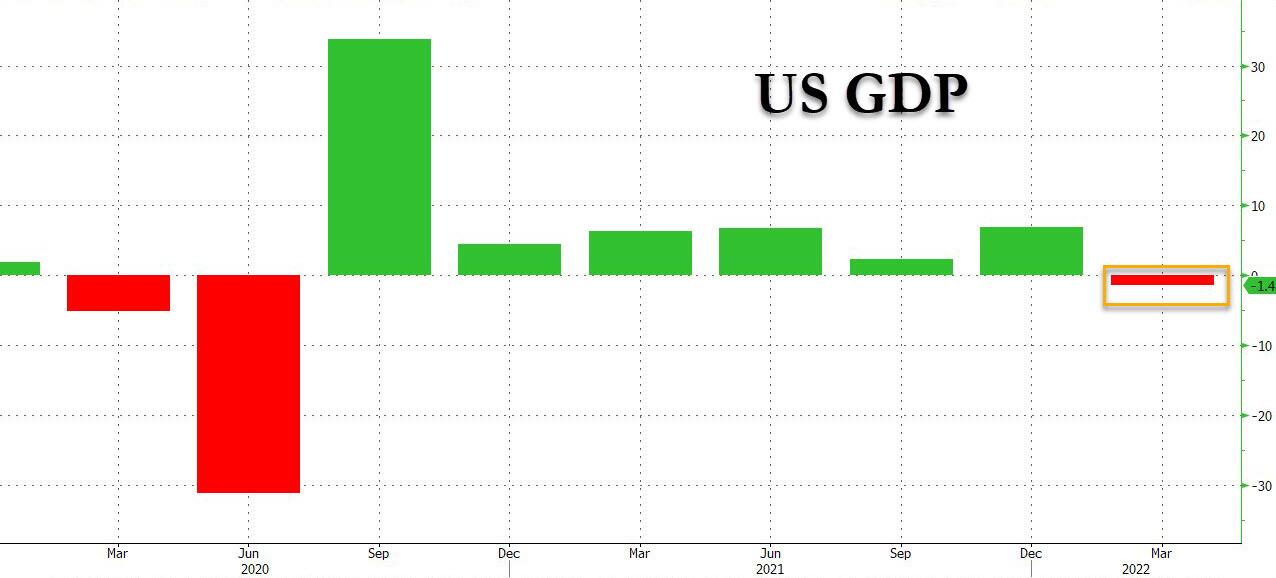
Despite the shocking negative first quarter GDP reading of -1.4% (annually), the markets managed to string together a MegaLiftathon on Thursday, but today’s reality check pulled the indexes back down below where they started yesterday. So much for buying the dips.
More than yesterday’s gains were given back today, and we’re now staring into the abyss of a bear market for domestic equities, the signal of which was initially generated by our Domestic Trend Tracking Index (TTI) back on 2/24/22. We’ve seen a lot of bounce backs since but, as of this moment, the bears are clearly having the upper hand.
After yesterday’s close, tech powerhouse Amazon shocked the investing community via a dismal outlook and a rise in operating costs, which pulled its stock down some -12%, a performance that was outdone today, as the company stock dropped another -14%. Ouch!
How bad was this month? MarketWatch summed it up like this:
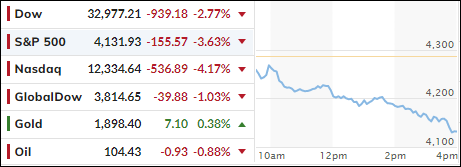
The Nasdaq is down around 12%, on pace for its worst monthly performance since October 2008 in the throngs of the financial crisis. The S&P 500 is down more than 7%, its worst month since March 2020 at the onset of the Covid pandemic. The Dow is off by nearly 4% for the month.
The Nasdaq Composite sits in bear market territory, roughly 24% below its intraday high. The S&P 500 is off its record by more than 14% and the Dow is nearly 11% lower.
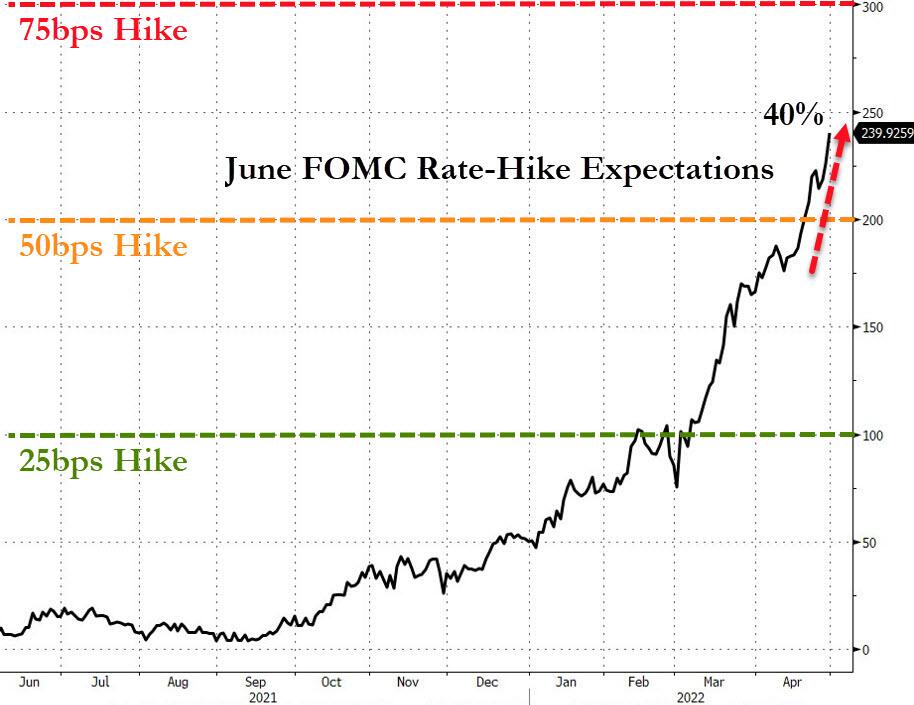
Rate hike expectations went vertical, with ZH pointing out that a 50-bps hike next week appears to be a done deal with odds of a potential 75-bps hike now being 50%. If that materializes, it would be the first 75-bps hike since 1994.
Hmm, I wonder if the markets are prepared for that?
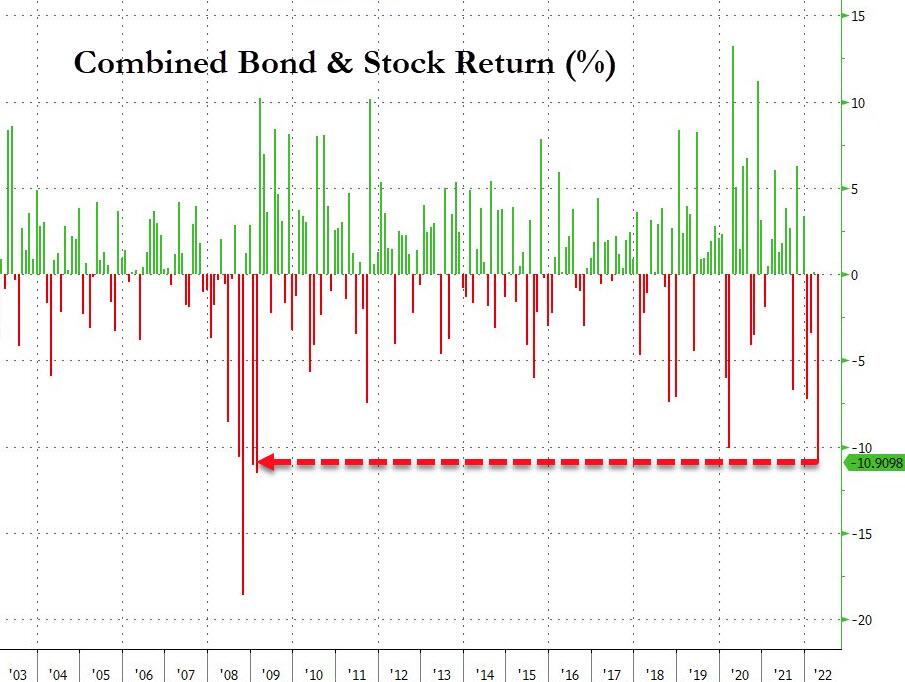
Bonds got clobbered during April as well with yields spiking across the board, as the widely-held 20-year bond ETF TLT lost -7.43%, which pretty much matched the S&P 500 “performance.” So much for the perceived security of bonds during a stock market meltdown. As a result, April turned out to be the worst month for a stock/bond portfolio since February 2009.
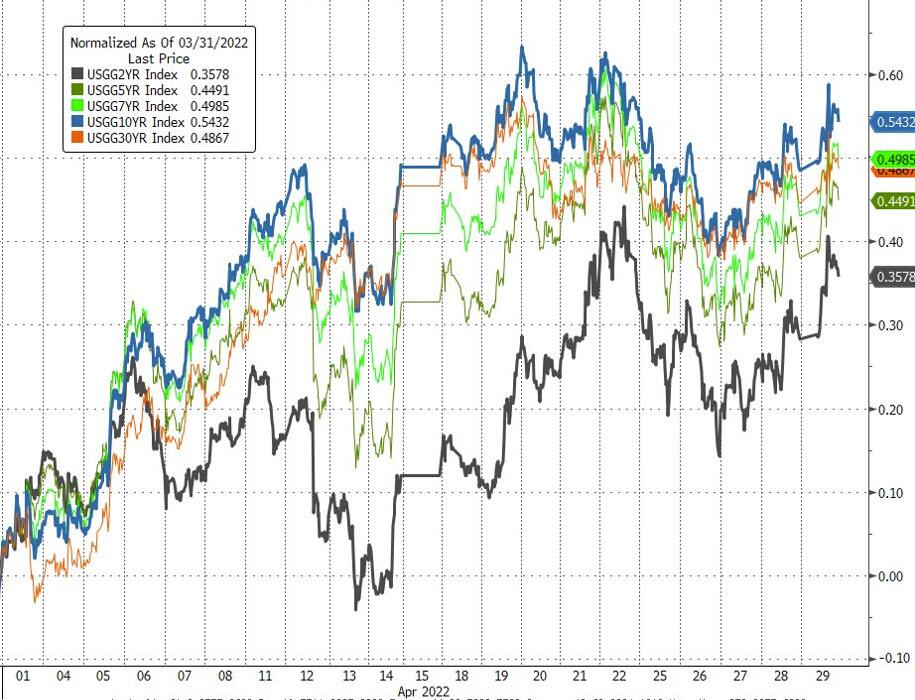
The beneficiary of all this turmoil was the US Dollar when measured vs. its fiat peers, as it jumped 5% and traded at its highest in 20 years, as ZH remarked. The same can’t be said for the Chinese Yuan, which saw its biggest monthly drop against the dollar since 1994.
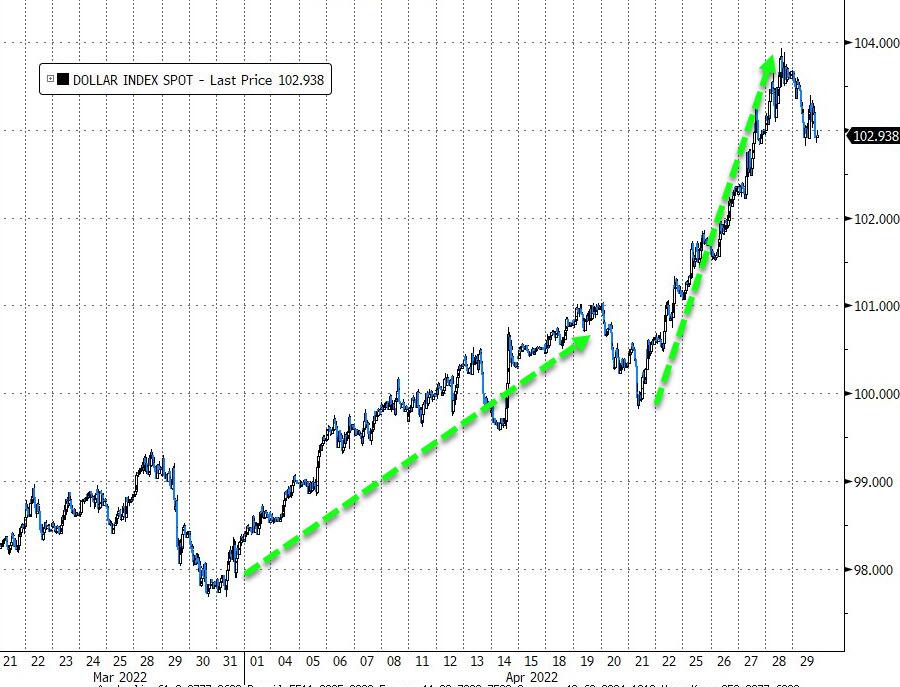
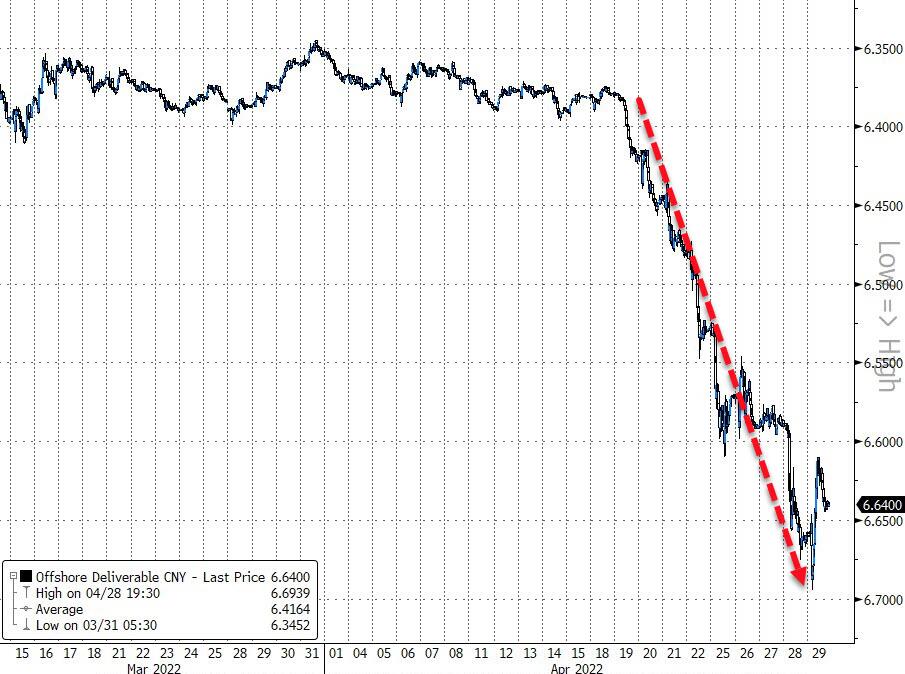
Gold was pretty much flat, which is better than down, and it ended the month just around its $1,900 level.
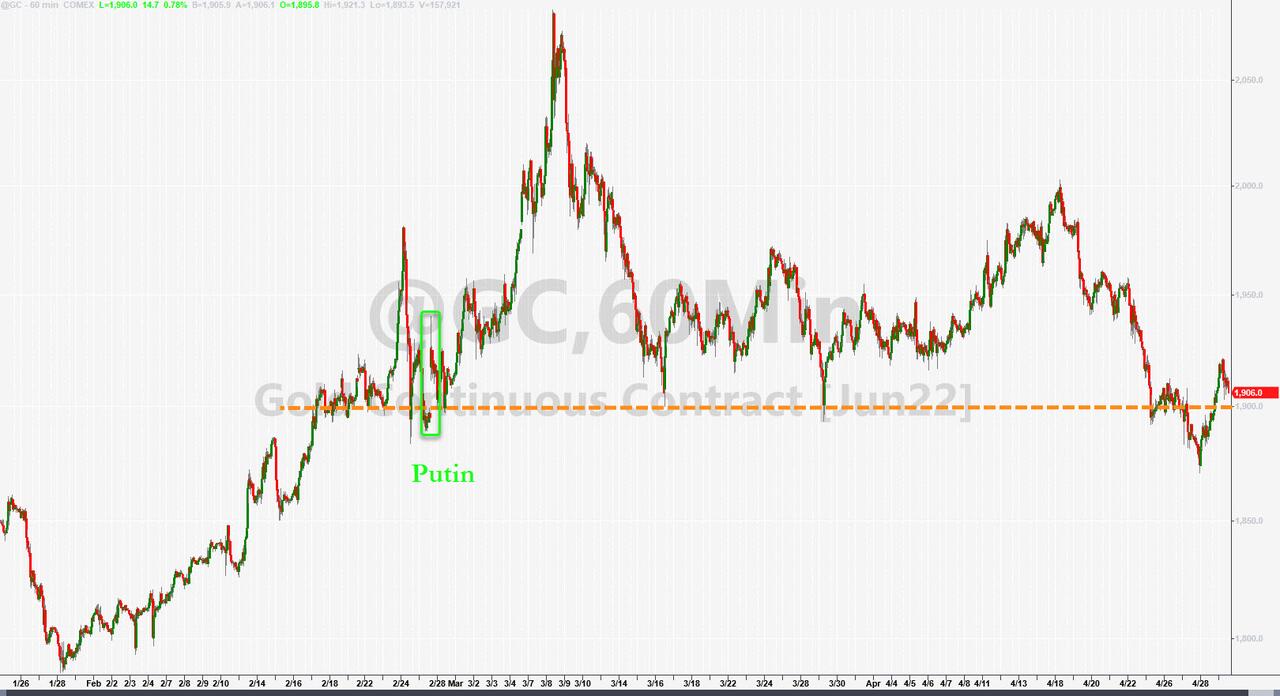
All this leaves me pondering: “Will Fed head Powell step up to “save” the markets again, or will he seriously fight potential hyper-inflation and save humanity?”
2. ETFs in the Spotlight
In case you missed the announcement and description of this section, you can read it here again.
It features some of the 10 broadly diversified domestic and sector ETFs from my HighVolume list as posted every Saturday. Furthermore, they are screened for the lowest MaxDD% number meaning they have been showing better resistance to temporary sell offs than all others over the past year.
The below table simply demonstrates the magnitude with which these ETFs are fluctuating above or below their respective individual trend lines (%+/-M/A). A break below, represented by a negative number, shows weakness, while a break above, represented by a positive percentage, shows strength.
For hundreds of ETF choices, be sure to reference Thursday’s StatSheet.
For this just closed-out domestic “Buy” cycle, here’s how some of our candidates have fared:
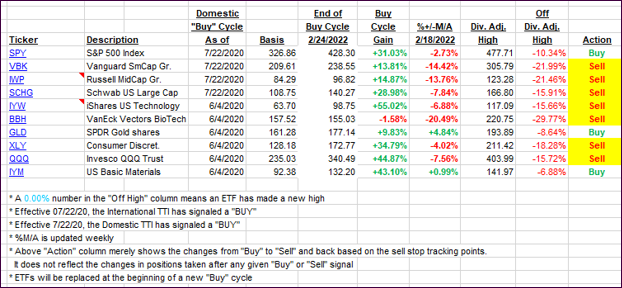
Click image to enlarge.
Again, the %+/-M/A column above shows the position of the various ETFs in relation to their respective long-term trend lines, while the trailing sell stops are being tracked in the “Off High” column. The “Action” column will signal a “Sell” once the -12% point has been taken out in the “Off High” column, which has replaced the prior -8% to -10% limits.
3. Trend Tracking Indexes (TTIs)
Our TTIs plunged, as the broad market got spanked with the Dow losing almost 1,000 points. We are now deeply entrenched in bear market territory and will continue to concentrate on specific sector ETFs, which will benefit from the current economic upheaval.
This is how we closed 04/29/2022:
Domestic TTI: -4.97% below its M/A (prior close -2.05%)—Sell signal effective 02/24/2022.
International TTI: -6.12% below its M/A (prior close -5.21%)—Sell signal effective 03/08/2022.
Disclosure: I am obliged to inform you that I, as well as my advisory clients, own some of the ETFs listed in the above table. Furthermore, they do not represent a specific investment recommendation for you, they merely show which ETFs from the universe I track are falling within the specified guidelines.
All linked charts above are courtesy of Bloomberg via ZeroHedge.
———————————————————-
WOULD YOU LIKE TO HAVE YOUR INVESTMENTS PROFESSIONALLY MANAGED?
Do you have the time to follow our investment plans yourself? If you are a busy professional who would like to have his portfolio managed using our methodology, please contact me directly or get more details.
Contact Ulli