
- Moving the markets
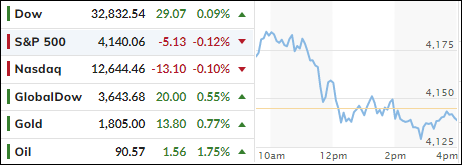
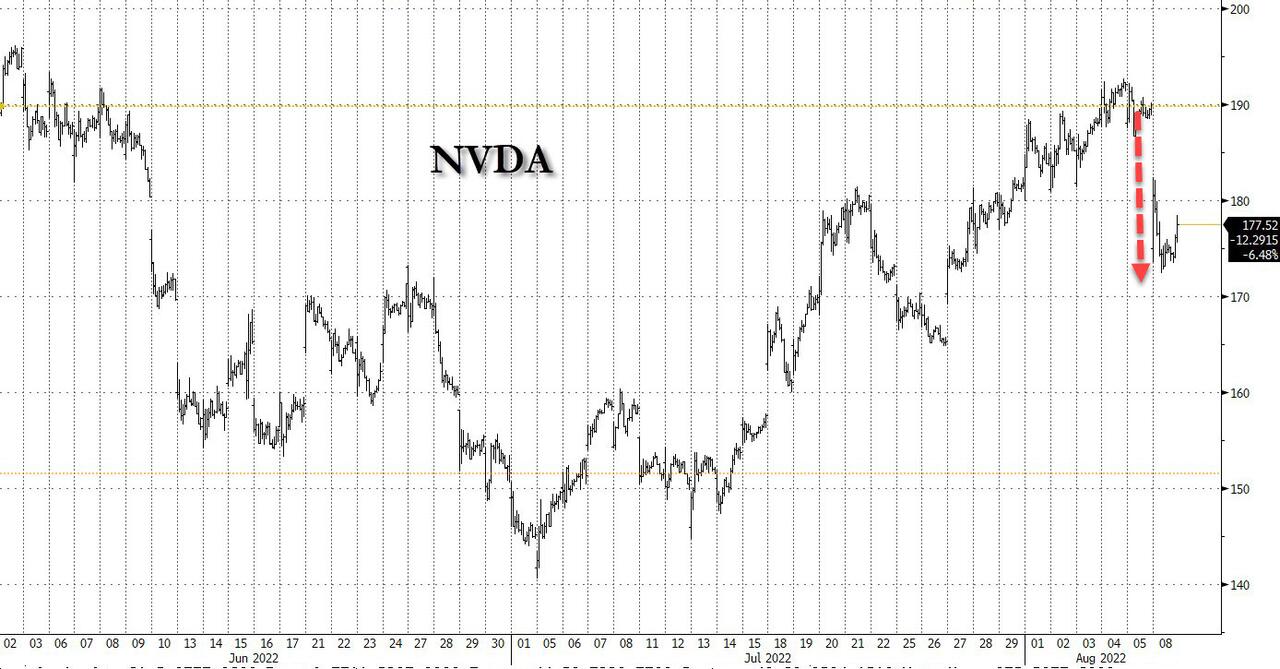
An early rally of some 260 points in the Dow bit the dust, as questions about future demand in the semiconductor industry spoiled the party. Nvidia’s unexpected earnings preannouncement and guidance pulled the stock down by some 8% and cast questions on rival stocks as well.
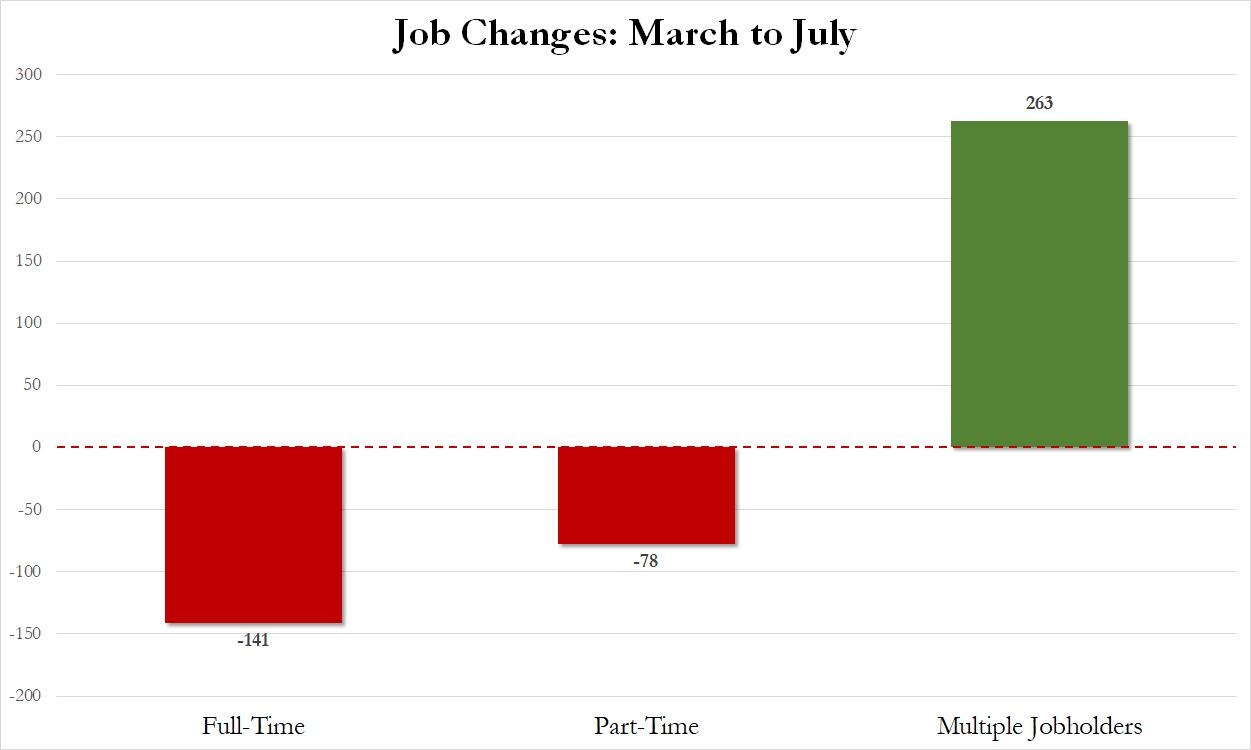
After having had a chance of looking under the hood of last week’s strong labor report, it turns out that some of these numbers are simply not what headline news indicated, but that the true jobs gains are lower, as an increase in multiple job holders distorted the true job growth picture.
Additionally, the reality has set in that the Fed and its mouthpieces have been very clear about their intention of fighting inflation, which means, we are still in a bear market rally with the much hoped-for “low interest rate pivot,” which formed the basis of last month’s rally, nowhere in sight.
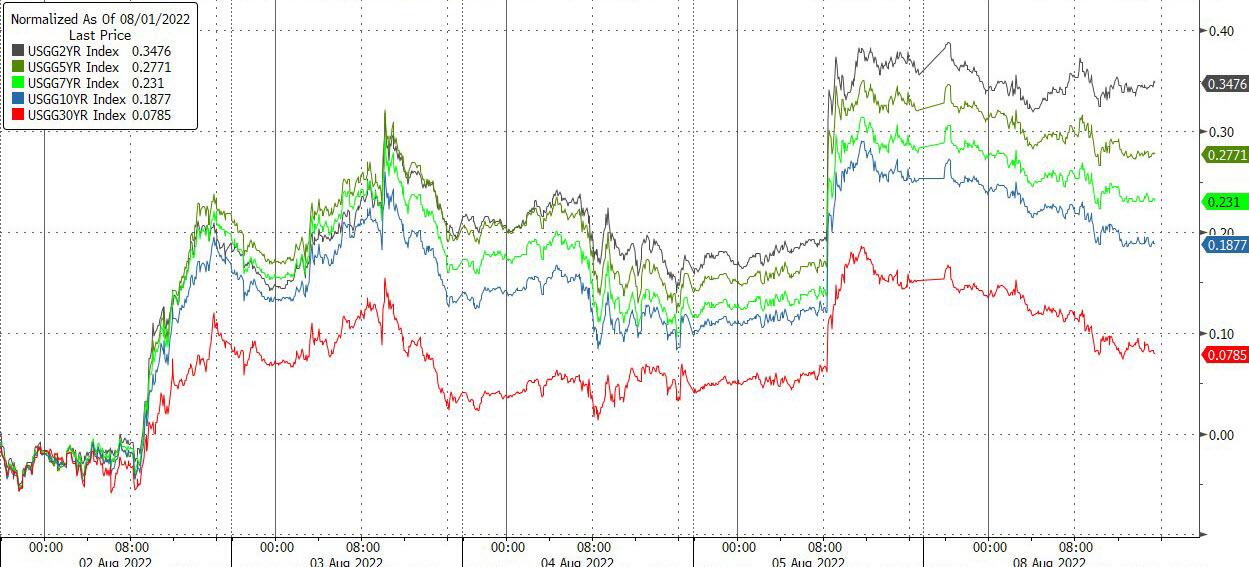
Bond yields slipped, as anxiety over Wednesday’s CPI print created even more hesitation, despite expectations being of a “less hot” reading, but nobody can be sure. However, it will give some clarification as to what the Central Bank’s next move will be, when they meet in September.
2. ETFs in the Spotlight
In case you missed the announcement and description of this section, you can read it here again.
It features some of the 10 broadly diversified domestic and sector ETFs from my HighVolume list as posted every Saturday. Furthermore, they are screened for the lowest MaxDD% number meaning they have been showing better resistance to temporary sell offs than all others over the past year.
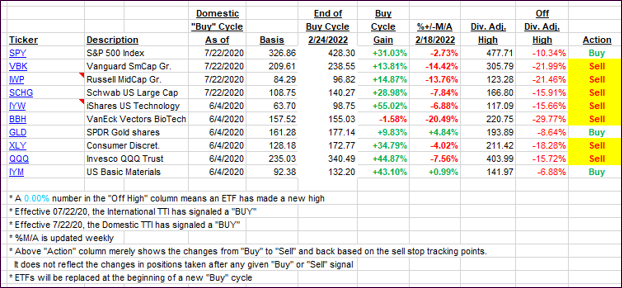
The below table simply demonstrates the magnitude with which these ETFs are fluctuating above or below their respective individual trend lines (%+/-M/A). A break below, represented by a negative number, shows weakness, while a break above, represented by a positive percentage, shows strength.
For hundreds of ETF choices, be sure to reference Thursday’s StatSheet.
For this closed-out domestic “Buy” cycle (2/24/2022), here’s how some of our candidates have fared. Keep in mind that our Domestic Trend Tracking Index (TTI) signaled a “Sell” on that date, which overrode the existing “Buys” shown for SPY and IYM:
Click image to enlarge.
Again, the %+/-M/A column above shows the position of the various ETFs in relation to their respective long-term trend lines, while the trailing sell stops are being tracked in the “Off High” column. The “Action” column will signal a “Sell” once the -12% point has been taken out in the “Off High” column, which has replaced the prior -8% to -10% limits.
3. Trend Tracking Indexes (TTIs)
Our TTIs improved a bit, but the markets turned out to be directionless.
This is how we closed 08/08/2022:
Domestic TTI: -2.49% below its M/A (prior close -2.76%)—Sell signal effective 02/24/2022.
International TTI: -7.03% below its M/A (prior close -7.50%)—Sell signal effective 03/08/2022.
Disclosure: I am obliged to inform you that I, as well as my advisory clients, own some of the ETFs listed in the above table. Furthermore, they do not represent a specific investment recommendation for you, they merely show which ETFs from the universe I track are falling within the specified guidelines.
All linked charts above are courtesy of Bloomberg via ZeroHedge.
Contact Ulli