
- Moving the markets
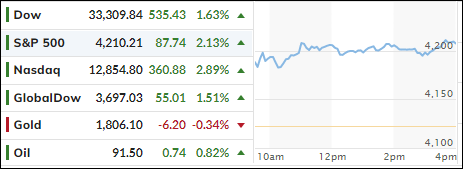
After the anticipated arrival of today’s CPI, which came in at 8.5% YoY, vs. an expected increase of 8.5%, the markets jumped with the Dow gaining some 500 points, a level we closed at.
The bullish ramp showed no weakness during the session, as traders were relieved that the Fed may now back away from its hawkish stance of maintaining the higher rate path. If we continue to see declining inflation prints, the Fed could very well begin to slow the pace of monetary tightening with a Fed pivot eventually taking place.
This assumes that inflation has peaked, which is just as incorrect as the Fed insisting all last year that inflation was transitory. I think the inflation monster has not even been unleashed so far and worse is yet to come. As one analyst so succinctly posted regarding this current CPI reading:
Remember that one month does not make a trend. But also remember that every trend starts with one month.
To me it means, that this July print could be just an outlier, but only time will tell if this is accurate. Unfortunately, real average weekly earnings continue to plunge, as ZeroHedge pointed out, now down 16 straight months, as inflation eats away any wage gains.
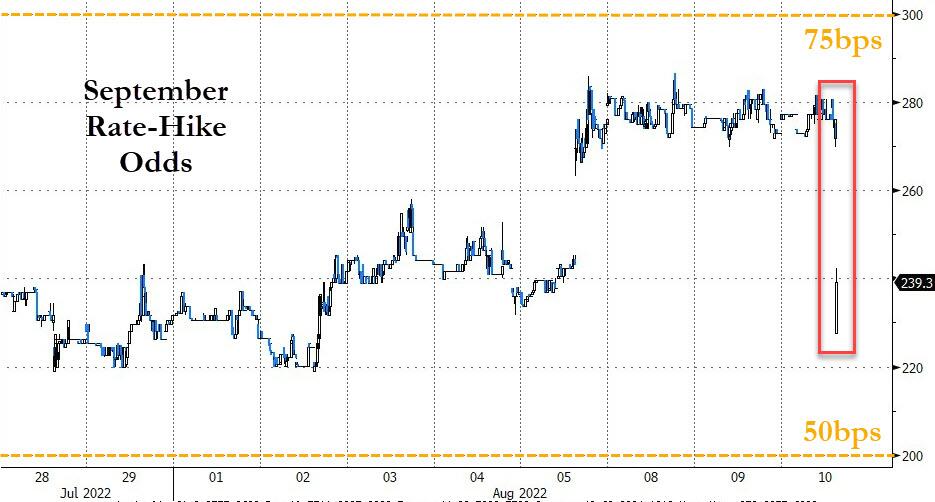
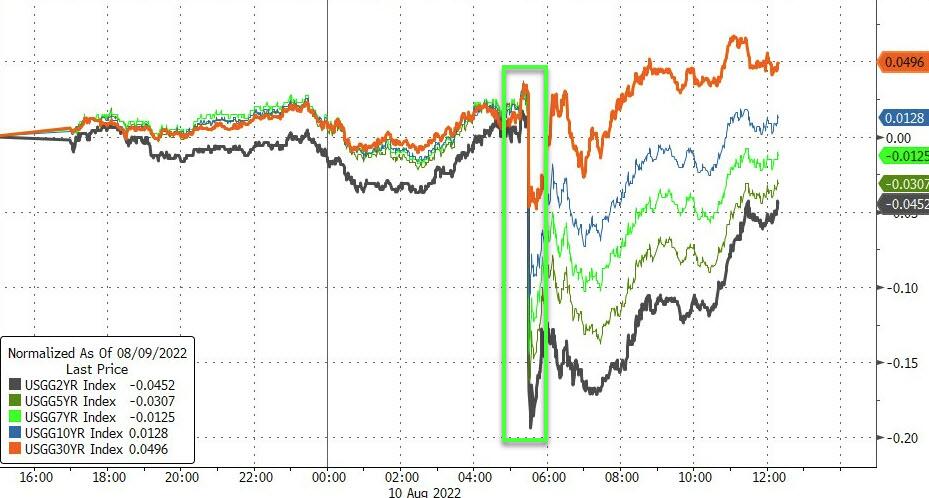
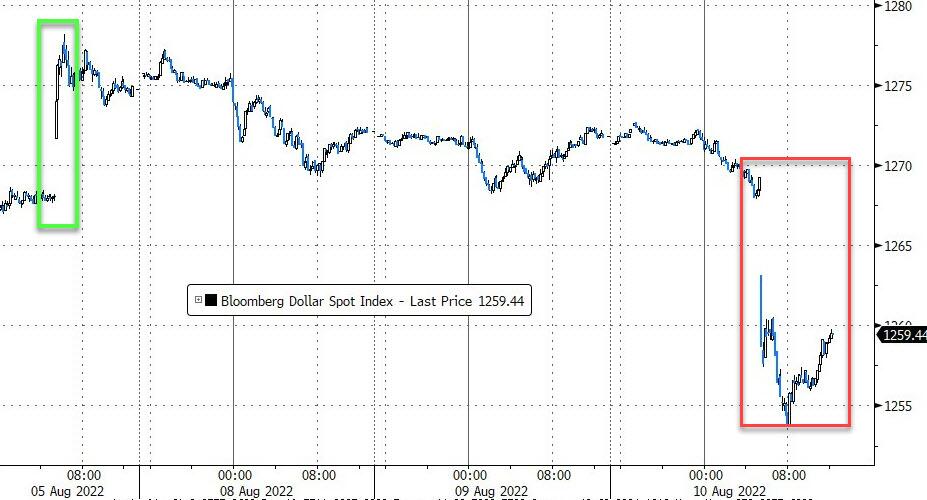
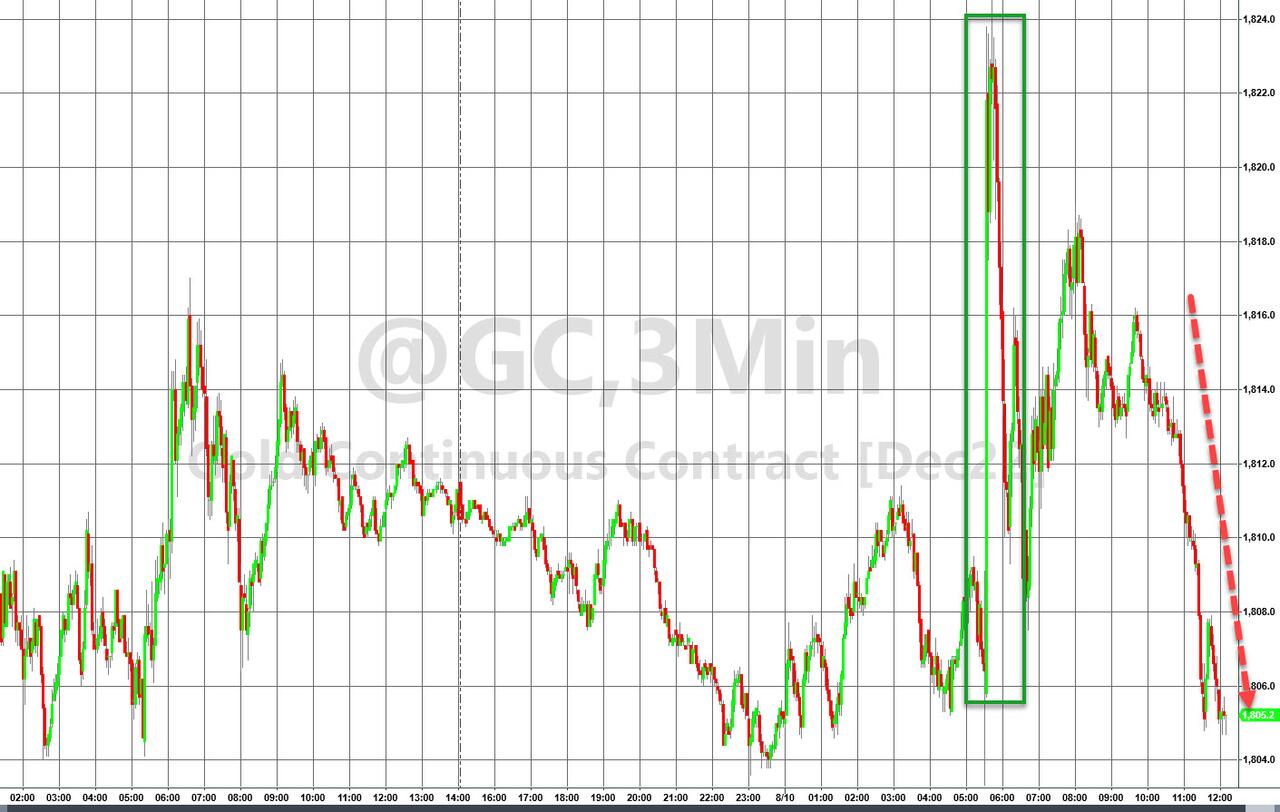
As a result, rate hike odds tumbled instantly, bond yields dipped and ripped with the US Dollar diving and commodities thriving. Gold spiked but gave back some of its early gains yet managed to defend the $1,800 level successfully.
Our Trend Tracking Index (TTI, section 3) befitted as well and has now crawled within striking distance of a new Buy signal.
2. ETFs in the Spotlight
In case you missed the announcement and description of this section, you can read it here again.
It features some of the 10 broadly diversified domestic and sector ETFs from my HighVolume list as posted every Saturday. Furthermore, they are screened for the lowest MaxDD% number meaning they have been showing better resistance to temporary sell offs than all others over the past year.
The below table simply demonstrates the magnitude with which these ETFs are fluctuating above or below their respective individual trend lines (%+/-M/A). A break below, represented by a negative number, shows weakness, while a break above, represented by a positive percentage, shows strength.
For hundreds of ETF choices, be sure to reference Thursday’s StatSheet.
For this closed-out domestic “Buy” cycle (2/24/2022), here’s how some of our candidates have fared. Keep in mind that our Domestic Trend Tracking Index (TTI) signaled a “Sell” on that date, which overrode the existing “Buys” shown for SPY and IYM:
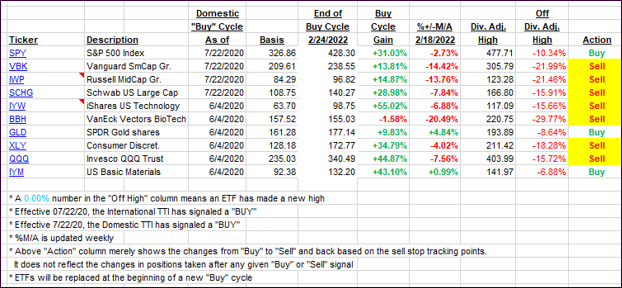
Click image to enlarge.
Again, the %+/-M/A column above shows the position of the various ETFs in relation to their respective long-term trend lines, while the trailing sell stops are being tracked in the “Off High” column. The “Action” column will signal a “Sell” once the -12% point has been taken out in the “Off High” column, which has replaced the prior -8% to -10% limits.
3. Trend Tracking Indexes (TTIs)
Our TTIs rallied with especially the Domestic one approaching a possible trend line break to the upside.
This is how we closed 08/10/2022:
Domestic TTI: -0.98% below its M/A (prior close -3.05%)—Sell signal effective 02/24/2022.
International TTI: -5.66% below its M/A (prior close -7.11%)—Sell signal effective 03/08/2022.
Disclosure: I am obliged to inform you that I, as well as my advisory clients, own some of the ETFs listed in the above table. Furthermore, they do not represent a specific investment recommendation for you, they merely show which ETFs from the universe I track are falling within the specified guidelines.
All linked charts above are courtesy of Bloomberg via ZeroHedge.
Contact Ulli