
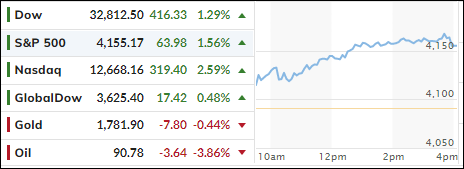
- Moving the markets
Traders and computer algos marched in sync today by ignoring the fact that the Fed might not be pivoting to lower rates for some time to come, which several Fed heads had made abundantly clear yesterday.
Today, it was St. Louis Fed President Bullard confirming again that “he doesn’t think the US is currently in a recession and that rate hikes to tame high inflation will continue.” That was followed by Neel Kashkari asserting that “2023 rate-cuts seem like a very unlikely scenario.”
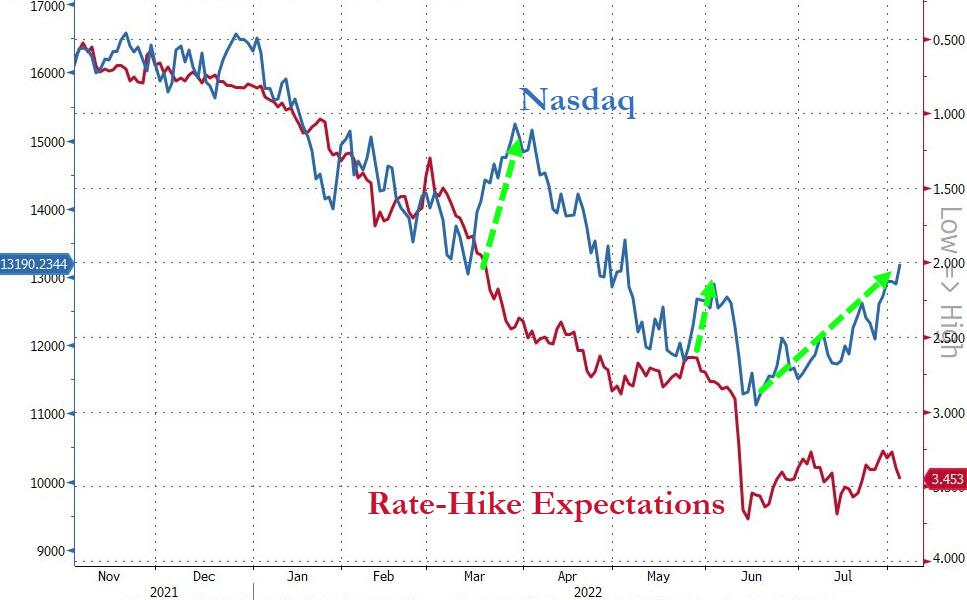
As a result, rate hike expectations soared, yet the markets totally disconnected from that reality, as stocks, for the 3rd time this cycle, decoupled from short term interest rates, making me wonder how long that might last. After all, suddenly, rate hikes are a positive for the markets? Go figure…
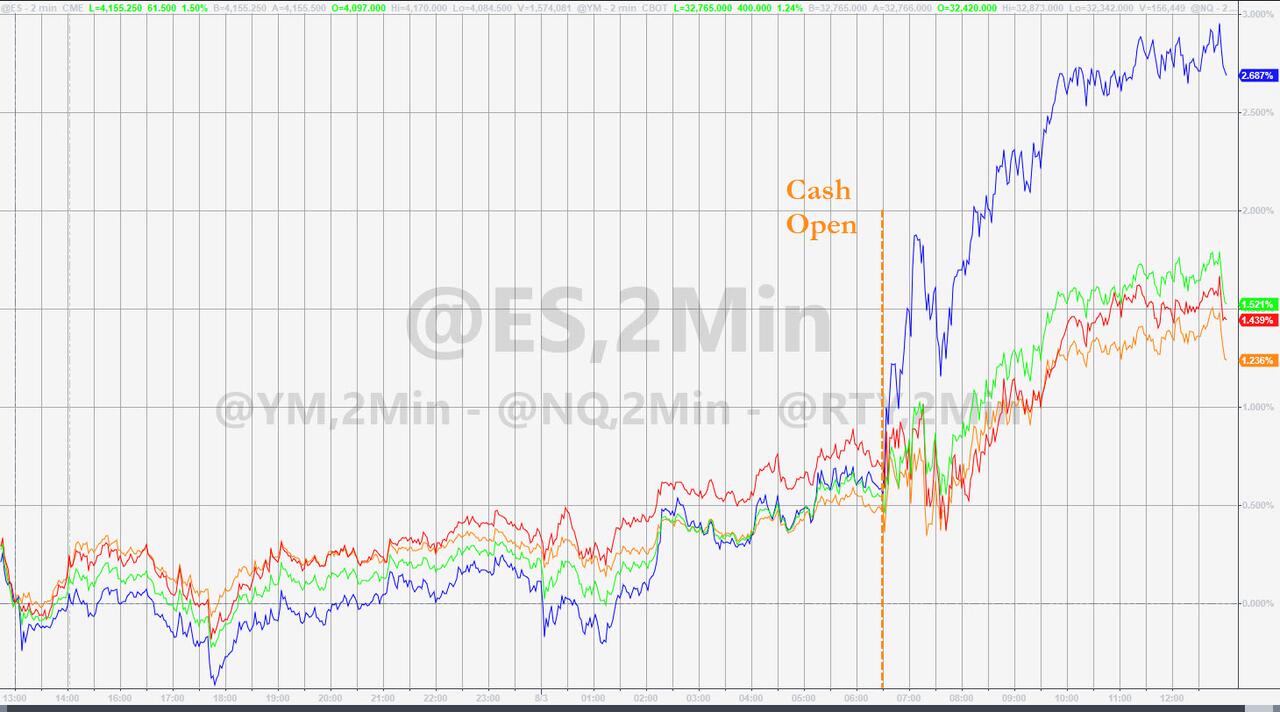
As an alternative, investors focused on earnings and better-than-expected economic data (factory orders soared in June) and, with the help of another short squeeze, markets simply ramped higher without looking back, thereby bringing us a step closer to a new “Buy” signal for domestic equities (section 3).
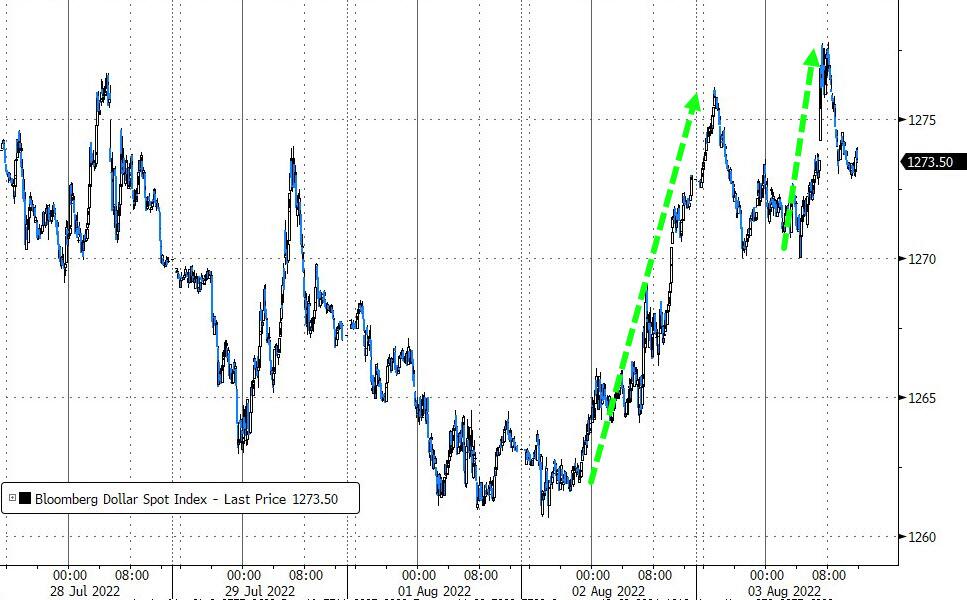
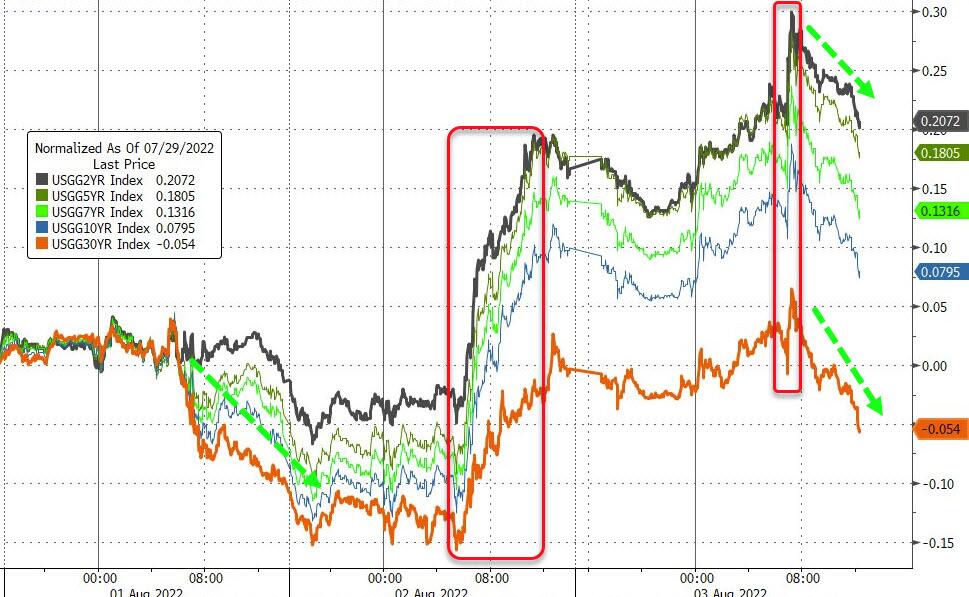
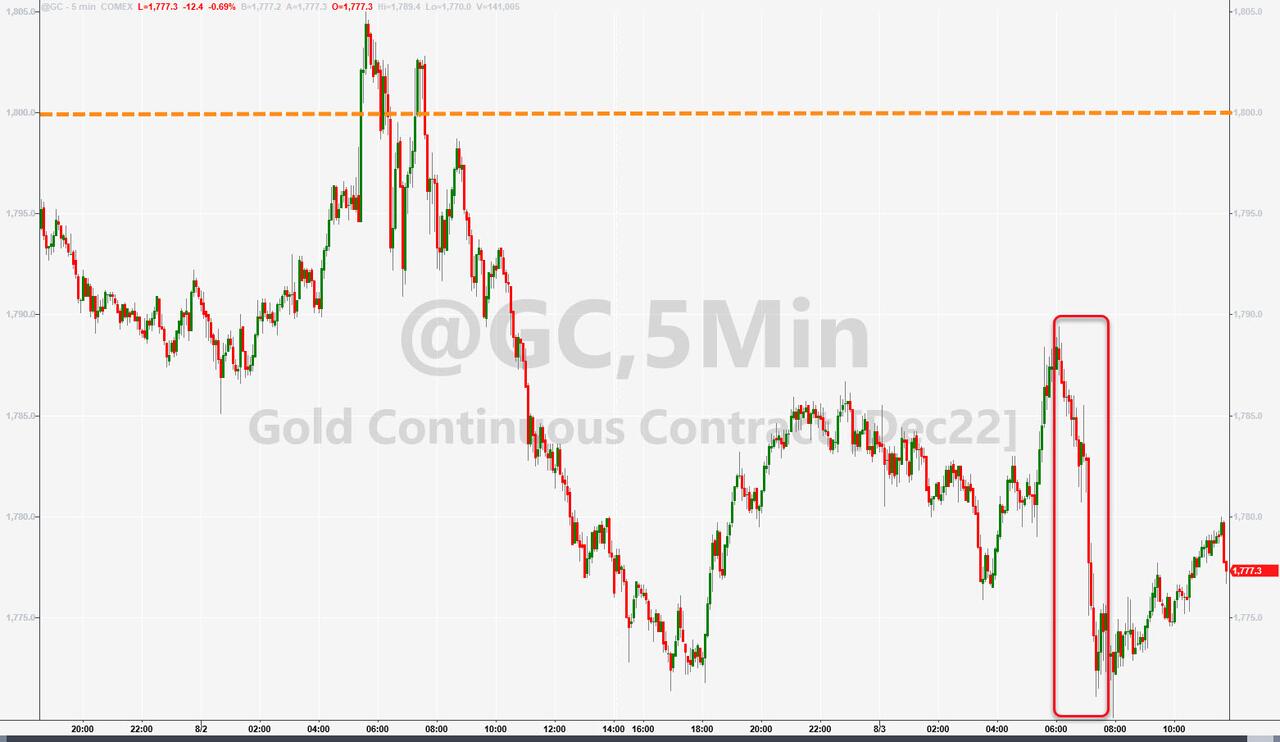
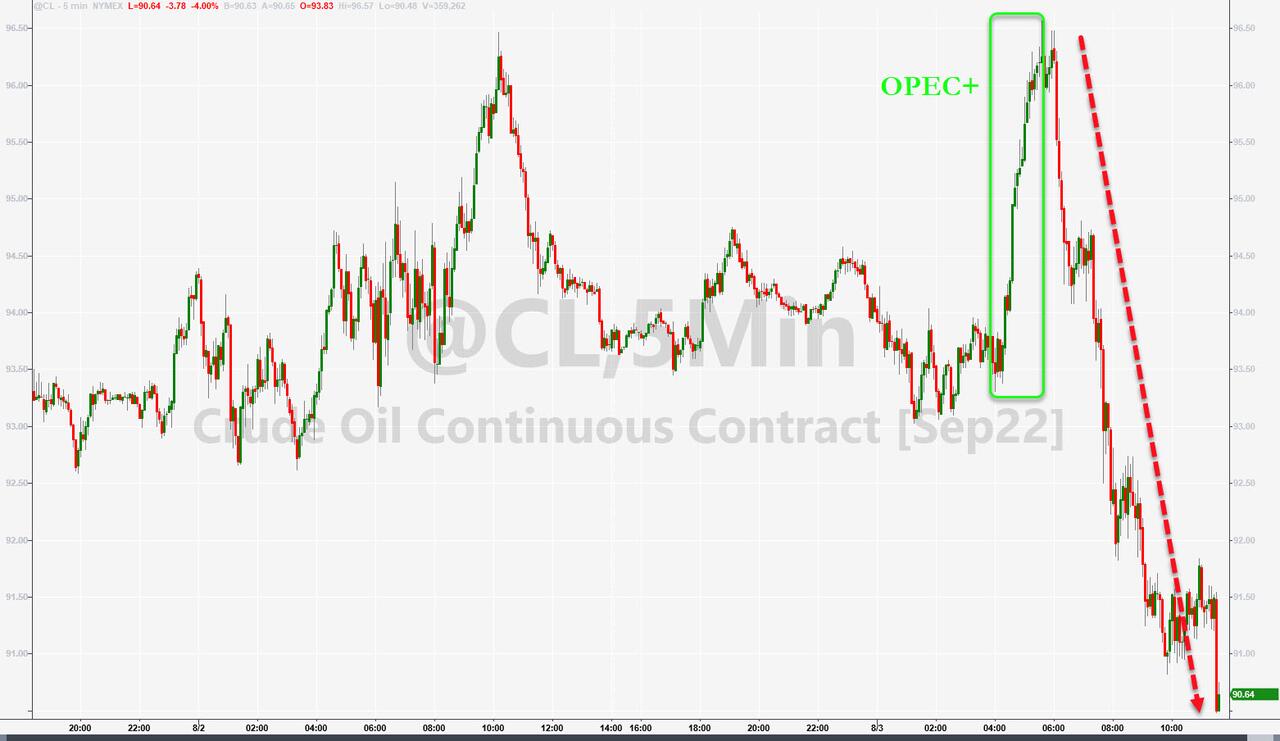
The US Dollar rallied modesty, as bond yields were mixed, gold slipped, while Crude Oil pumped and dumped.
All eyes are on Friday’s jobs report, which will either confirm that things are going in the wrong direction or give support to those opining that strong jobs numbers are holding up the economy.
2. ETFs in the Spotlight
In case you missed the announcement and description of this section, you can read it here again.
It features some of the 10 broadly diversified domestic and sector ETFs from my HighVolume list as posted every Saturday. Furthermore, they are screened for the lowest MaxDD% number meaning they have been showing better resistance to temporary sell offs than all others over the past year.
The below table simply demonstrates the magnitude with which these ETFs are fluctuating above or below their respective individual trend lines (%+/-M/A). A break below, represented by a negative number, shows weakness, while a break above, represented by a positive percentage, shows strength.
For hundreds of ETF choices, be sure to reference Thursday’s StatSheet.
For this closed-out domestic “Buy” cycle (2/24/2022), here’s how some of our candidates have fared. Keep in mind that our Domestic Trend Tracking Index (TTI) signaled a “Sell” on that date, which overrode the existing “Buys” shown for SPY and IYM:
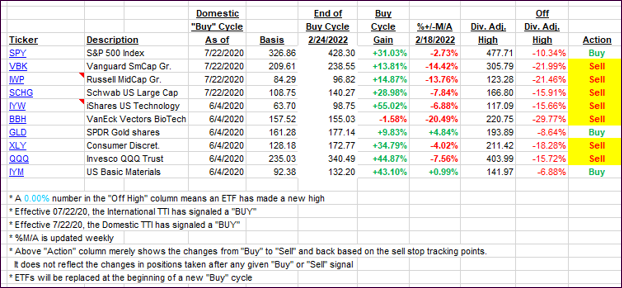
Click image to enlarge.
Again, the %+/-M/A column above shows the position of the various ETFs in relation to their respective long-term trend lines, while the trailing sell stops are being tracked in the “Off High” column. The “Action” column will signal a “Sell” once the -12% point has been taken out in the “Off High” column, which has replaced the prior -8% to -10% limits.
3. Trend Tracking Indexes (TTIs)
Our TTIs headed towards their respective trend lines, with the Domestic one making huge strides towards a new “Buy” signal. This event could very well occur by next week, should Friday’s jobs report turn out to ‘market pleasing.’
This is how we closed 08/03/2022:
Domestic TTI: -2.89% below its M/A (prior close -3.88%)—Sell signal effective 02/24/2022.
International TTI: -7.82% below its M/A (prior close -8.49%)—Sell signal effective 03/08/2022.
Disclosure: I am obliged to inform you that I, as well as my advisory clients, own some of the ETFs listed in the above table. Furthermore, they do not represent a specific investment recommendation for you, they merely show which ETFs from the universe I track are falling within the specified guidelines.
All linked charts above are courtesy of Bloomberg via ZeroHedge.
Contact Ulli