
ETF Tracker StatSheet
You can view the latest version here.
PONDERING A STRONG JOBS REPORT
- Moving the markets
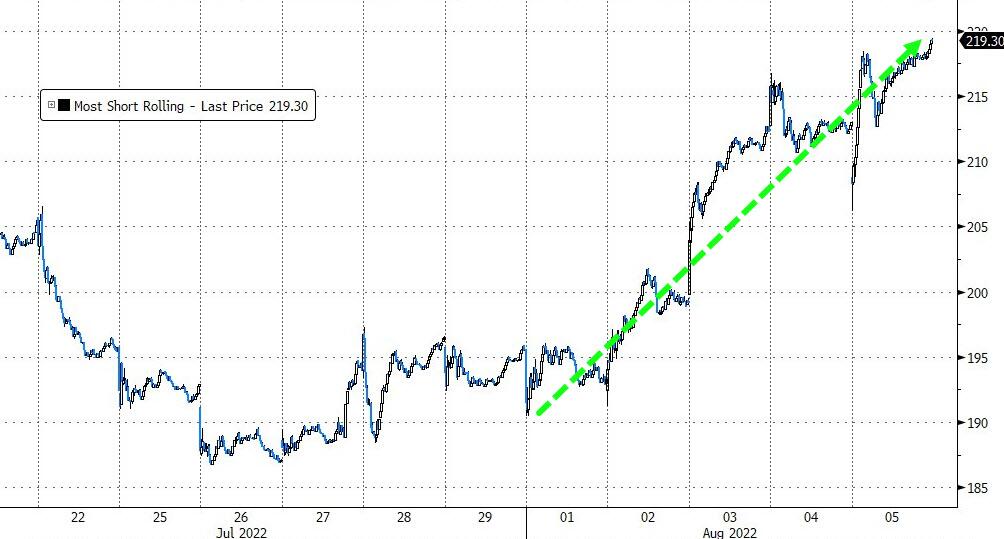
After much anticipation, today’s jobs report came in stronger than expected (528k vs. 258k), which caused an early sell-off, but the major indexes managed to claw back towards their respective unchanged lines, even though uncertainty reigned. However, with the help of the biggest weekly short squeeze since January 2021 any bearish momentum was wiped out.
The idea that the Fed will have to pivot to lower rates, which was the driver for the recent bear market rally, has traders concerned, as today’s jobs numbers point towards the option I have mentioned before, namely that the Fed may stay in the inflation fighting game a while longer. Chief market strategist Art Hogan, explained it succinctly:
Anybody that jumped on the ‘Fed is going to pivot next year and start cutting rates’ is going to have to get off at the next station, because that’s not in the cards.
With ZeroHedge also throwing cold water on too much enthusiasm:
The crazy thing, of course, is that Wall Street now thinks that the Fed’s tightening phase will be over by December and that the battle against inflation has been won, thereby enabling a new round of rate cutting and soaring stock prices.
Dream on!
Then adding this bon mot:
With a ‘malarkey’ of Fed Speakers all singing from the same hymn sheet – no pivot, we’re battling inflation, don’t expect rate-cuts next year – this morning’s 6-standard-deviation beat in payrolls really stole the jam out of the exuberant donut the market had been hoping for as ‘good news’ was definitely ‘bad news’ from hoping for a dovish Fed to return imminently.
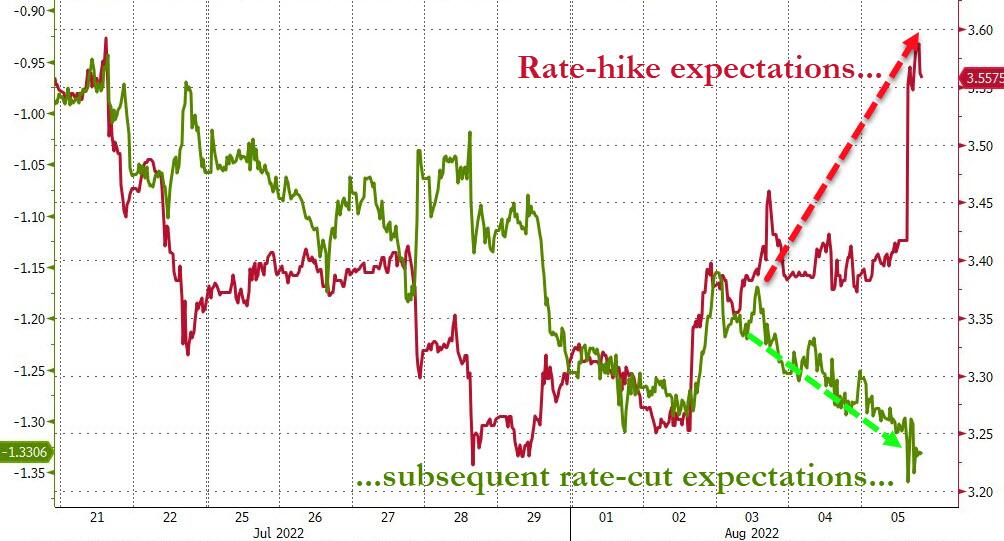
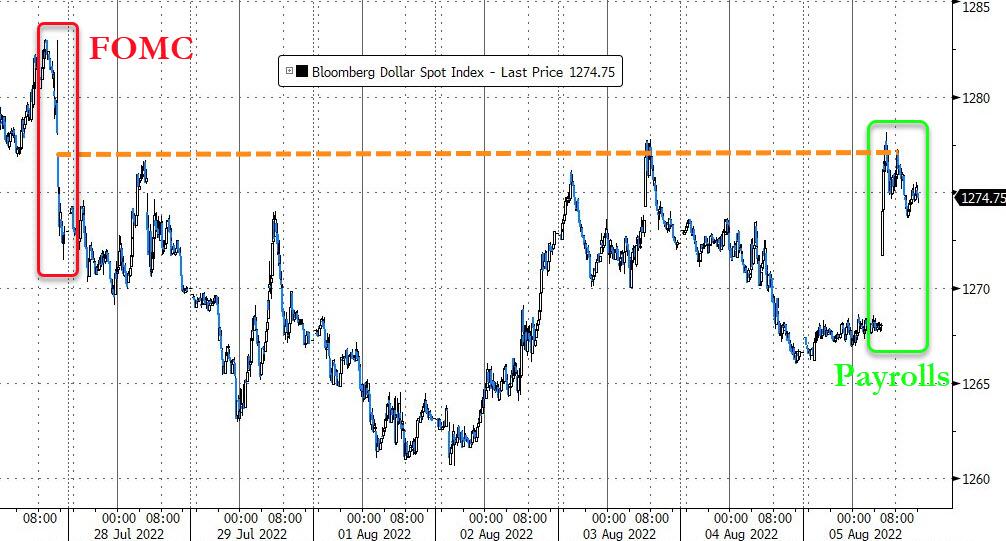
There you have it. The reason for the recent comeback has been annihilated, but it remains to be seen when and how soon the markets will adjust to this new reality, as rate hike expectations soared, and the odds of a 75 bps in September spiked from 25% to 80%.
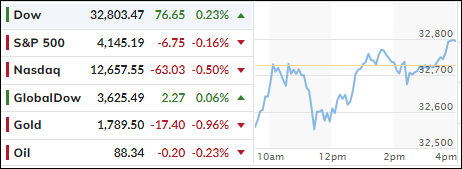
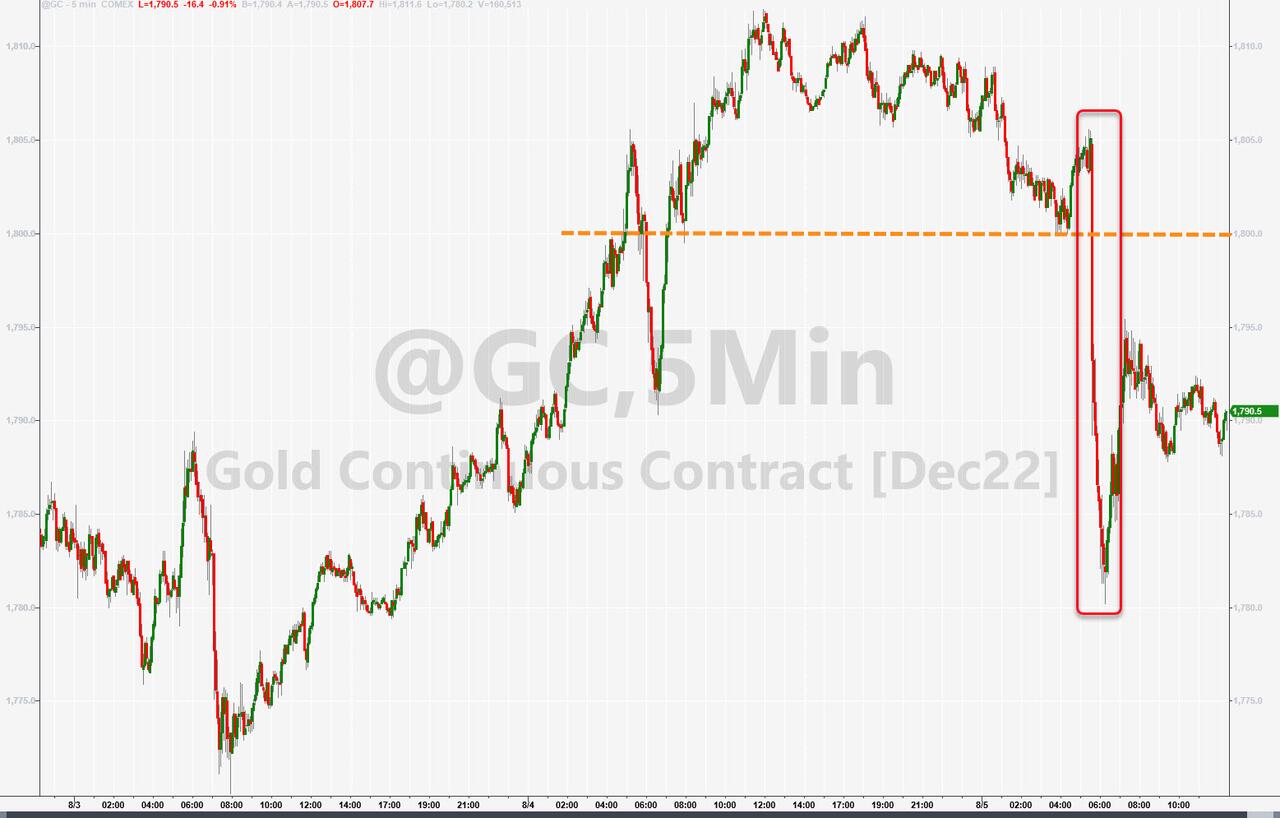
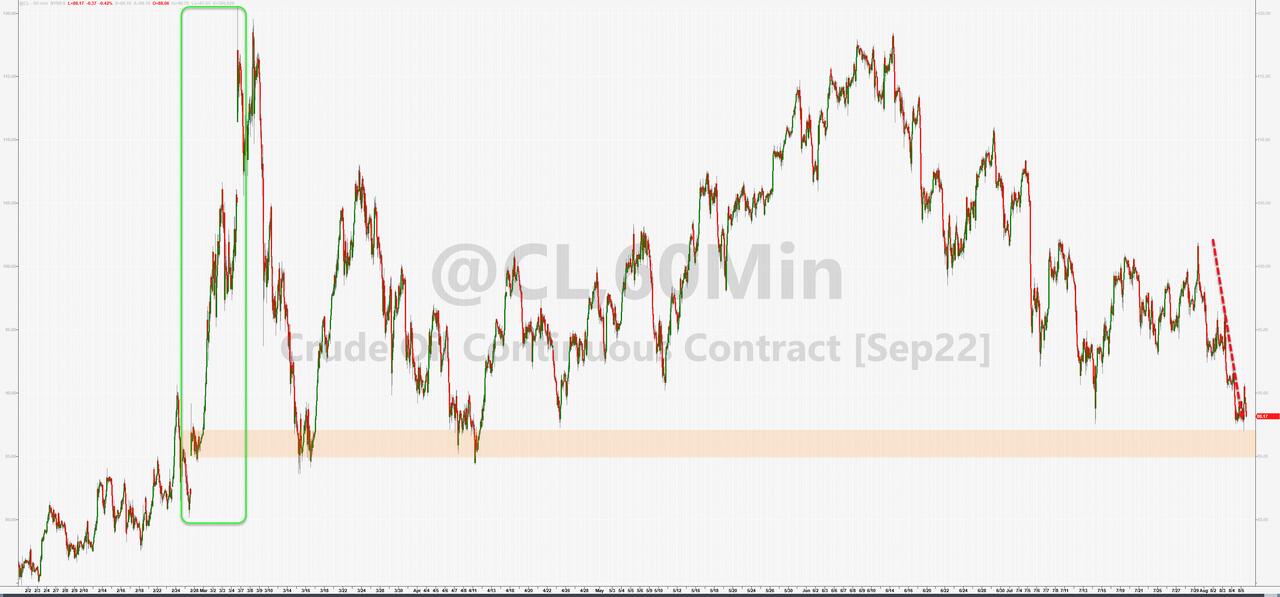
As a result, bond yields ended the week higher with the 10-year closing at 2.84%. Higher rates helped the US Dollar but pulled gold back below its $1,800 level. For the week, Crude oil got hammered and closed at $88.40.
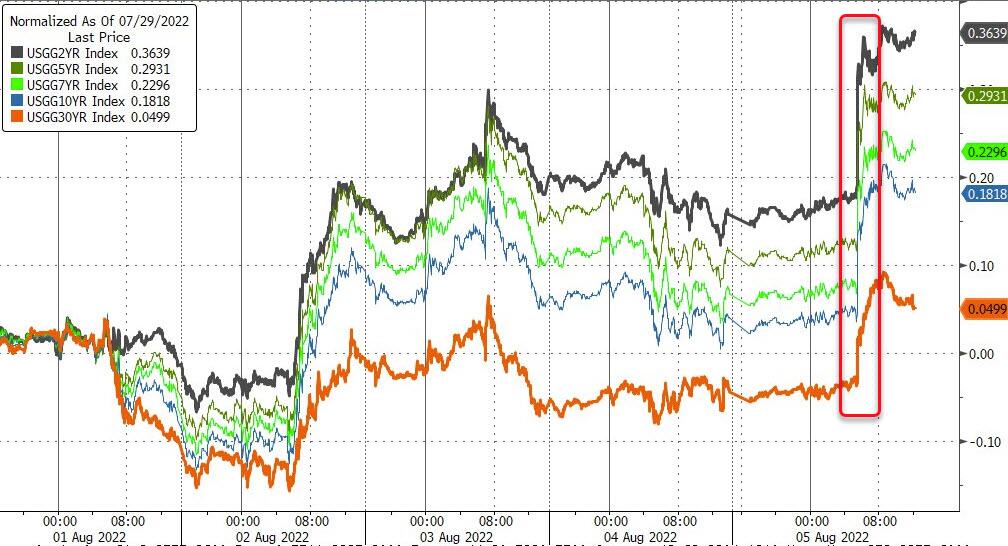
The question now remains, as ZeroHedge explained with this chart: Will stocks either fall back to reality, or is the Fed about to embark on the greatest flip-flop in history?
2. ETFs in the Spotlight
In case you missed the announcement and description of this section, you can read it here again.
It features some of the 10 broadly diversified domestic and sector ETFs from my HighVolume list as posted every Saturday. Furthermore, they are screened for the lowest MaxDD% number meaning they have been showing better resistance to temporary sell offs than all others over the past year.
The below table simply demonstrates the magnitude with which these ETFs are fluctuating above or below their respective individual trend lines (%+/-M/A). A break below, represented by a negative number, shows weakness, while a break above, represented by a positive percentage, shows strength.
For hundreds of ETF choices, be sure to reference Thursday’s StatSheet.
For this closed-out domestic “Buy” cycle (2/24/2022), here’s how some of our candidates have fared. Keep in mind that our Domestic Trend Tracking Index (TTI) signaled a “Sell” on that date, which overrode the existing “Buys” shown for SPY and IYM:
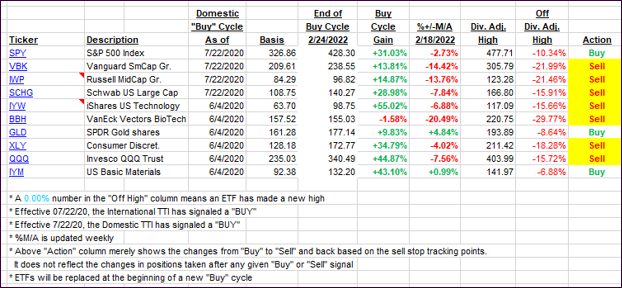
Click image to enlarge.
Again, the %+/-M/A column above shows the position of the various ETFs in relation to their respective long-term trend lines, while the trailing sell stops are being tracked in the “Off High” column. The “Action” column will signal a “Sell” once the -12% point has been taken out in the “Off High” column, which has replaced the prior -8% to -10% limits.
3. Trend Tracking Indexes (TTIs)
Our TTIs slipped a tad but remain on the bearish side of their respective trendlines.
This is how we closed 08/05/2022:
Domestic TTI: -2.76% below its M/A (prior close -3.09%)—Sell signal effective 02/24/2022.
International TTI: -7.50% below its M/A (prior close -7.75%)—Sell signal effective 03/08/2022.
Disclosure: I am obliged to inform you that I, as well as my advisory clients, own some of the ETFs listed in the above table. Furthermore, they do not represent a specific investment recommendation for you, they merely show which ETFs from the universe I track are falling within the specified guidelines.
All linked charts above are courtesy of Bloomberg via ZeroHedge.
———————————————————-
WOULD YOU LIKE TO HAVE YOUR INVESTMENTS PROFESSIONALLY MANAGED?
Do you have the time to follow our investment plans yourself? If you are a busy professional who would like to have his portfolio managed using our methodology, please contact me directly to get more details.
Contact Ulli