
- Moving the markets
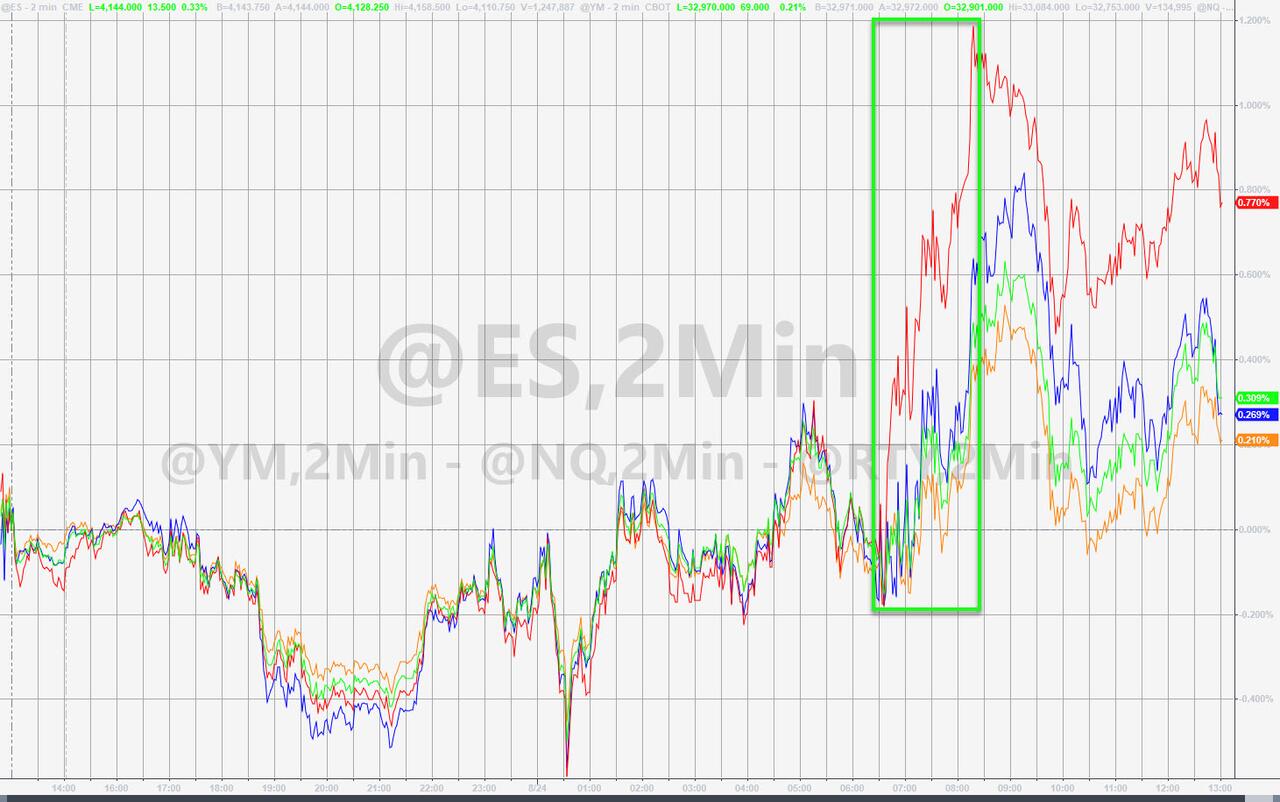
Aimless meandering, with a slight upside bias, continued but, in the end, traders were too much on edge ahead of Powell’s speech on Friday regarding inflation and interest rates following the Jackson Hole symposium.
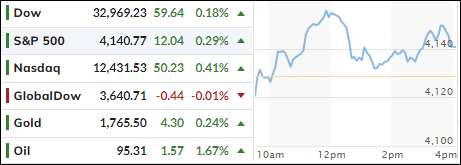
Beliefs are that the Fed will reinforce its view of fighting inflation, which could create a headwind for equity prices. Nevertheless, today, the major indexes managed to snap a 3-day slide.
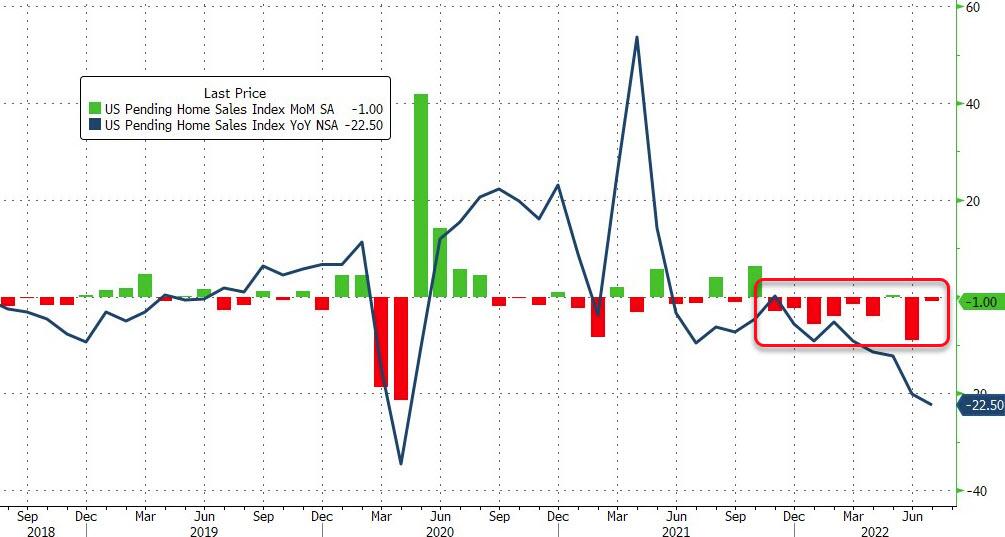
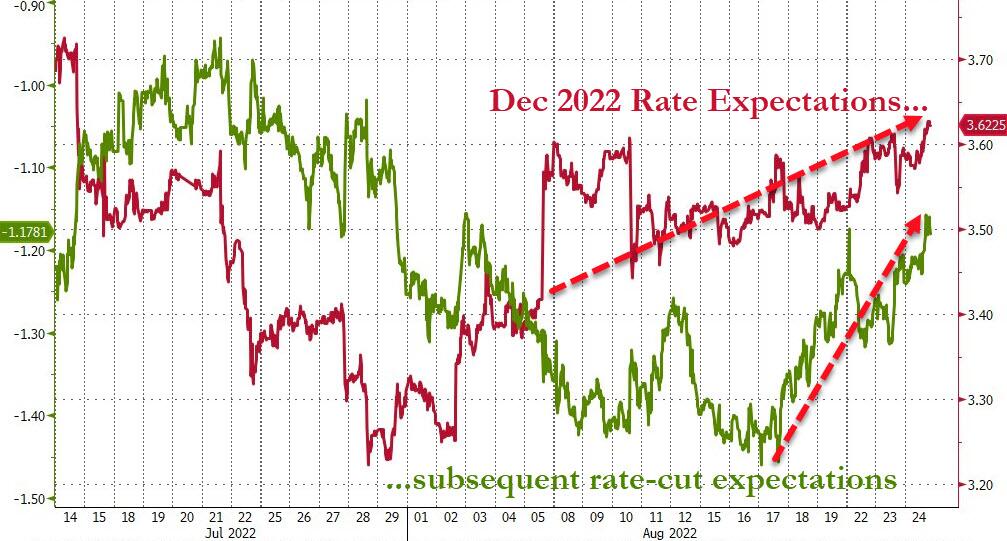
Despite horrible economic data for Pending Home Sales and Durable Goods Orders, rate hike expectations rose with subsequent rate cut expectations also moving further into hawkish territory.
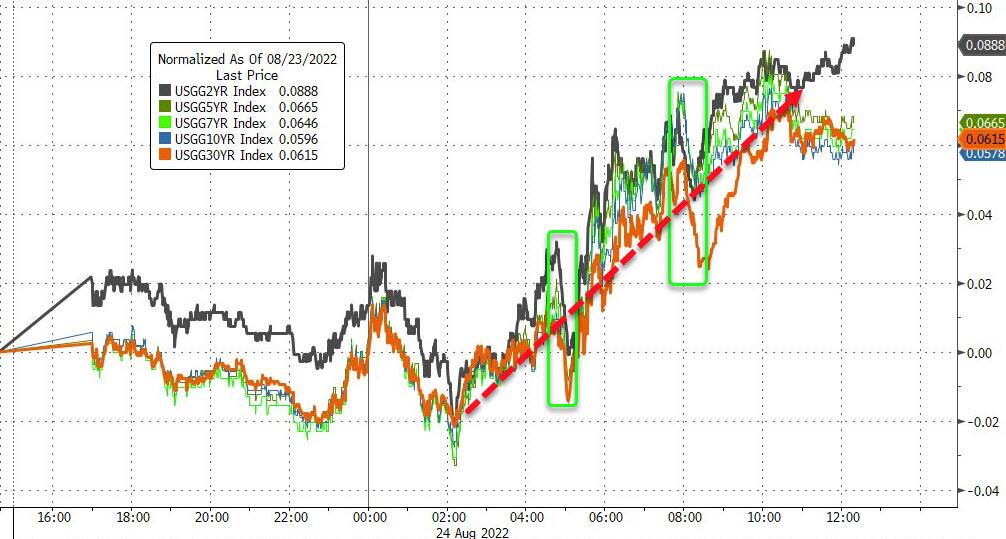
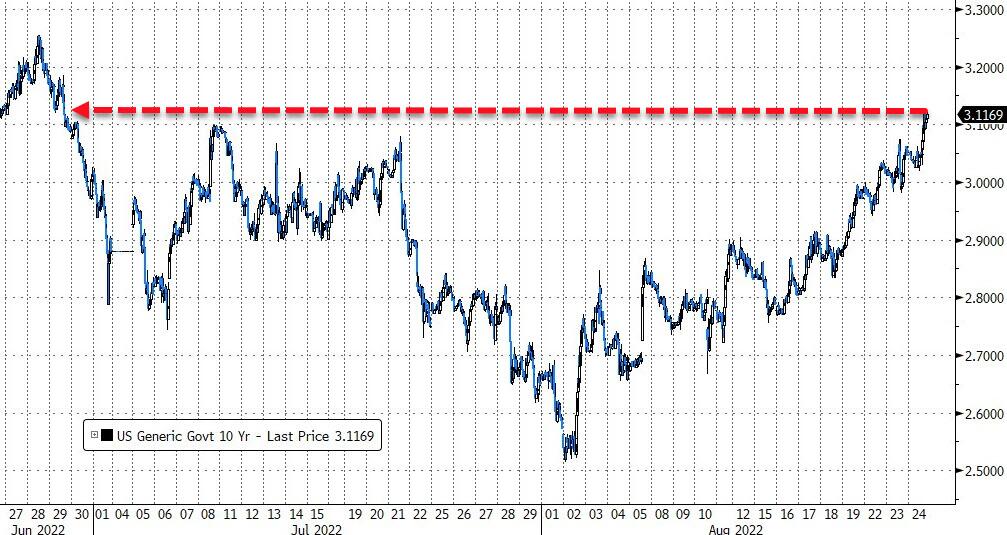
Bond yields did not help the markets at all, as they rose for the fourth day in a row, with the 10-year now solidly positioned above its 3% level and touching a 2-month high, as Zero Hedge pointed out.
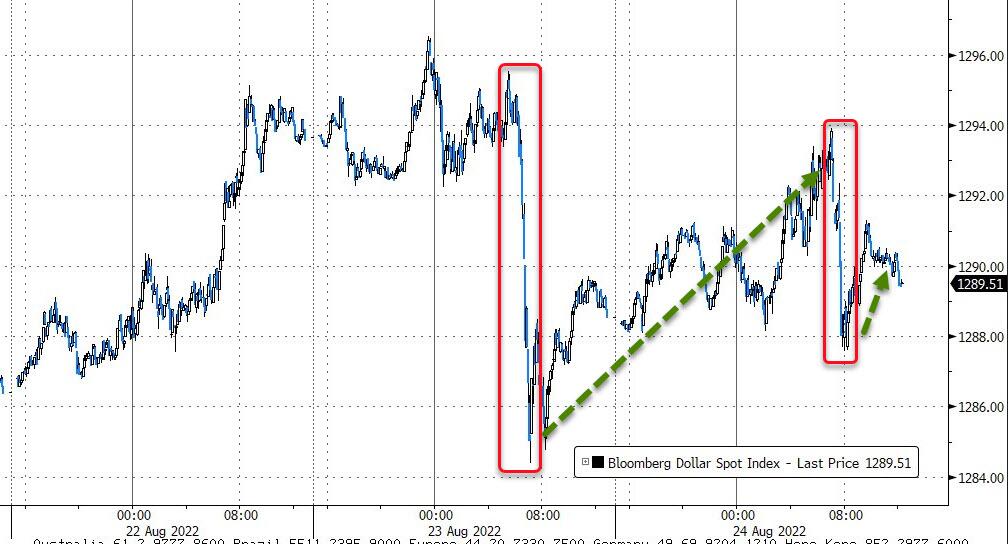
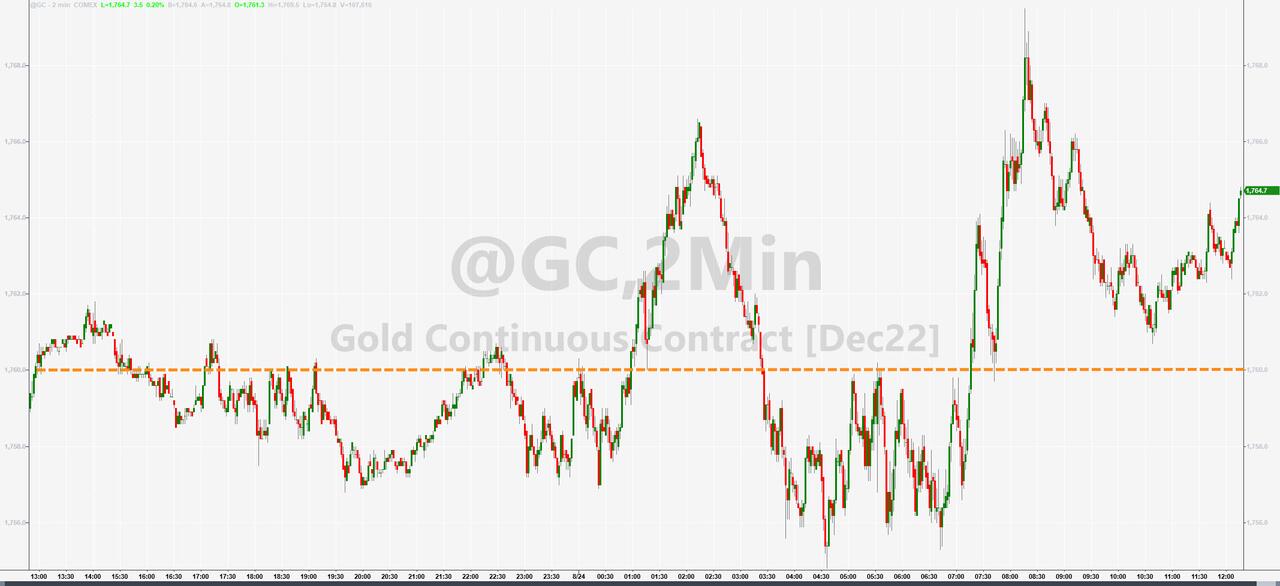
Despite the US Dollar rebounding from yesterday’s weak showing, gold held firm and closed higher for the session.
I expect another slow trading day tomorrow, but we could see a breakout or breakdown after Powell’s speech on Friday.
2. ETFs in the Spotlight
In case you missed the announcement and description of this section, you can read it here again.
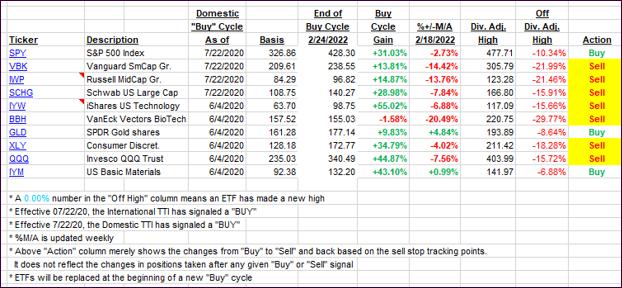
It features some of the 10 broadly diversified domestic and sector ETFs from my HighVolume list as posted every Saturday. Furthermore, they are screened for the lowest MaxDD% number meaning they have been showing better resistance to temporary sell offs than all others over the past year.
The below table simply demonstrates the magnitude with which these ETFs are fluctuating above or below their respective individual trend lines (%+/-M/A). A break below, represented by a negative number, shows weakness, while a break above, represented by a positive percentage, shows strength.
For hundreds of ETF choices, be sure to reference Thursday’s StatSheet.
For this closed-out domestic “Buy” cycle (2/24/2022), here’s how some of our candidates have fared. Keep in mind that our Domestic Trend Tracking Index (TTI) signaled a “Sell” on that date, which overrode the existing “Buys” shown for SPY and IYM:
Click image to enlarge.
Again, the %+/-M/A column above shows the position of the various ETFs in relation to their respective long-term trend lines, while the trailing sell stops are being tracked in the “Off High” column. The “Action” column will signal a “Sell” once the -12% point has been taken out in the “Off High” column, which has replaced the prior -8% to -10% limits.
3. Trend Tracking Indexes (TTIs)
Our TTIs improved a tad but remain stuck on the bearish side of their respective trend lines.
This is how we closed 08/24/2022:
Domestic TTI: -1.97% below its M/A (prior close -2.45%)—Sell signal effective 02/24/2022.
International TTI: -6.65% below its M/A (prior close -6.71%)—Sell signal effective 03/08/2022.
Disclosure: I am obliged to inform you that I, as well as my advisory clients, own some of the ETFs listed in the above table. Furthermore, they do not represent a specific investment recommendation for you, they merely show which ETFs from the universe I track are falling within the specified guidelines.
All linked charts above are courtesy of Bloomberg via ZeroHedge.
Contact Ulli