
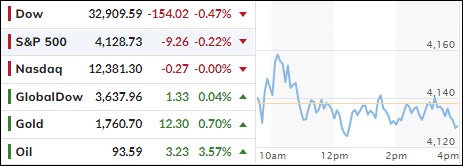
- Moving the markets
An early rebound attempt had no legs causing the major indexes to slip below their respective unchanged lines. Not much was lost though, as the tug-of-war between the hawkish crowd (higher rates) and the dovish supporters (lower rates) were evenly matched.
Ahead of Friday’s Jackson Hole symposium, and Powell’s speech thereafter, the markets looked to be subdued with speculation rampant as to which way he will be leaning regarding future rate hikes.
Traders are bracing themselves for a hawkish message, which could very well pull the rug out from under equities with voices growing louder that the rebound off the June lows was nothing but a bear market rally, and that those lows will be revisited at some point soon.
That goes along with the status of my Domestic Trend Tracking Index (TTI), which spent only 5 days in bullish territory before slipping back below its trend line to -2.45%. Consequently, we will be liquidating our small equity position again—very likely tomorrow.
Poor economic data, with crashing new home sales at the center, dominated headline news with battle cries getting noisier that “the Fed must save us,” which, of course, expresses hope of not necessarily lower rates but less of a hike in September.
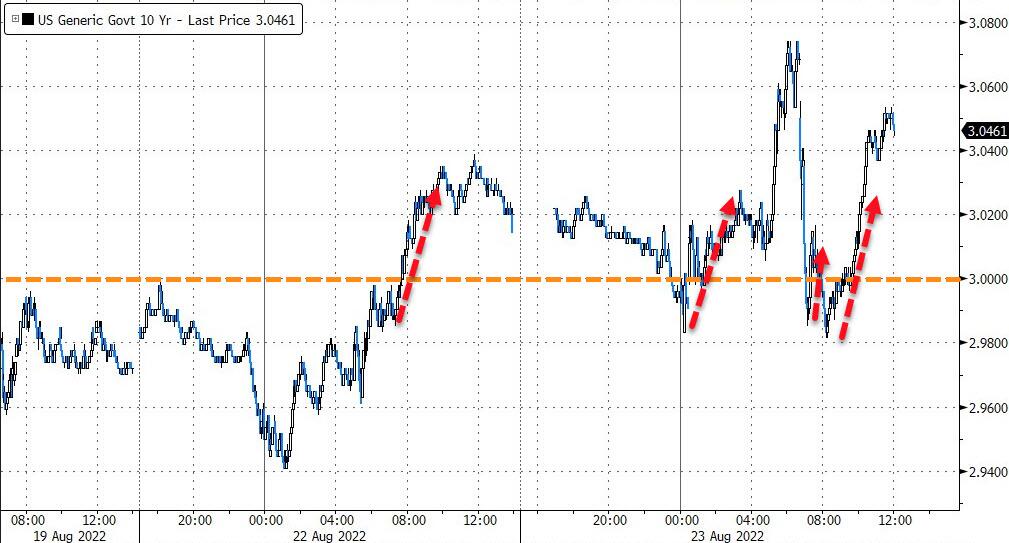
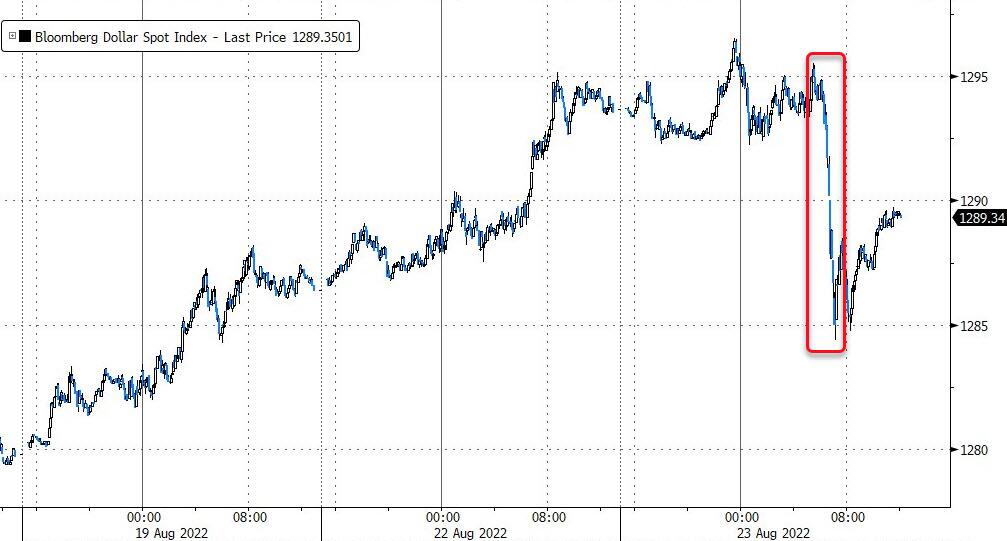
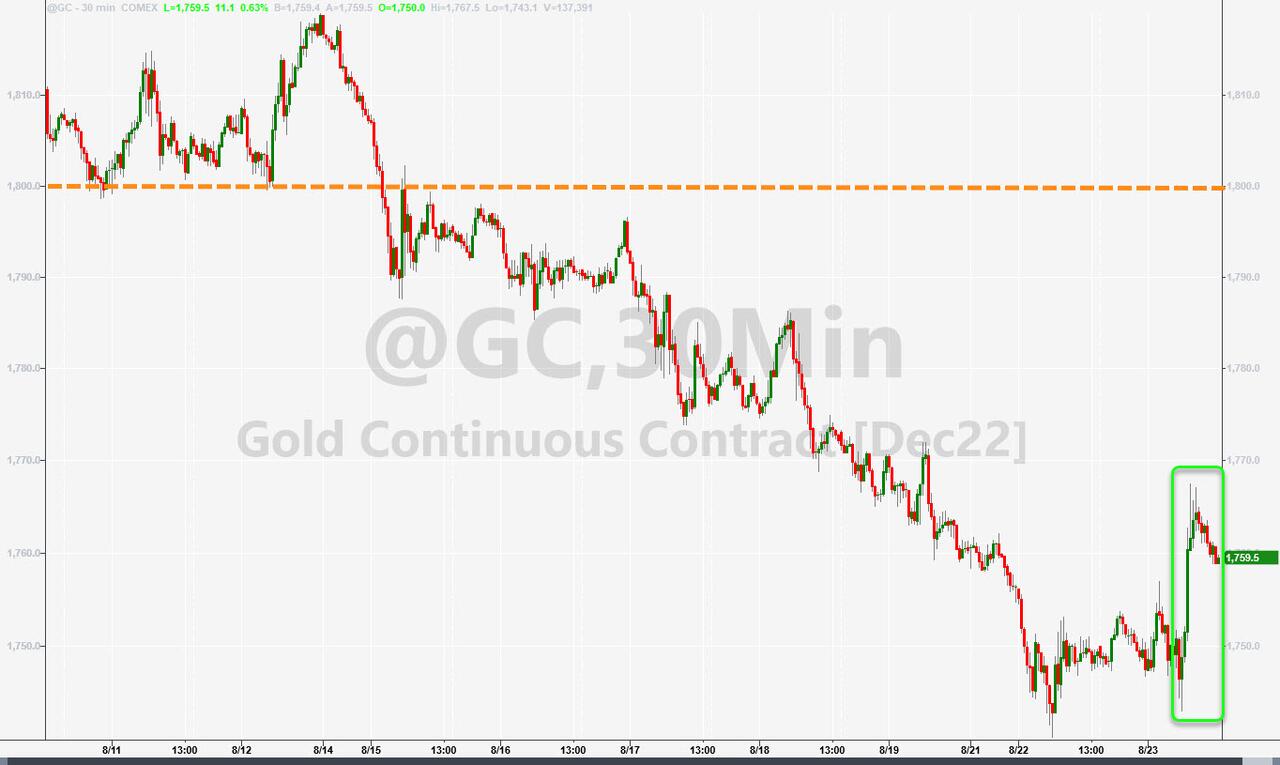
Bond yields chopped around all day, but the 10-year found support at the much fought-over 3% level and closed above it. With the US Dollar heading south for a change, gold benefitted with the precious metal reclaiming its $1,750 level.
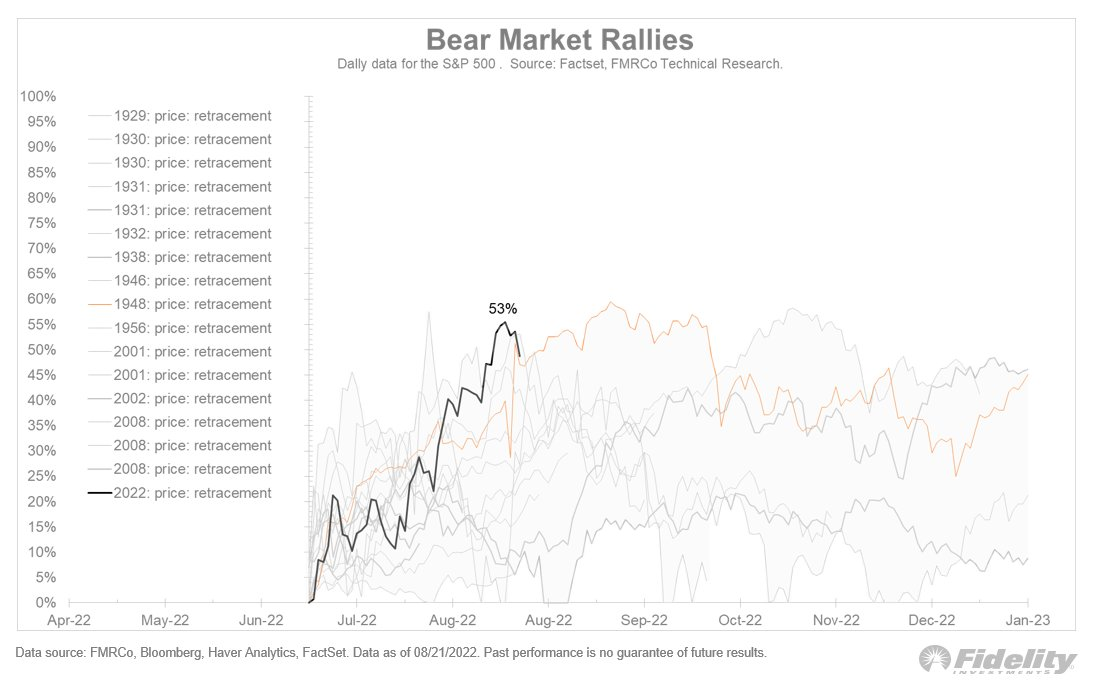
Analyst Jurrian Timmer had this interesting take:
The rebound rally is at a crossroads:
“The S&P 500 has retraced 53% of its decline, and this is as far as bear market rallies go…”
Hmm, as that graph shows, anything above that level would then have to be considered a new bull market.
2. ETFs in the Spotlight
In case you missed the announcement and description of this section, you can read it here again.
It features some of the 10 broadly diversified domestic and sector ETFs from my HighVolume list as posted every Saturday. Furthermore, they are screened for the lowest MaxDD% number meaning they have been showing better resistance to temporary sell offs than all others over the past year.
The below table simply demonstrates the magnitude with which these ETFs are fluctuating above or below their respective individual trend lines (%+/-M/A). A break below, represented by a negative number, shows weakness, while a break above, represented by a positive percentage, shows strength.
For hundreds of ETF choices, be sure to reference Thursday’s StatSheet.
For this closed-out domestic “Buy” cycle (2/24/2022), here’s how some of our candidates have fared. Keep in mind that our Domestic Trend Tracking Index (TTI) signaled a “Sell” on that date, which overrode the existing “Buys” shown for SPY and IYM:
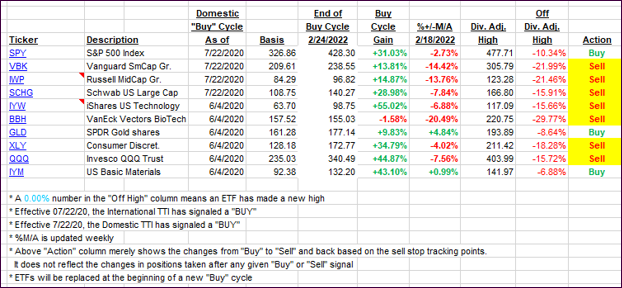
Click image to enlarge.
Again, the %+/-M/A column above shows the position of the various ETFs in relation to their respective long-term trend lines, while the trailing sell stops are being tracked in the “Off High” column. The “Action” column will signal a “Sell” once the -12% point has been taken out in the “Off High” column, which has replaced the prior -8% to -10% limits.
3. Trend Tracking Indexes (TTIs)
Our TTIs were mixed, but the Domestic one showed more weakness. Unless a sharp rebound materializes tomorrow, I will close out the small equity position we held in my advisor practice. With the uncertainty of the Jackson Hole symposium looming, it’s best to eliminate all market risk.
This is how we closed 08/23/2022:
Domestic TTI: -2.45% below its M/A (prior close -2.20%)—Sell signal effective 02/24/2022.
International TTI: -6.71% below its M/A (prior close -6.82%)—Sell signal effective 03/08/2022.
Disclosure: I am obliged to inform you that I, as well as my advisory clients, own some of the ETFs listed in the above table. Furthermore, they do not represent a specific investment recommendation for you, they merely show which ETFs from the universe I track are falling within the specified guidelines.
All linked charts above are courtesy of Bloomberg via ZeroHedge.
Contact Ulli