
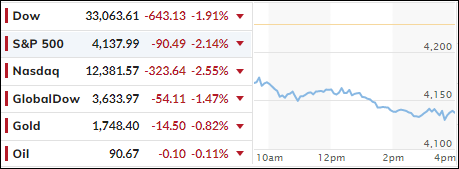
[Chart courtesy of MarketWatch.com]
- Moving the markets
Much of the July/August rebound from deep bear market territory was based on hope that the Fed will have to abandon its hawkish interest rate policy and “pivot” towards dovishness, which would result in lower rates and hence a continuation of the bullish theme.
While this pivot may eventually happen, it may not occur as quickly as anticipated. The Fed and its mouthpieces have in the recent past pounced on the reality that their inflation fight will continue, a fact that traders conveniently ignored.
Analyst Peter Schiff explained that the end to interest hikes has been pushed back, which is a negative for growth stocks for two reasons:
- It means higher interest rates. That is a big negative for growth stocks because it discounts their future earnings by a higher interest rate.
- If the Fed is going to have to stay higher for longer, that means the economy will be weaker for longer. That will weigh down earnings.
He thinks the sucker rally had ended and the primary trend (down) has resumed. I agree with his assessment as, technically speaking, our Domestic Trend Tracking Index (TTI) has plunged back into bear market territory (section 3.)
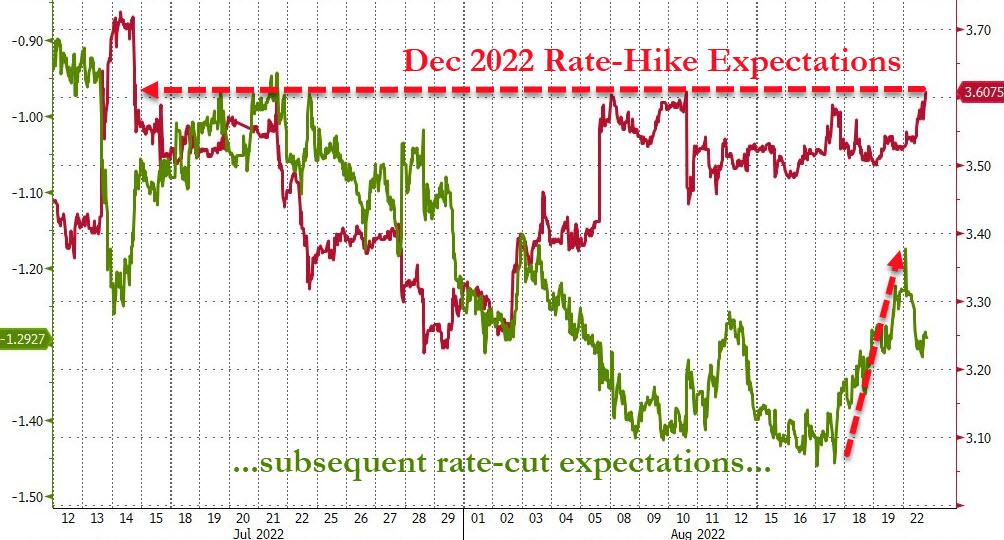
As a result, rate hike expectations are back at their highest since mid-July, as ZeroHedge pointed out, and subsequent rate-cut expectations have tightened as well.
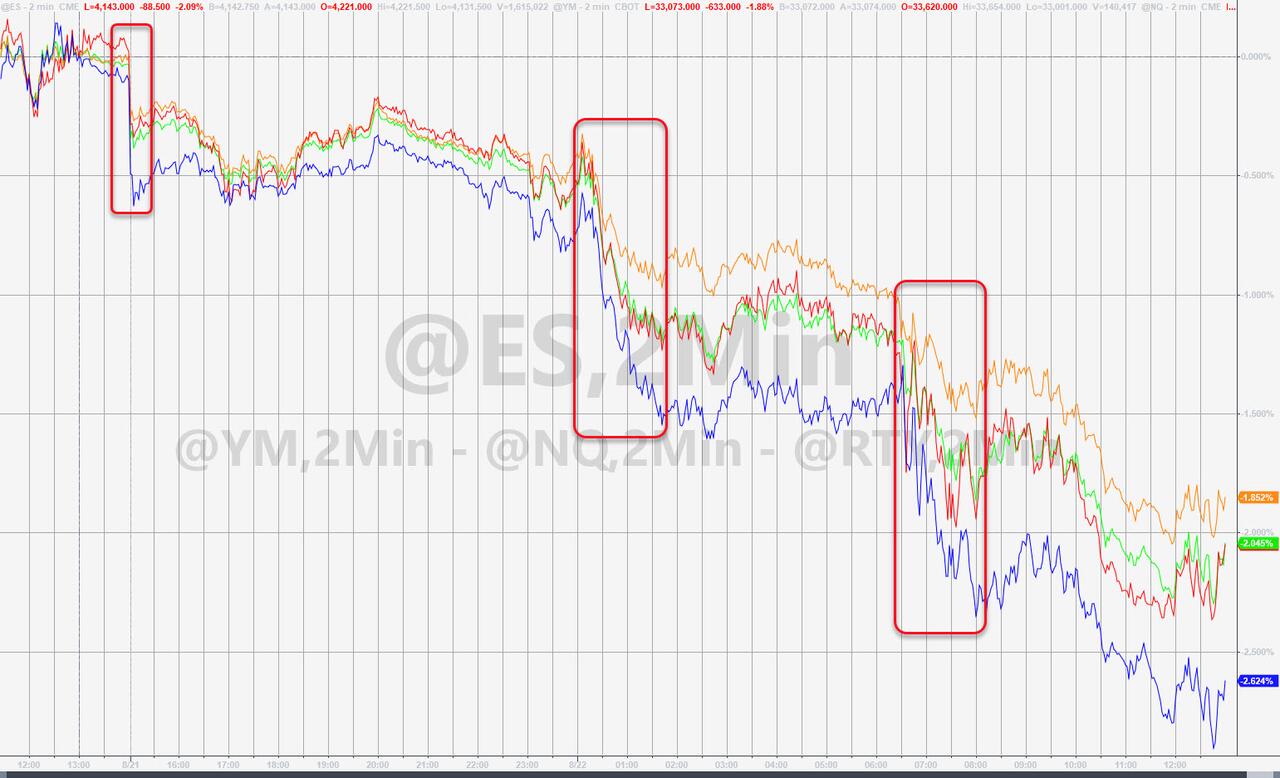
The major indexes took a dive, led by the Nasdaq, with all of them heading towards their 100-day M/As, after the 200-day M/As proved to be too much overhead resistance.
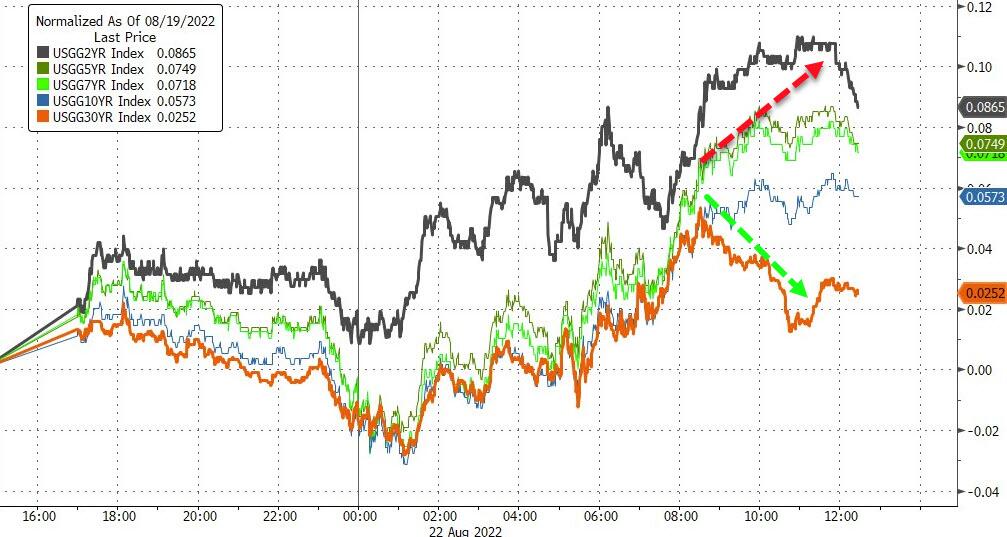
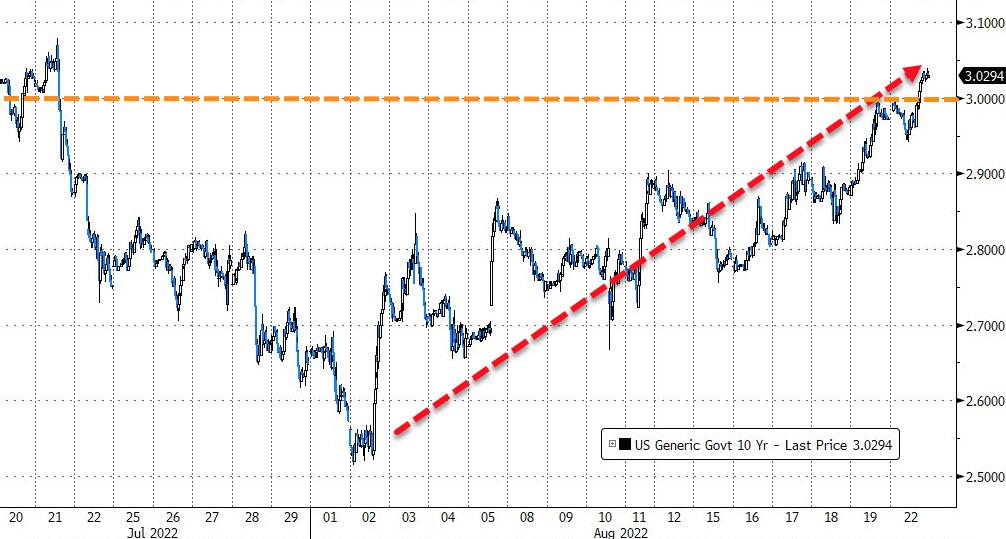
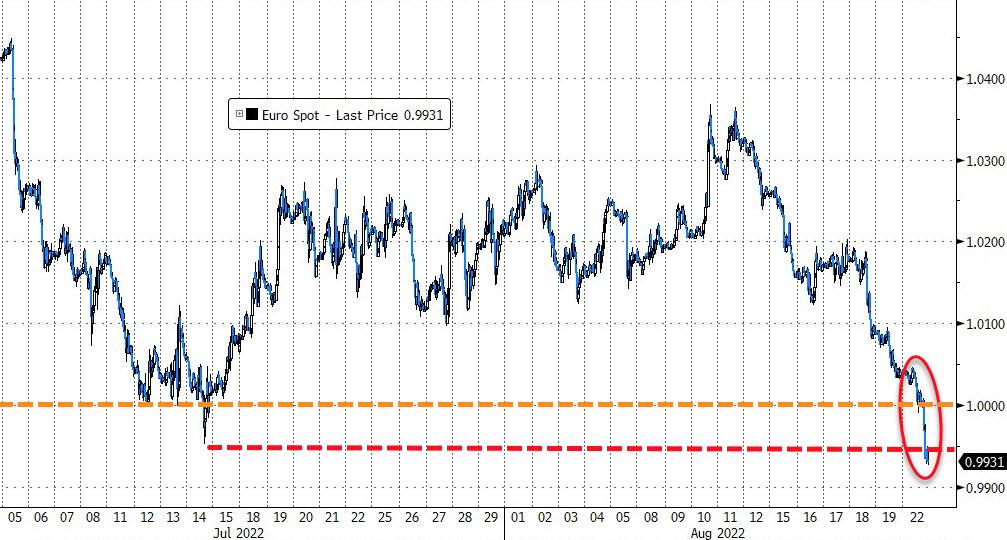
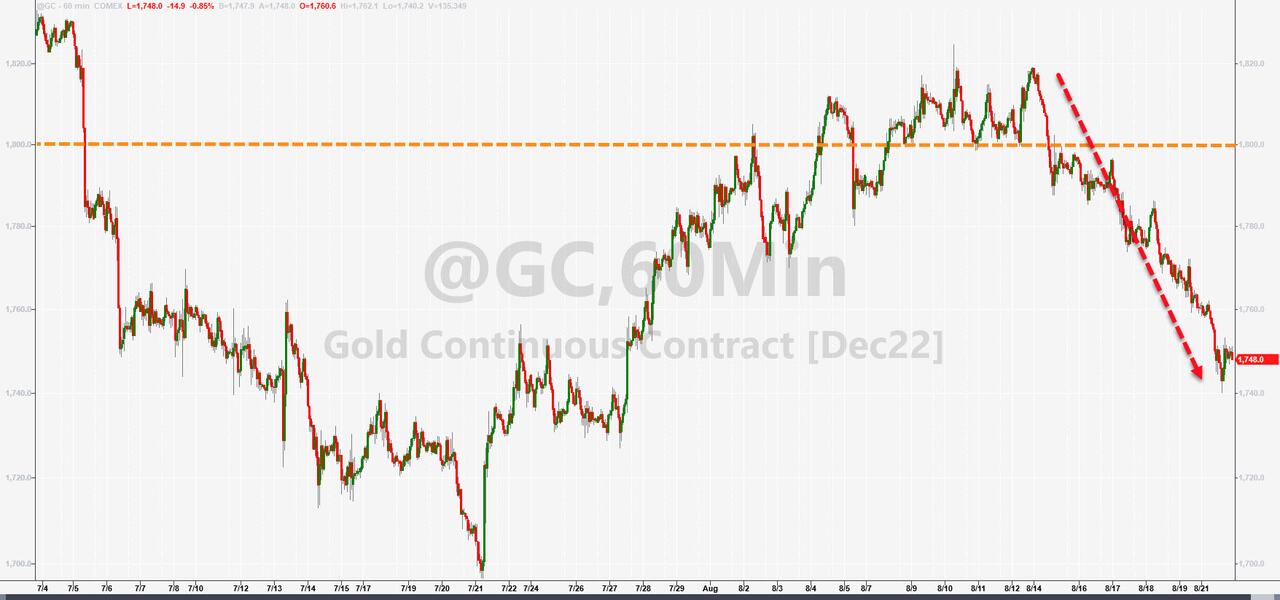
Bond yields climbed with the 10-year again conquering its 3% level and closing above it. The Euro crashed to its weakest against the US Dollar, which rallied to its highest close since June 2002, as ZeroHedge reported. Gold extended its losses below $1,800 due to the dollar’s strength.
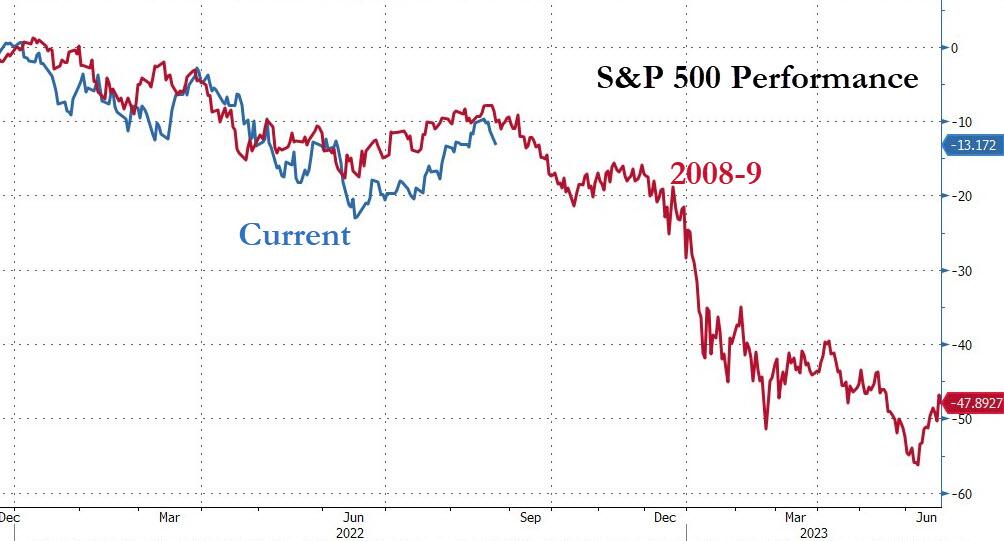
The analog to 2008 appears to be on target—at least for right now.
2. ETFs in the Spotlight
In case you missed the announcement and description of this section, you can read it here again.
It features some of the 10 broadly diversified domestic and sector ETFs from my HighVolume list as posted every Saturday. Furthermore, they are screened for the lowest MaxDD% number meaning they have been showing better resistance to temporary sell offs than all others over the past year.
The below table simply demonstrates the magnitude with which these ETFs are fluctuating above or below their respective individual trend lines (%+/-M/A). A break below, represented by a negative number, shows weakness, while a break above, represented by a positive percentage, shows strength.
For hundreds of ETF choices, be sure to reference Thursday’s StatSheet.
For this closed-out domestic “Buy” cycle (2/24/2022), here’s how some of our candidates have fared. Keep in mind that our Domestic Trend Tracking Index (TTI) signaled a “Sell” on that date, which overrode the existing “Buys” shown for SPY and IYM:
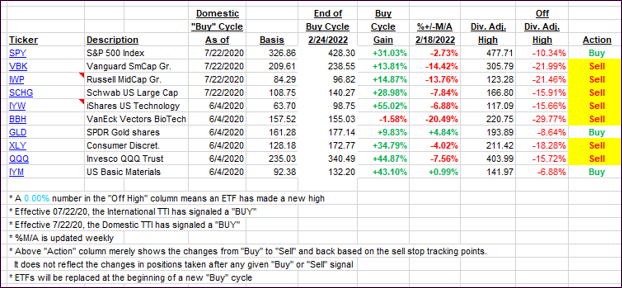
Click image to enlarge.
Again, the %+/-M/A column above shows the position of the various ETFs in relation to their respective long-term trend lines, while the trailing sell stops are being tracked in the “Off High” column. The “Action” column will signal a “Sell” once the -12% point has been taken out in the “Off High” column, which has replaced the prior -8% to -10% limits.
3. Trend Tracking Indexes (TTIs)
Our TTIs dumped deeper into bear market territory, after having stayed above it for 5 straight days. We will now need to see a resurgence of bullish momentum before a new “Buy” signal can be generated.
In my advisor practice, we had taken a small domestic equity position subject to a tight sell stop. We will move back to cash, should more weakness prevail.
This is how we closed 08/22/2022:
Domestic TTI: -2.20% below its M/A (prior close -0.11%)—Sell signal effective 02/24/2022.
International TTI: -6.82% below its M/A (prior close -5.39%)—Sell signal effective 03/08/2022.
Disclosure: I am obliged to inform you that I, as well as my advisory clients, own some of the ETFs listed in the above table. Furthermore, they do not represent a specific investment recommendation for you, they merely show which ETFs from the universe I track are falling within the specified guidelines.
All linked charts above are courtesy of Bloomberg via ZeroHedge.
Contact Ulli