
ETF Tracker StatSheet
You can view the latest version here.
OPTIONS EXPIRATIONS DAY WHACKS MARKETS
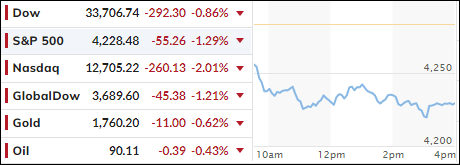
[Chart courtesy of MarketWatch.com]
- Moving the markets
Bulls were nowhere to be found today, as the $2.1 Trillion options expiration day exacted a pound of flesh from the markets, thereby breaking the S&P 500’s 4-week win streak. The summer rally hit the skids and brought thoughts of this being the end of the bear market bounce back into play.
A variety of forces, besides options expirations, contributed to the sour mood on Wall Street. The Fed minutes from the July meeting, as well as Federal Reserve President Bullard’s comments that the Central Bank would likely continue hiking rates in the near term, which again dashed hopes for the infamous “dovish pivot.”
Then Richmond President Barkin pulled that rug out even further with this comment:
“The Fed must curb inflation even if this causes a recession.”
Ouch!
Goldman Sachs laid out this list of items, which added to the sell-off:
- Retail Meme Stocks Unraveling – BBBY -40%…Imagine shorts will be coming out of the woodwork
- Crypto following suit
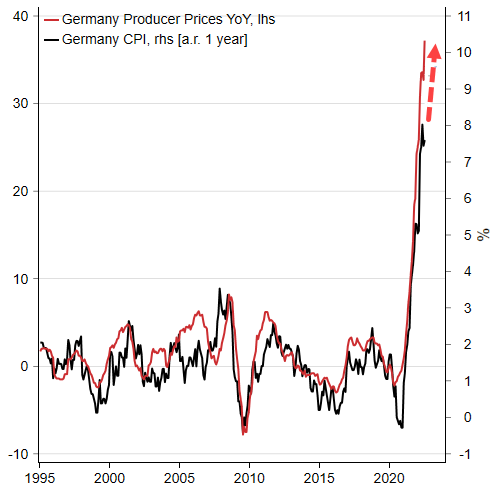
- German PPI Came in at Record Highs – 5.7% MoM rise and 37.2% YoY
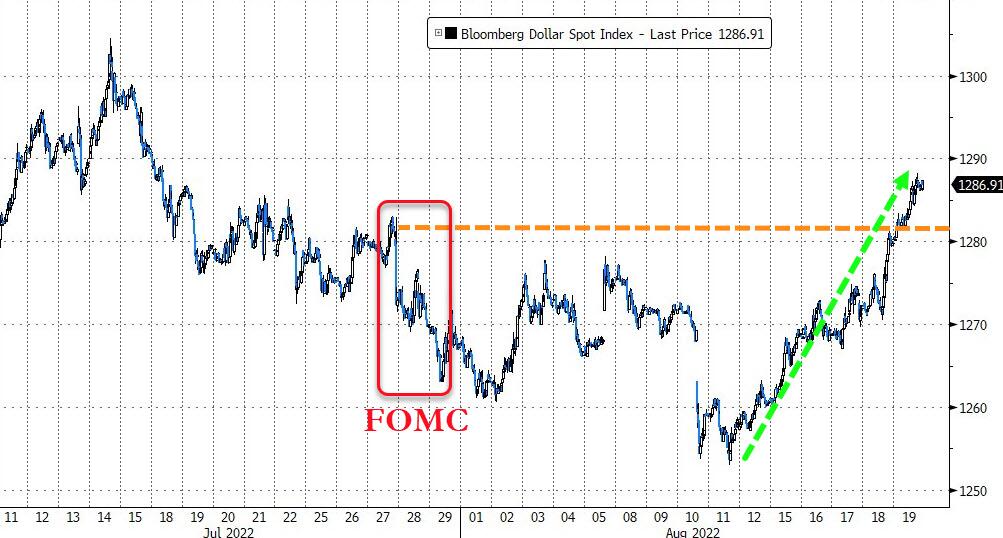
- DXY Strong following suit – EURUSD testing parity…
- Bullard called for 75bps in September – yet mkt still pricing in 50/50 short of a 75bps hike in Sept.
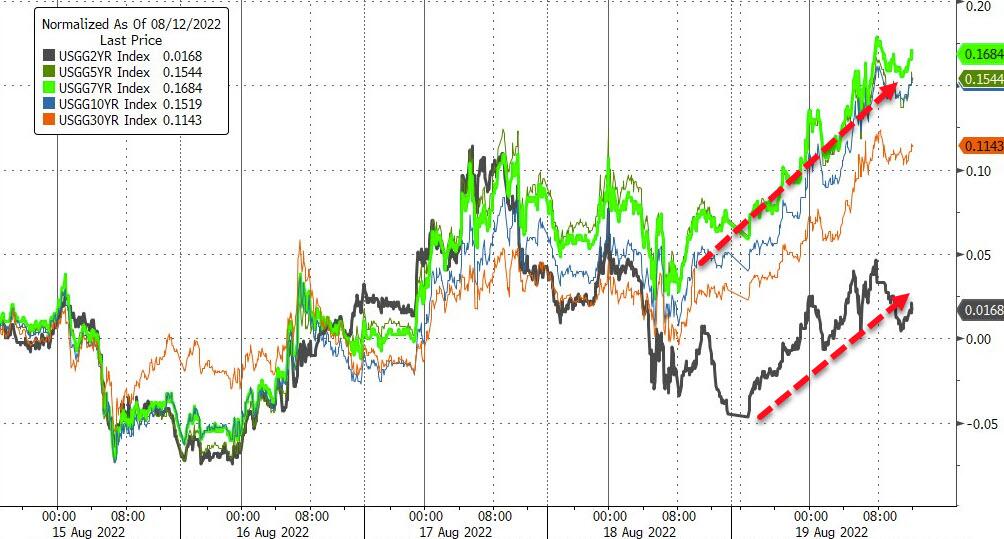
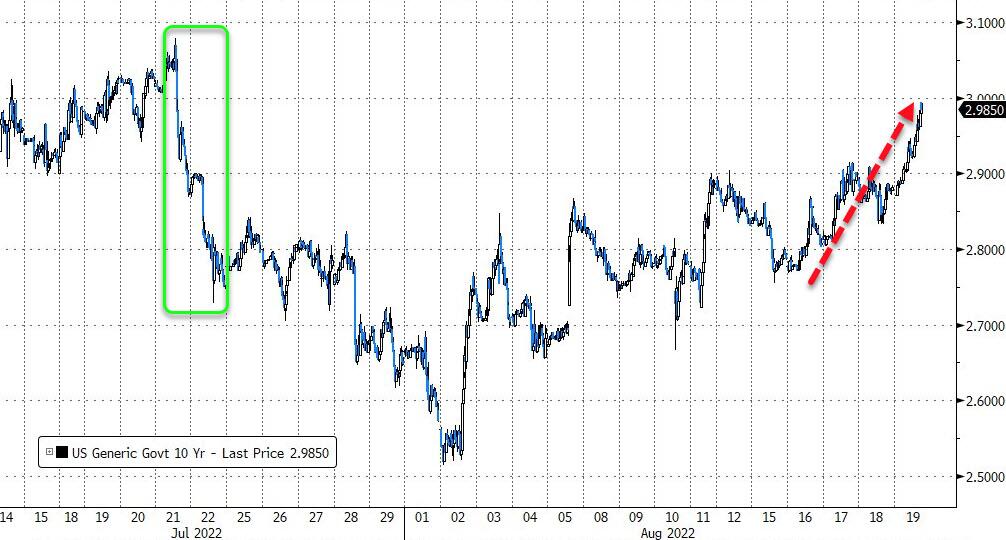
- Yields Higher following suit – 10y at 2.97…
- Large Expiry – $2T in options rolling off
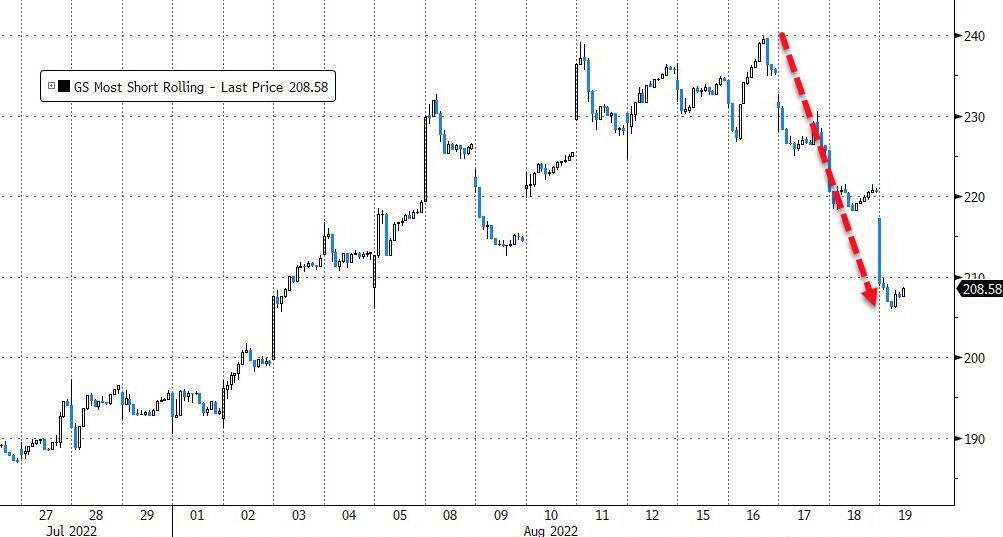
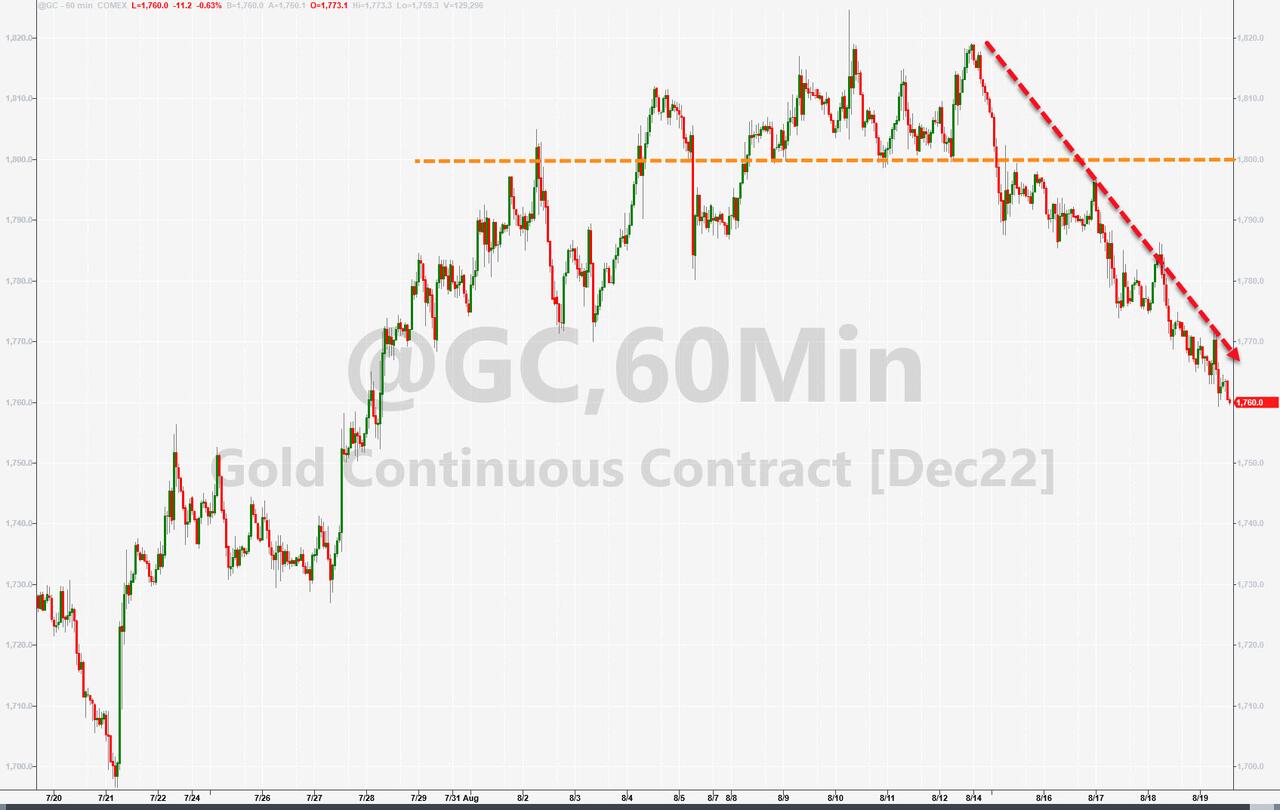
The most shorted stocks fell hard this week, as the squeeze simply evaporated, while bond yields rallied, with the 10-year almost reaching its 3% level. The US Dollar spiked and gained an amazing 2% for the week, as commodities, including gold, lagged.
Headline news pointed to one market indicator with a perfect track record, which says that stocks have bottomed…Another says they are about to plunge again. ZeroHedge summed up the discrepancy like this:
In short, we have reached a perfect quantum state of a market based on flawless backward-looking indicators, where one “100% accurate” market signpost predicts stocks melt up from here (or at worst, suffer a modest drop), while another sees stocks tumbling as much as 2,500 if not lower to a new, and far more painful low.
One of the two will see their perfect predictive track record crushed forever.
Bloomberg’s updated historic comparison chart casts a picture that clearly shows what it is that we will potentially need to guard against via the use of our exit strategy.
2. ETFs in the Spotlight
In case you missed the announcement and description of this section, you can read it here again.
It features some of the 10 broadly diversified domestic and sector ETFs from my HighVolume list as posted every Saturday. Furthermore, they are screened for the lowest MaxDD% number meaning they have been showing better resistance to temporary sell offs than all others over the past year.
The below table simply demonstrates the magnitude with which these ETFs are fluctuating above or below their respective individual trend lines (%+/-M/A). A break below, represented by a negative number, shows weakness, while a break above, represented by a positive percentage, shows strength.
For hundreds of ETF choices, be sure to reference Thursday’s StatSheet.
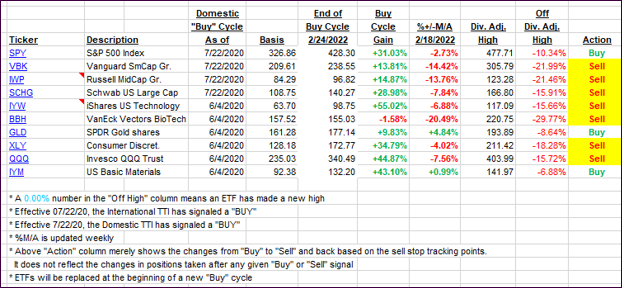
For this closed-out domestic “Buy” cycle (2/24/2022), here’s how some of our candidates have fared. Keep in mind that our Domestic Trend Tracking Index (TTI) signaled a “Sell” on that date, which overrode the existing “Buys” shown for SPY and IYM:
Click image to enlarge.
Again, the %+/-M/A column above shows the position of the various ETFs in relation to their respective long-term trend lines, while the trailing sell stops are being tracked in the “Off High” column. The “Action” column will signal a “Sell” once the -12% point has been taken out in the “Off High” column, which has replaced the prior -8% to -10% limits.
3. Trend Tracking Indexes (TTIs)
Our TTIs took a dive, and just like that the Domestic one dropped back into bear market territory, although by only a fraction. As my comments above should have made abundantly clear, we are in an era of extreme uncertainty, where directional changes can occur out of nowhere. Caution is advised.
This is how we closed 08/19/2022:
Domestic TTI: -0.11% below its M/A (prior close +1.08%)—Sell signal effective 02/24/2022.
International TTI: -5.39% below its M/A (prior close -4.64%)—Sell signal effective 03/08/2022.
Disclosure: I am obliged to inform you that I, as well as my advisory clients, own some of the ETFs listed in the above table. Furthermore, they do not represent a specific investment recommendation for you, they merely show which ETFs from the universe I track are falling within the specified guidelines.
All linked charts above are courtesy of Bloomberg via ZeroHedge.
———————————————————-
WOULD YOU LIKE TO HAVE YOUR INVESTMENTS PROFESSIONALLY MANAGED?
Do you have the time to follow our investment plans yourself? If you are a busy professional who would like to have his portfolio managed using our methodology, please contact me directly to get more details.
Contact Ulli