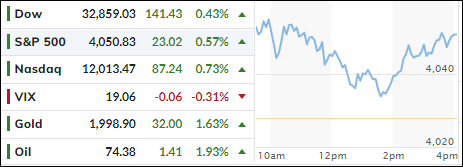
When Bad News Is Bad News

Ulli Market Commentary Contact

[Chart courtesy of MarketWatch.com]

  1. Moving the markets

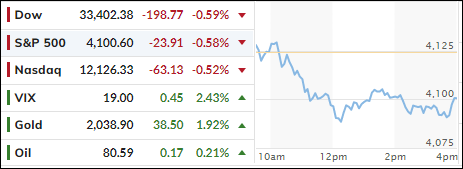
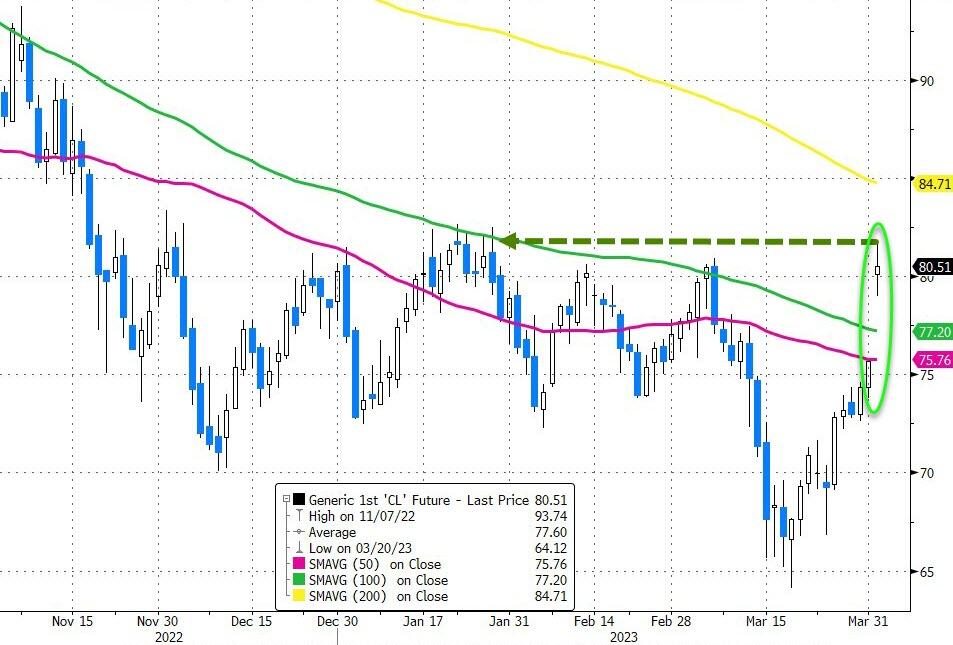
The markets pulled back right after the opening, in part due to uncertainty about yesterday’s spike in oil prices and how it might affect the global economic environment.

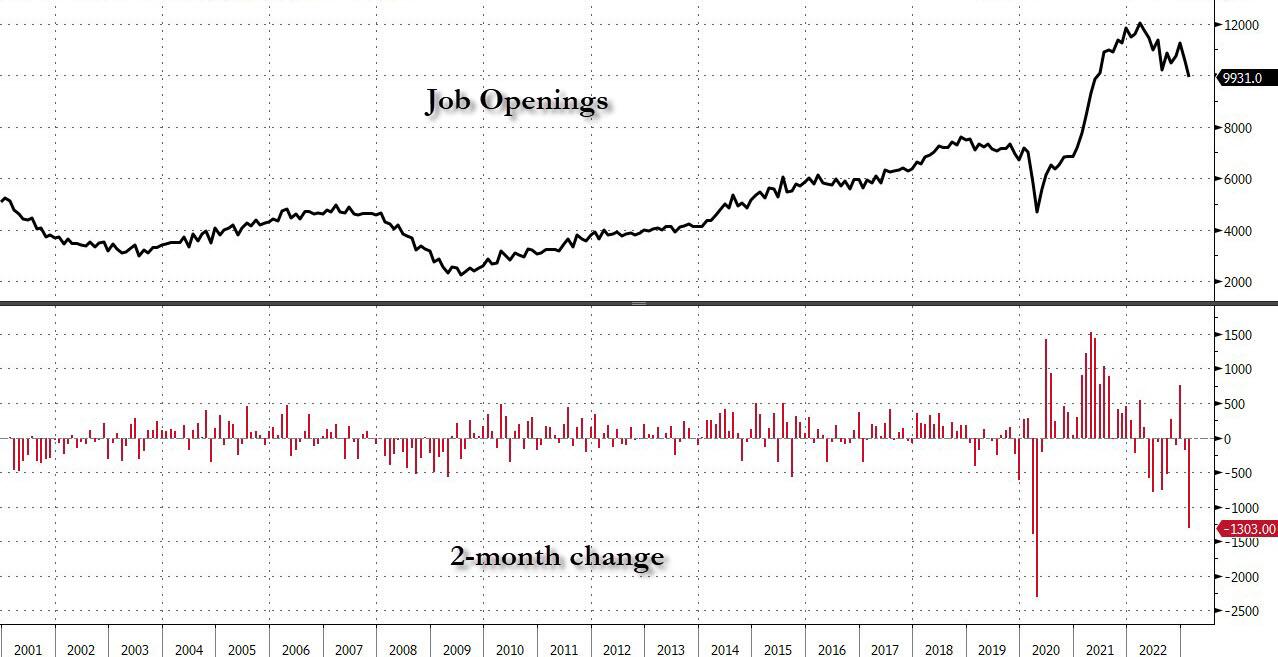
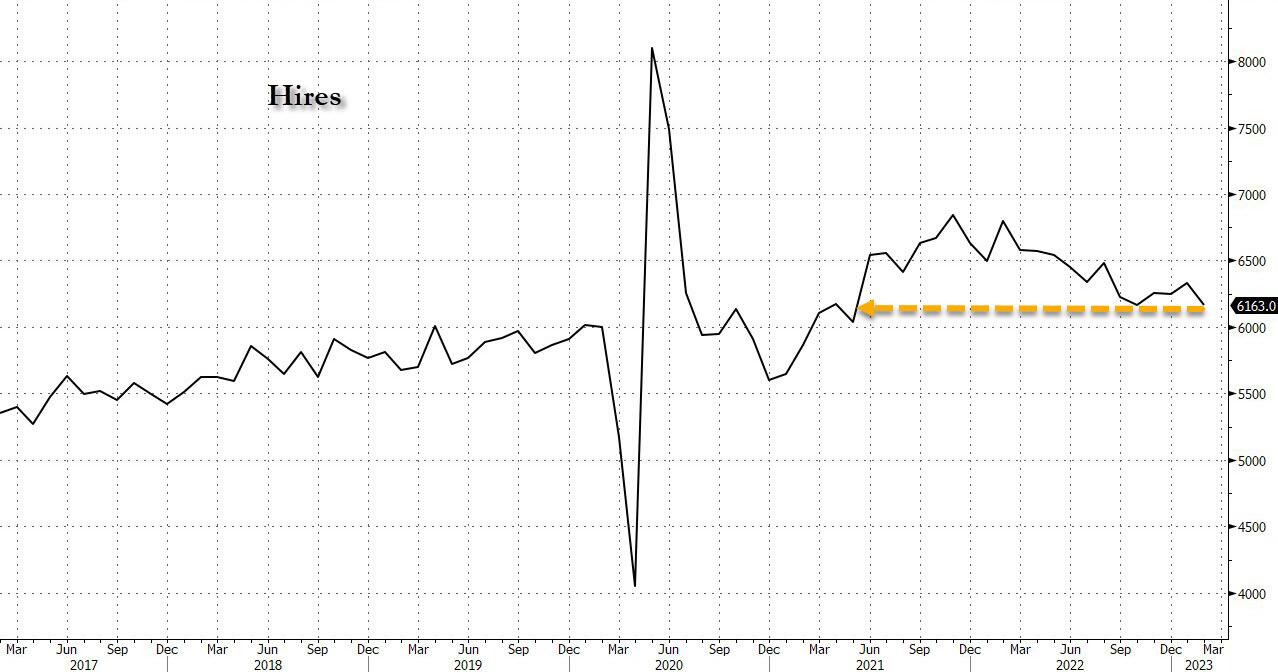
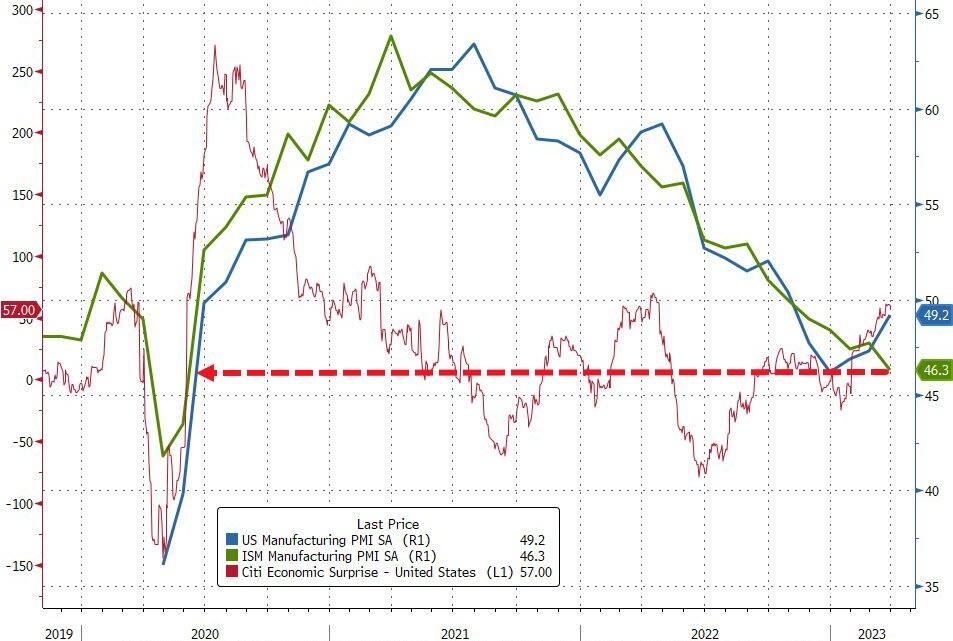
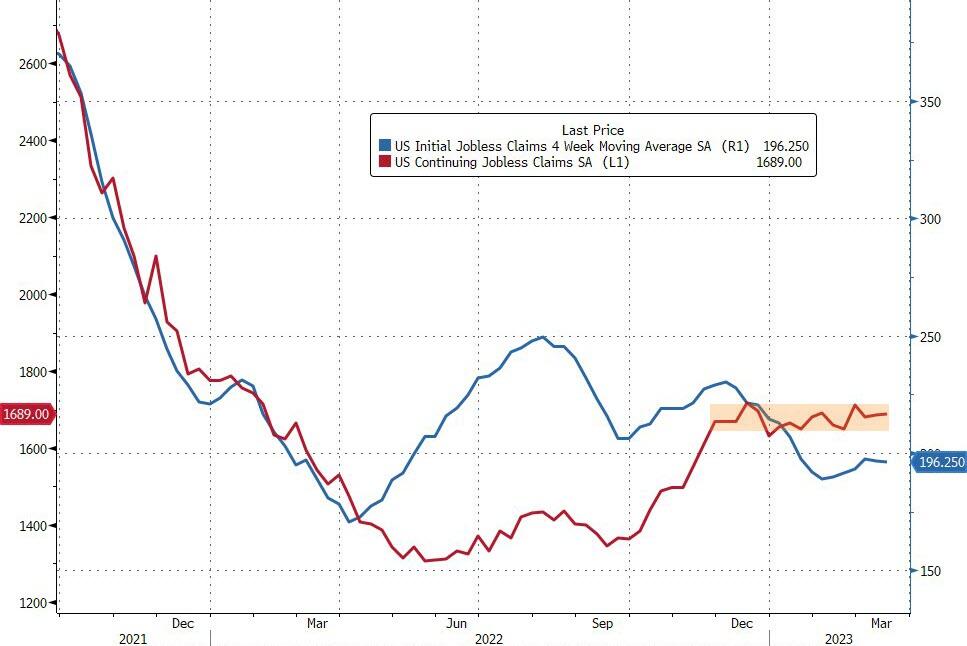
Not helping matters were a host of econ data showing that a slowdown had indeed arrived, as the Labor market appears to have fractured with job openings and new hires showing deteriorating numbers; their lowest since May 2021.

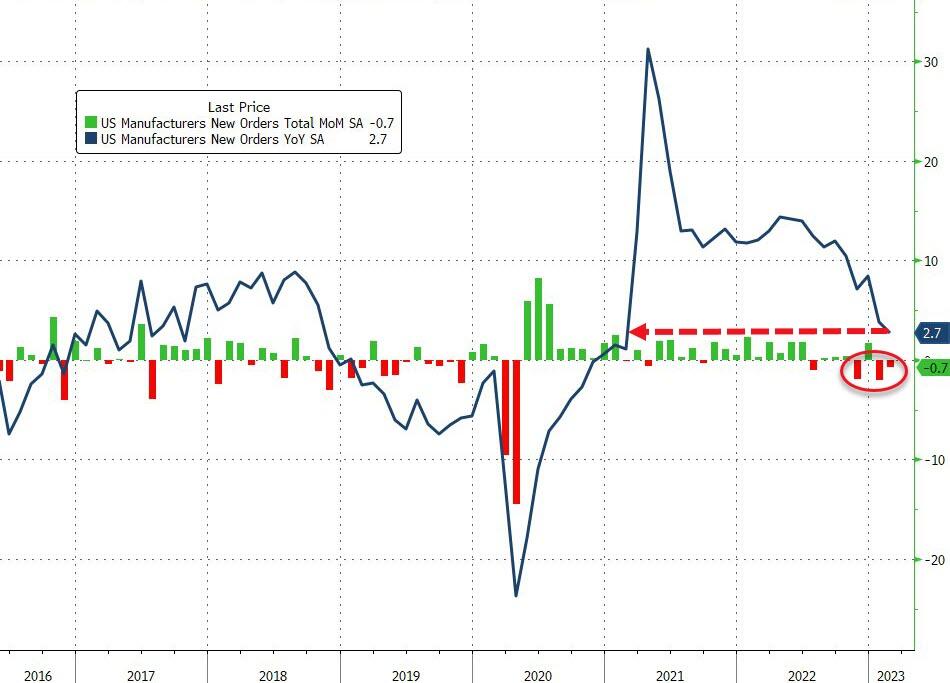
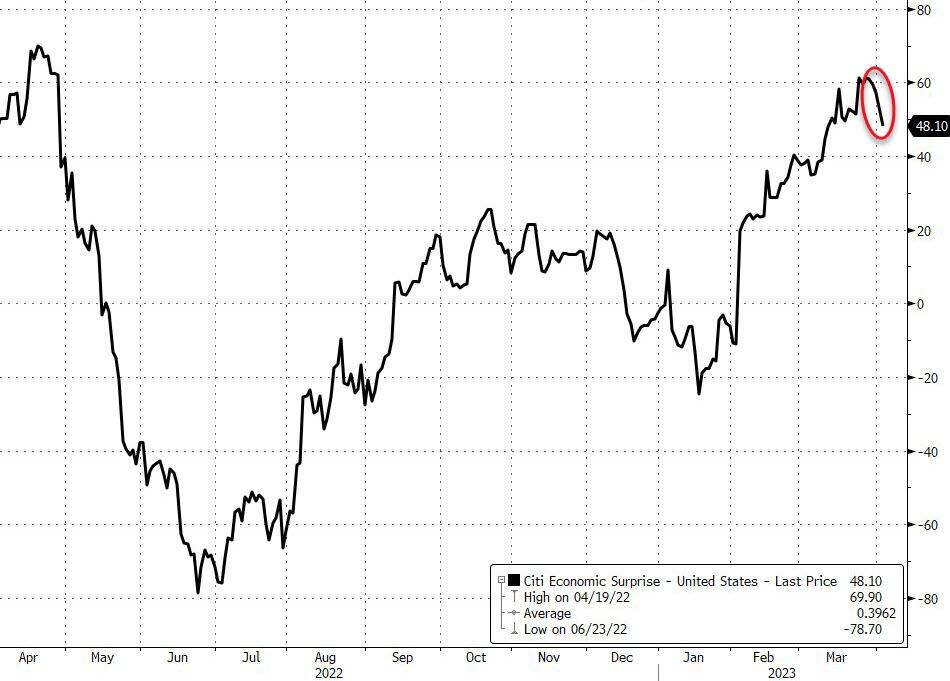
At the same time, US Factory Orders slipped to 2.7%, a number we have not seen since February 2021. The Citi economic Surprise Index shifted into reverse and, at least for the moment, the adage “bad news is good news” bit the dust.

Apparently, similar weakness was also found in other countries’ s backyards, as the Central Bank of Australia joined the Canadian one in “pausing” on rate hikes.

Hmm, does that mean the Fed will follow suit?

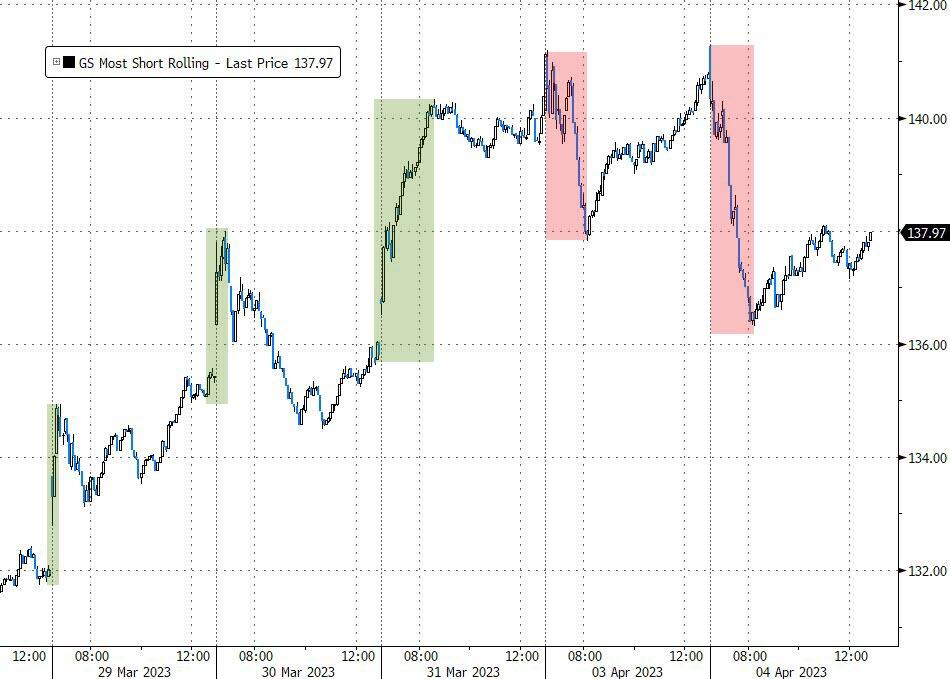
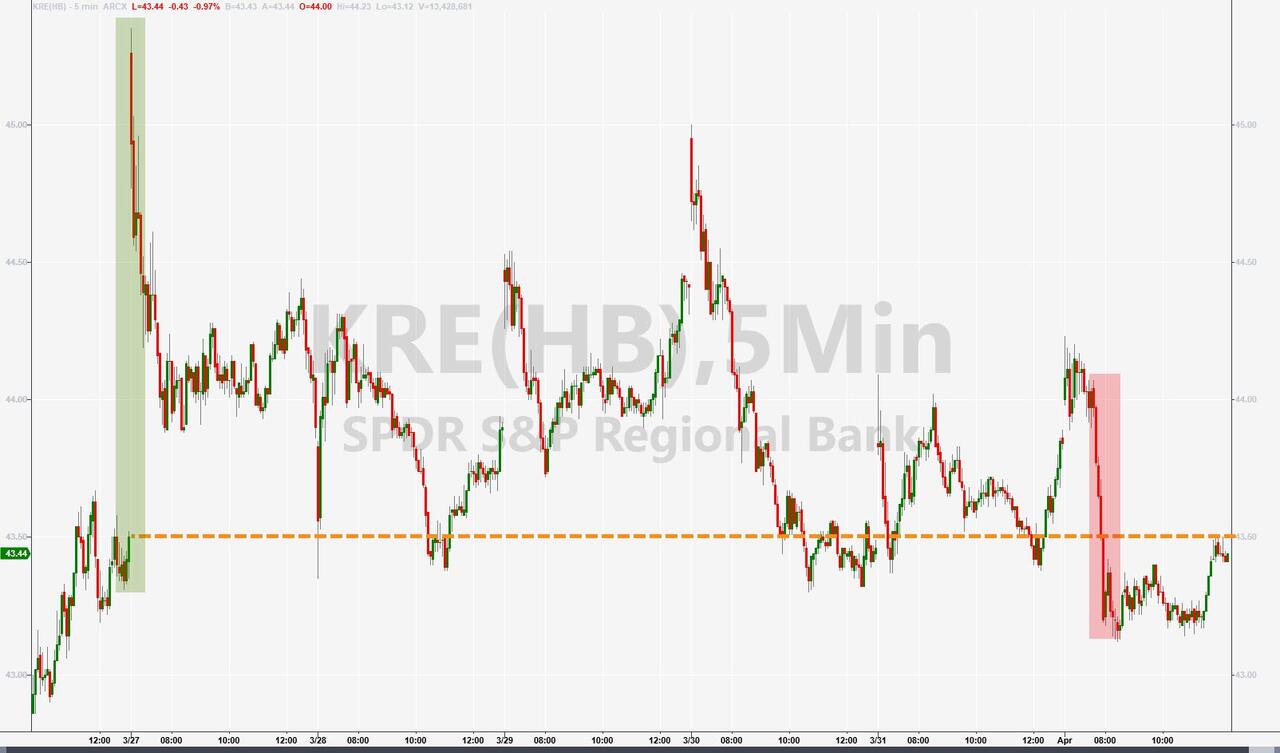
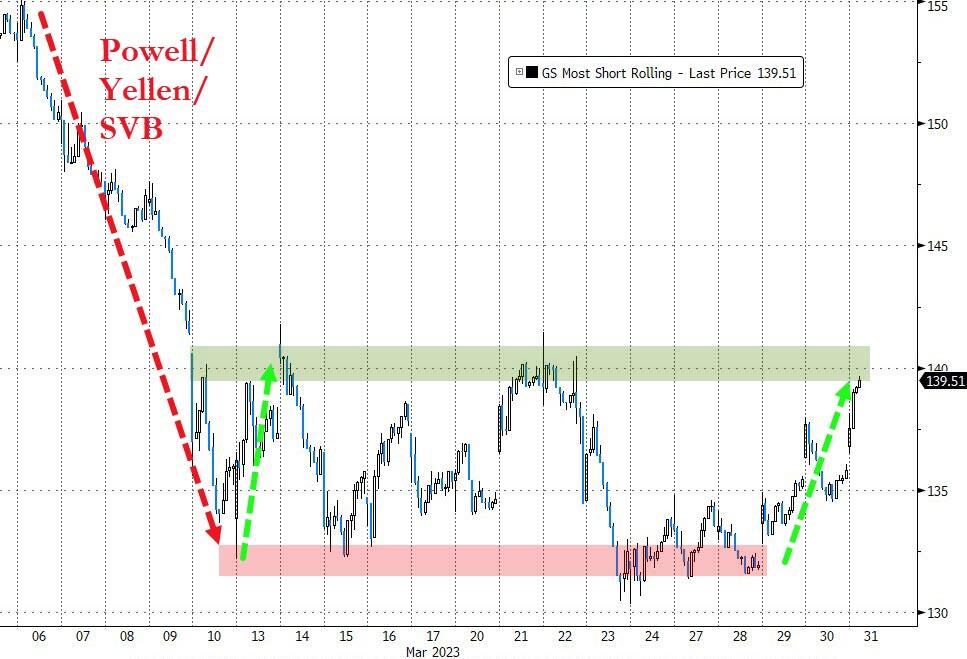
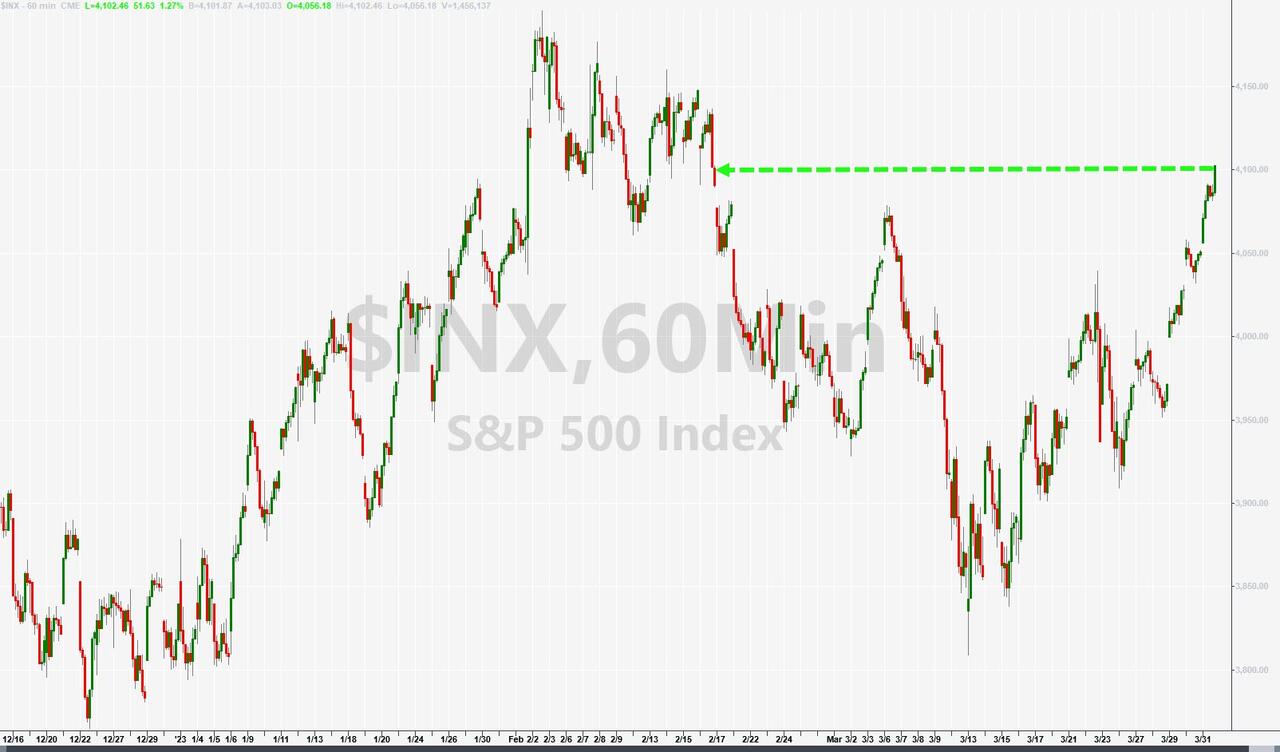
While that is not clear yet, the fallout made itself felt across a variety of markets. The major indexes only corrected moderately, as “most shorted” stocks collapsed. In other words, the squeeze play had run out of ammunition.

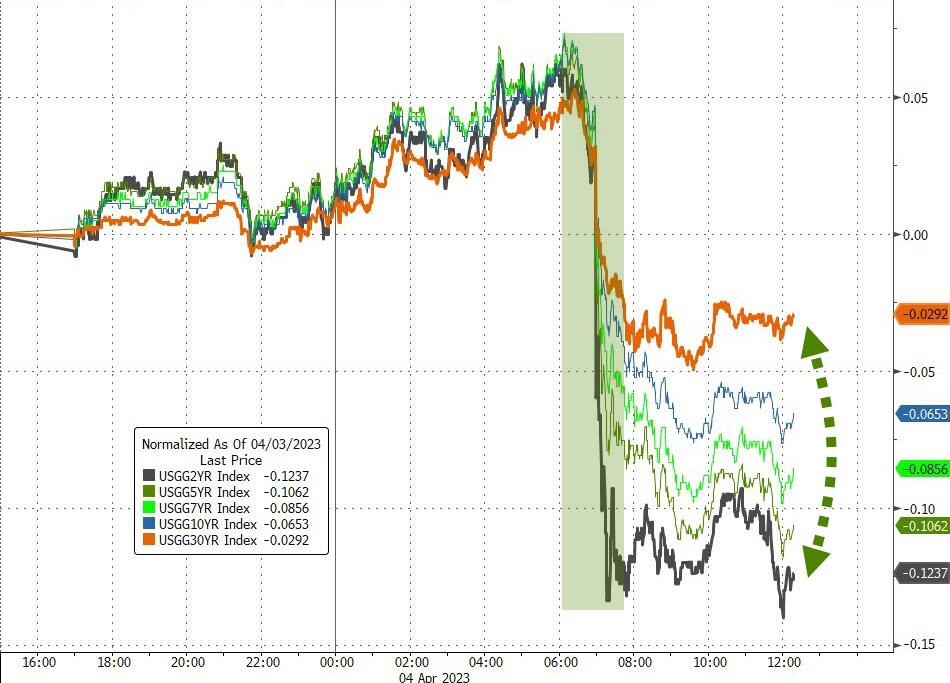
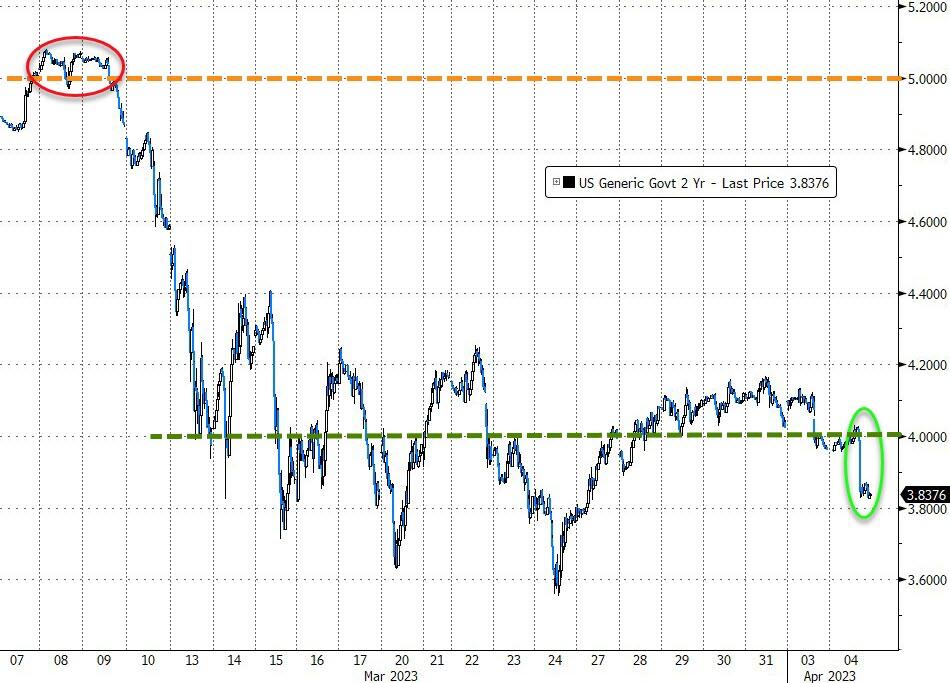
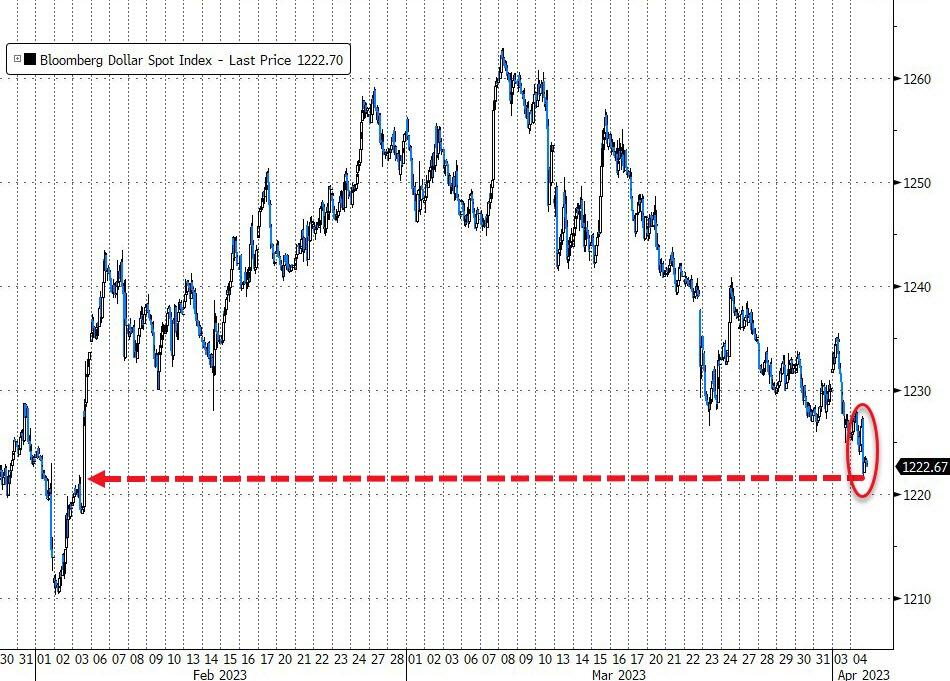
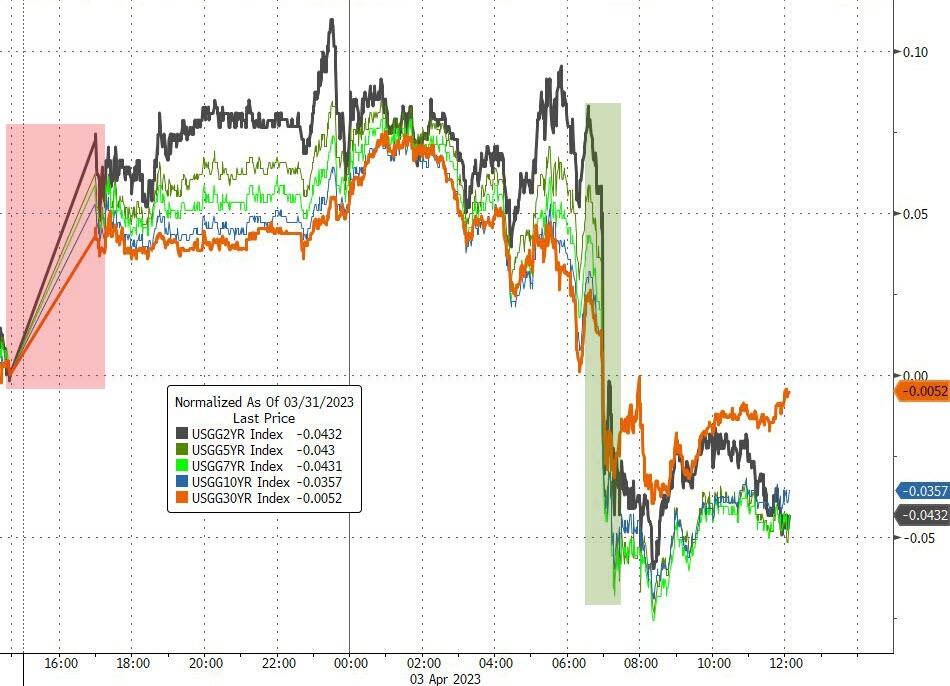
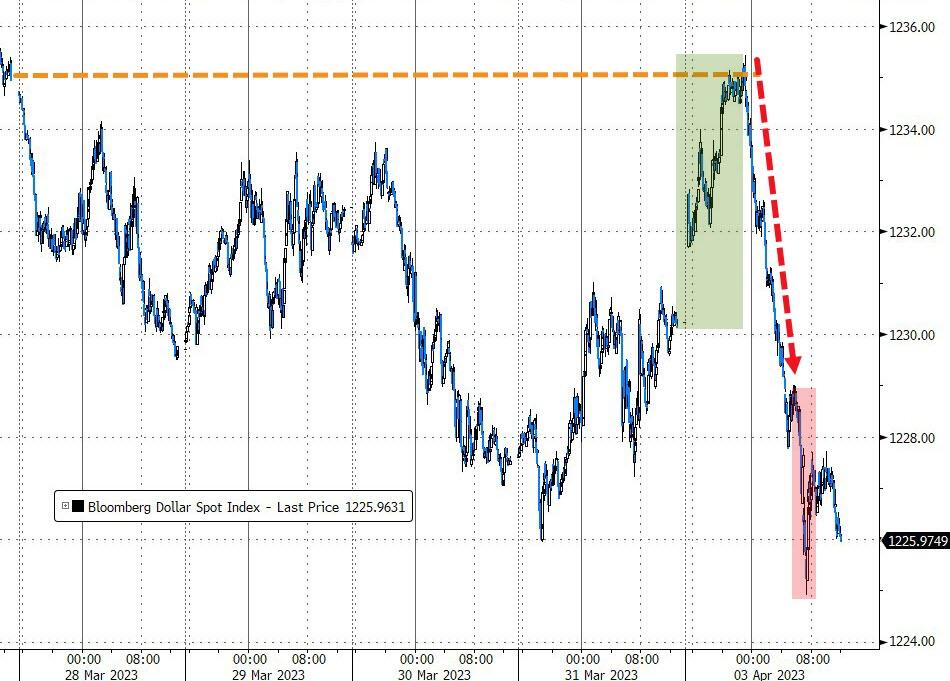
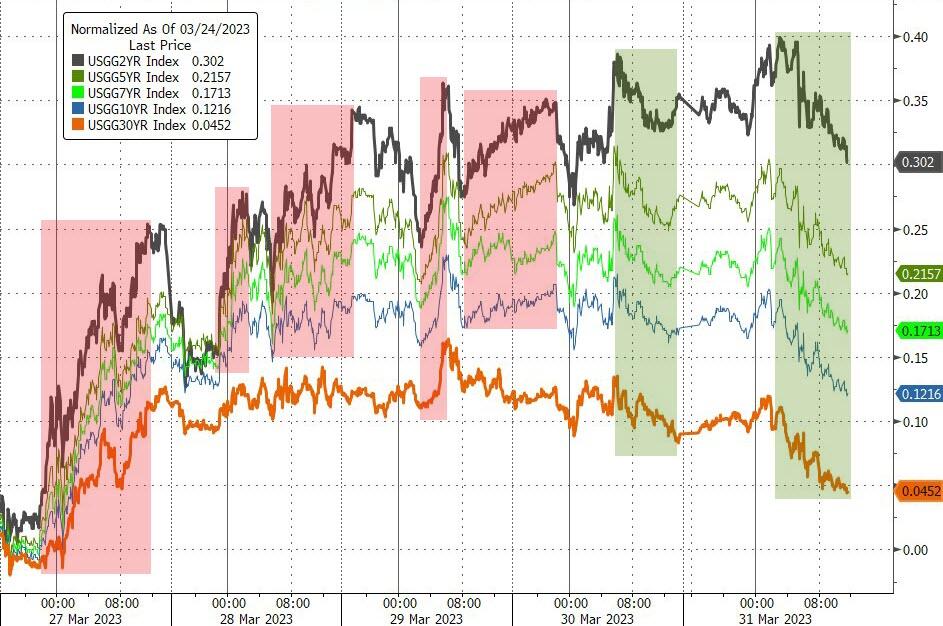
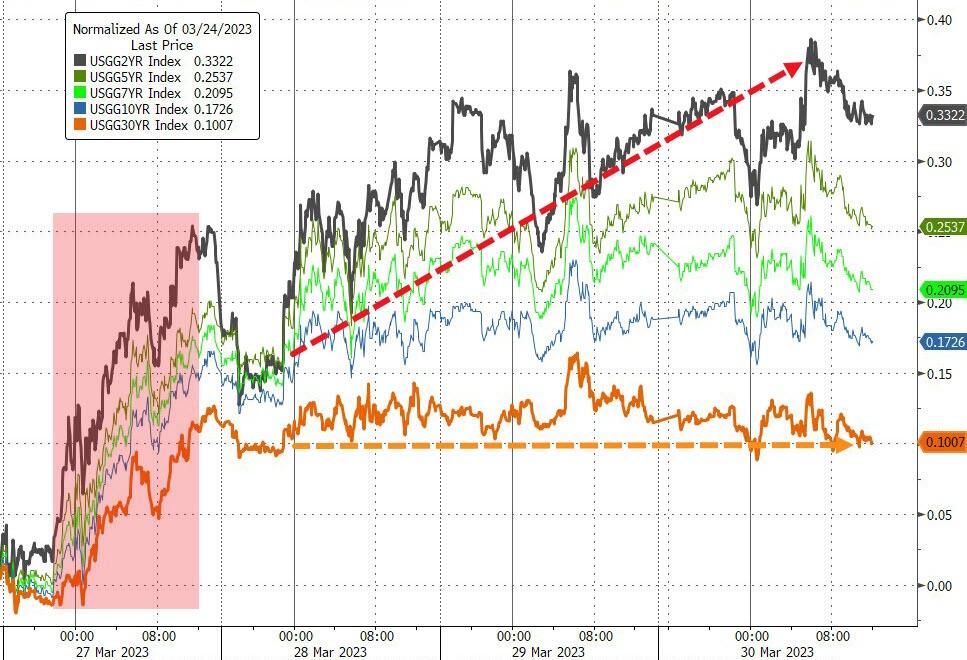
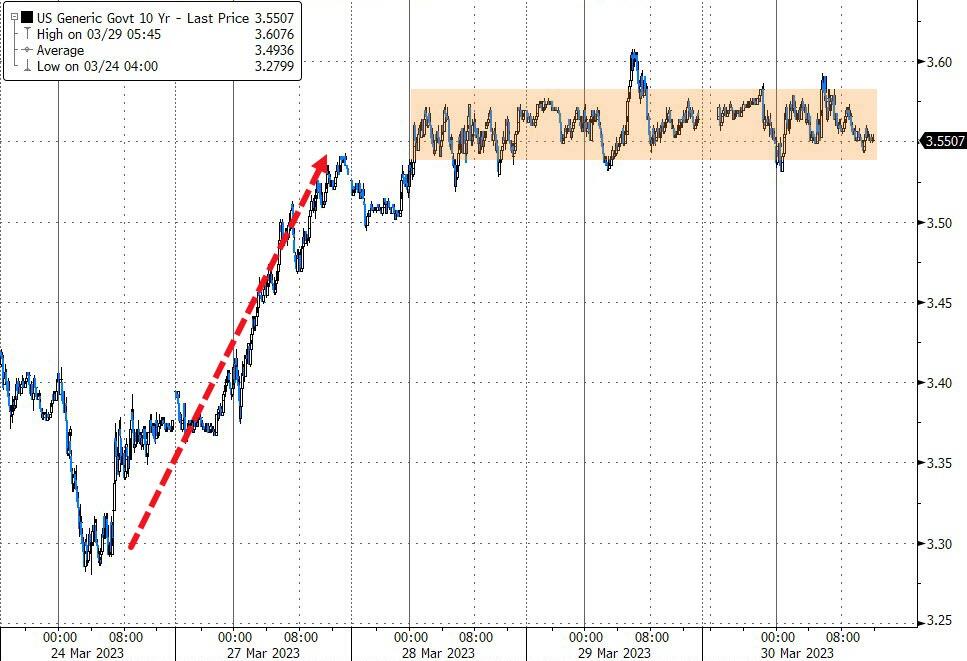
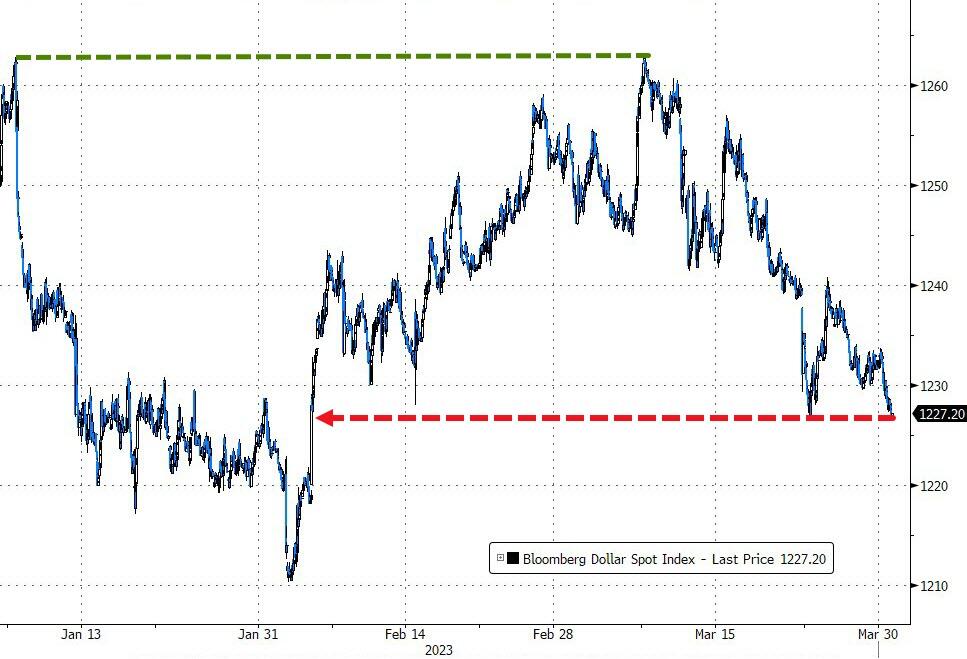
With these overwhelming weak data points, it came as no surprise that bond yields tumbled, as the 2-year “lost” its 4% level. The US Dollar succumbed to dovish news and pulled back to its 2-month lows.

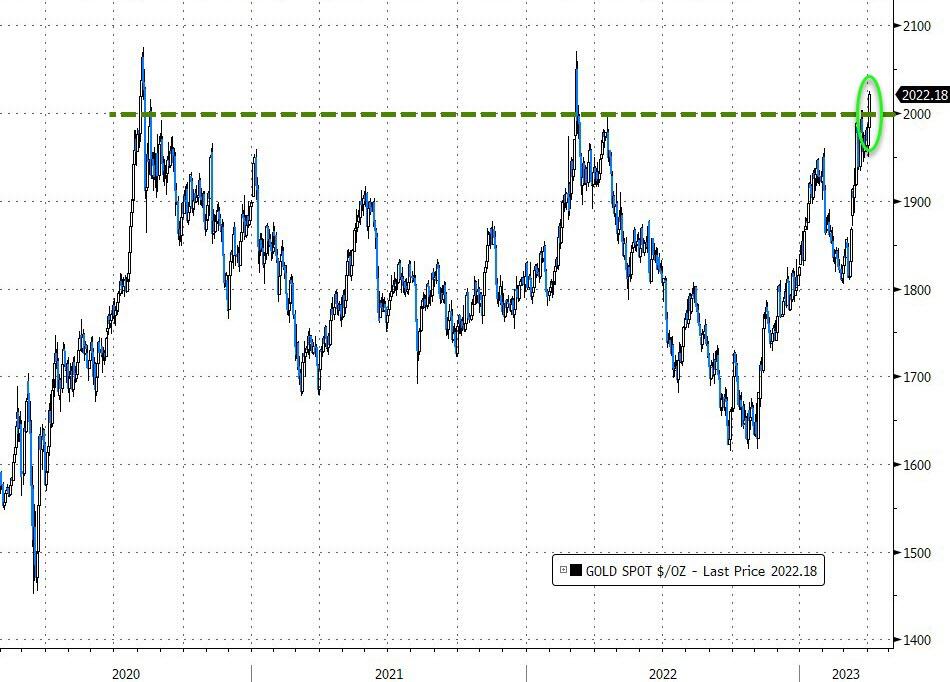
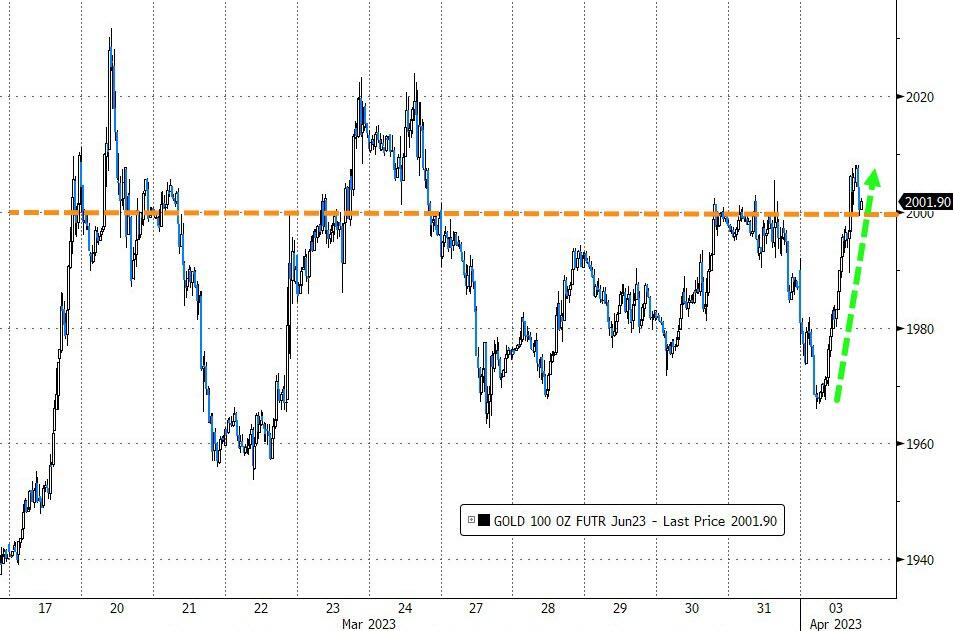
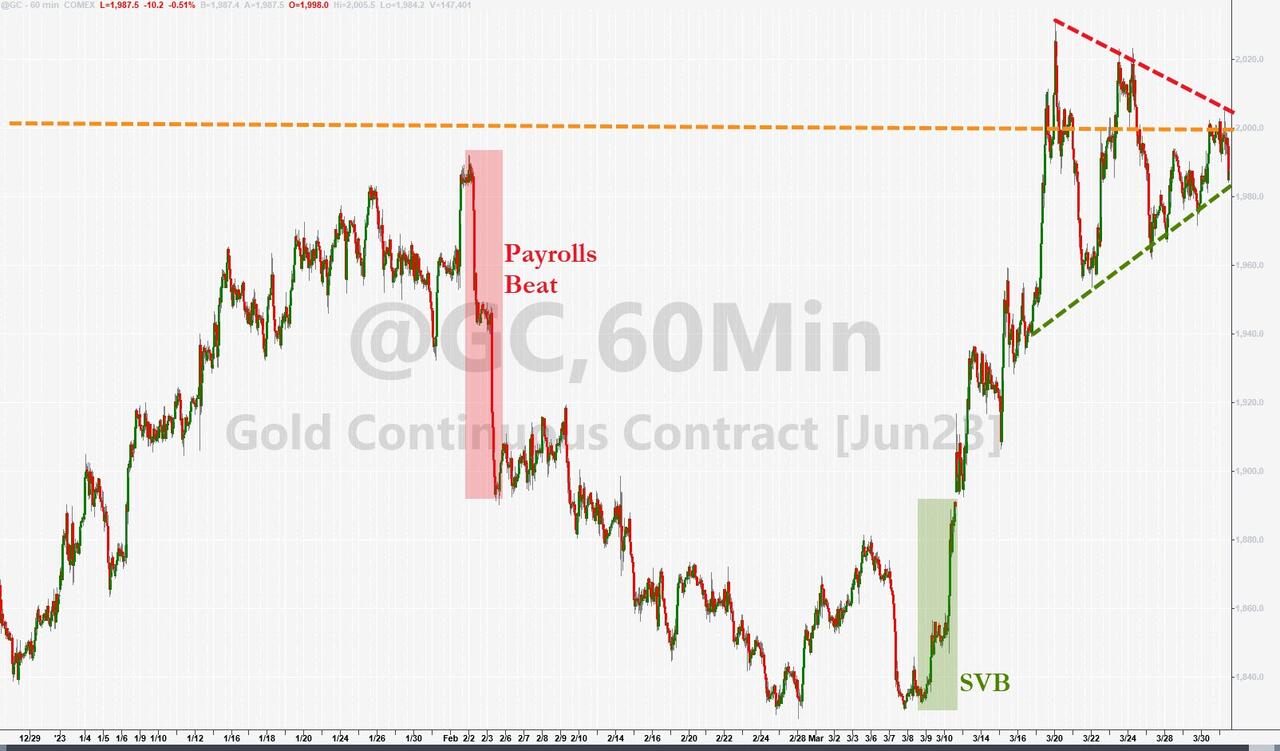
Benefiting from this unsure environment was Gold, as the precious metal stormed higher by almost 2% and closed solidly above its much fought-over $2k level at $2,039.

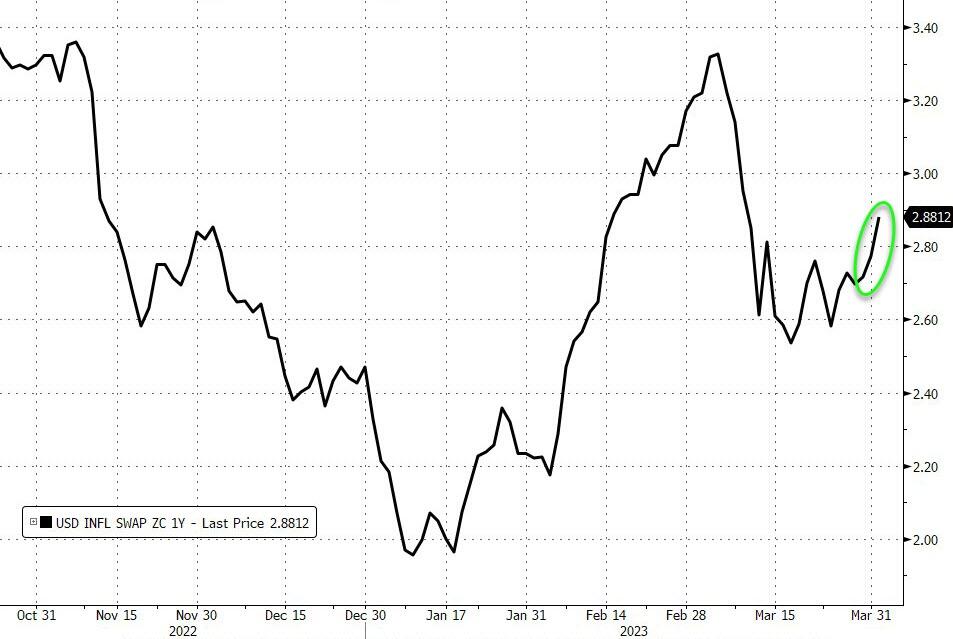
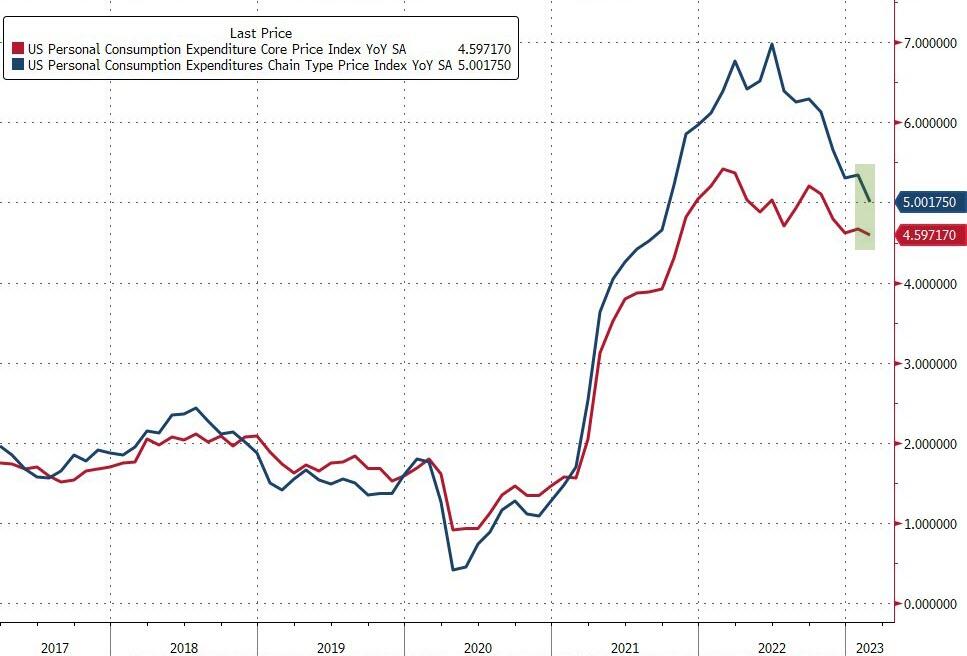
Right now, we are witnessing the worst of both worlds, namely higher inflation, due to a reduction in oil production, while a deteriorating economy warrants a bailout via lower interest rates.

That makes me ponder: Will the Fed continue its hawkish policy to save the dollar, or will they fold by pausing or lowering rates to save the economy?

Hmm…  

Read More

Oil Spike Summons Stagflation

Ulli Market Commentary Contact

[Chart courtesy of MarketWatch.com]

  1. Moving the markets

The unexpected overnight surprise came from OPEC+, which announced that they were slashing their oil output by 1.16 million barrels per day. The reaction was swift, with oil prices jumping over 6% and holding that level throughout the session.

The major indexes reacted mixed, with the Dow rallying, the Nasdaq sinking and the S&P 500 trading around its unchanged line but closing in the green. For sure, inflationary fears combined with a dampening economic effect, occupied traders’ minds, but in the end the threat was dismissed.  

But all is not rosy with markets, as analyst Ed Moya instilled some sense of reality:

This current macro backdrop isn’t conducive for a meaningful stock market rally: The economy is recession bound as the consumer is clearly weakening, lending is about to get ugly, energy cost uncertainty will remain elevated for a while, and monetary policy is finally restrictive and about to break parts of the economy.

Not helping the threat of higher inflation, and supporting a stagflationary view of the economy, was the latest manufacturing data, which dropped for the 5th straight monthly contraction to the lowest since May 2020, as ZH reported.  

Regional banks struggled again with the KRE index taking another dive, as inflation expectations jumped to 5-week highs.

Bond yields rode the rollercoaster after the reduced oil production (inflationary) pushed yields higher, only to reverse and drop sharply after the disappointing manufacturing data (deflationary) showed weakness. It was a classic tug-of-war between inflationary and deflationary forces.

The US Dollar rode a bucking bronco as well by jumping first and then collapsing, which offered Gold the chance to not only reclaim its $2k level but actually close above it.  

I am sure that the possibility of oil prices spiking, and contributing to the resurgence of inflation, after some CPI easing, will not sit well with the Fed. Expectations were for a pause in May, but the markets are now pricing in 65% odds of a 0.25% hike.

Read More

ETFs On The Cutline – Updated Through 03/31/2023

Ulli ETFs on the Cutline Contact

Below, you can evaluate the latest High-Volume ETF Cutline report, which shows how far above or below their respective long-term trend lines (39-week SMA) my currently tracked ETFs are positioned.

This report covers the HV ETF Master List from Thursday’s StatSheet and includes 312 High Volume ETFs, defined as those with an average daily volume of more than $5 million, of which currently 209 (last report: 143) are hovering in bullish territory. The yellow line separates those ETFs that are positioned above their trend line (%M/A) from those that have dropped below it.

Take a look:                                                                   

The HV ETF Master Cutline Report

In case you are not familiar with some of the terminology used in the reports, please read the Glossary of Terms. If you missed the original post about the Cutline approach, you can read it here.      

ETF Tracker Newsletter For March 21, 2023

Ulli Uncategorized Contact

ETF Tracker StatSheet          

You can view the latest version here.

ENDING THE MONTH ON A POSITIVE NOTE

[Chart courtesy of MarketWatch.com]

  1. Moving the markets

It was only three trading days ago when the S&P 500 had finally climbed back to a point where its performance was even for the month, after having been clobbered during the banking crises. 

From that moment in time, the major indexes ramped higher, as banking fears evaporated, thereby saving the month and the quarter from a dismal performance. Today’s boost came thanks to a softer reading from the Fed’s favorite inflation indicator, namely the core PCE (Personal Consumption Expenditure index).

It was expected to come in unchanged at 4.7% but instead improved a tad to its lowest since October 2021 (4.6% YoY). That was music in the ears of traders and algos alike, and the Ramp-A-Thon continued throughout the session.

After having been absent since March 28th, a short-squeeze was activated and provided the much-need firepower to close this week on a bullish note. Of course, a bull market scenario can’t live on short covering alone, real buyers are needed to support this effort over the longer term. We will find out next week if the past 3 days were indeed nothing but quarterly window dressing.

For sure, the month of March was not a smooth ride due to the failure of two reginal banks and a forced takeover of Credit Suisse. While this 3-day rally helped market sentiment, the crisis has been merely put on the backburner and could very well reappear without much warning.

Why?

Because all banks are fractionally operated, meaning they only have a portion of your money on deposit, and are therefore potential victims to sudden massive withdrawals. Bloomberg looked at where we are in this chart when considering the bigger picture, so caution is warranted in terms of the magnitude of market exposure.     

While the S&P’s comeback, and recapture of the 4,100 leve,l is indeed impressive, it’s noteworthy, as ZH pointed out, that its performance in Q1 was dominated by just 15 stocks,

Bond yields rose for the week, and Gold continued its top performance (up over 19% in the last 6 months, its best gain since 2016). The precious metal has now scored its highest quarterly close in history with a March gain of almost 9%.

With recessionary bells ringing, could this rebound be again part of the strong conviction that some “easing” by the Fed is warranted—despite their hawkish tones?

Read More

Weekly StatSheet For The ETF Tracker Newsletter – Updated Through 03/30/2023

Ulli ETF StatSheet Contact

ETF Data updated through Thursday, March 30, 2023

Methodology/Use of this StatSheet:

1. From the universe of over 1,800 ETFs, I have selected only those with a trading volume of over $5 million per day (HV ETFs), so that liquidity and a small bid/ask spread are assured.

2. Trend Tracking Indexes (TTIs)

Buy or Sell decisions for Domestic and International ETFs (section 1 and 2), are made based on the respective TTI and its position either above or below its long-term M/A (Moving Average). A crossing of the trend line from below accompanied by some staying power above constitutes a “Buy” signal. Conversely, a clear break below the line constitutes a “Sell” signal. Additionally, I use a 12% trailing stop loss on all positions in these categories to control downside risk.

3. All other investment arenas do not have a TTI and should be traded based on the position of the individual ETF relative to its own respective trend line (%M/A). That’s why those signals are referred to as a “Selective Buy.” In other words, if an ETF crosses its own trendline to the upside, a “Buy” signal is generated. Here too, I recommend trailing sell stop of 12%, or less, depending on your risk tolerance.

If you are unfamiliar with some of the terminology, please see Glossary of Terms and new subscriber information in section 9.     

1. DOMESTIC EQUITY ETFs: BUY — since 12/01/2022

Click on chart to enlarge

Our main directional indicator, the Domestic Trend Tracking Index (TTI-green line in the above chart) has reclaimed its long-term trend line (red) by +0.98% and remains in “Buy” mode for the time being.

Read More

Maintaining Altitude

Ulli Market Commentary Contact

[Chart courtesy of MarketWatch.com]

  1. Moving the markets

Again, the belief prevailed on Wall Street that the worst of the regional banking crisis is now in the rearview mirror, which caused traders and algos to push the major indexes higher for the second day in a row.

Jobless claims dropped moderately but have not gone anywhere in four months, thereby supporting hopes that the Fed might be inclined to slow down its tightening efforts, as the labor market appears to show signs of cooling, which in turn gave an assist to equities.

To me it looks like the market is getting ahead of itself by pricing in a Goldilocks scenario, in which we would see the best of both worlds: Traders expecting a recession with low rates and reduced inflation in an environment that does not negatively affect corporate earnings.

Sure, such a setting would indeed be good for equities, but I don’t think this scenario is even remotely realistic, because all banks are in similar situations like the failed ones, it just has not become public knowledge yet.

That means more systemically important institutions will have to be bailed out with money that the US Treasury doesn’t have. Therefore, dollars must be created out of thin air, and inflation will rear its ugly head again. If the Fed is serious about battling back, interest rates/bond yields will have to go considerably higher.  

These are all known cause-and-effect facts, the only unknown at this moment is the timing of it.

Despite this unbridled optimism about the banking crisis, the regional banking index KRE slipped after riding the roller coaster all day. Stocks followed suit with one Fed governor spewing hawkish words while another walked back the tough talk with some dovish tones, which pulled equities out of their midday slide.

Bond yields slipped a tad, with the 10-year continuing its 3-day sideways pattern. The US Dollar fell to its lowest close since February 3rd, while Gold ripped higher by +1.63% and stopping just short of its $2k level.  

Read More