
- Moving the markets
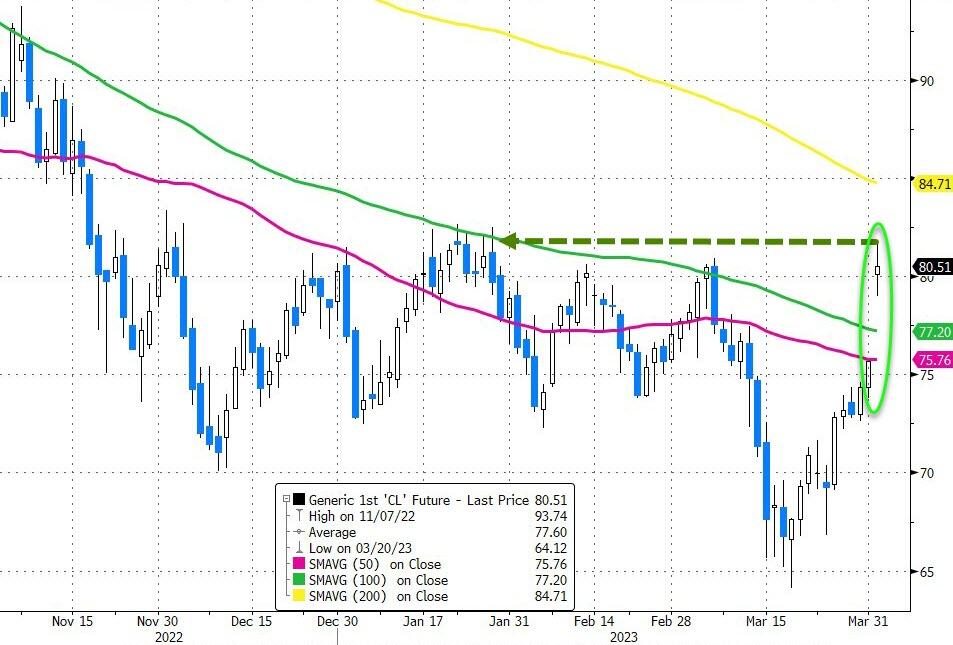
The unexpected overnight surprise came from OPEC+, which announced that they were slashing their oil output by 1.16 million barrels per day. The reaction was swift, with oil prices jumping over 6% and holding that level throughout the session.
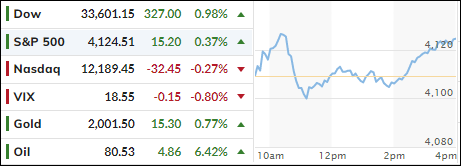
The major indexes reacted mixed, with the Dow rallying, the Nasdaq sinking and the S&P 500 trading around its unchanged line but closing in the green. For sure, inflationary fears combined with a dampening economic effect, occupied traders’ minds, but in the end the threat was dismissed.
But all is not rosy with markets, as analyst Ed Moya instilled some sense of reality:
This current macro backdrop isn’t conducive for a meaningful stock market rally: The economy is recession bound as the consumer is clearly weakening, lending is about to get ugly, energy cost uncertainty will remain elevated for a while, and monetary policy is finally restrictive and about to break parts of the economy.
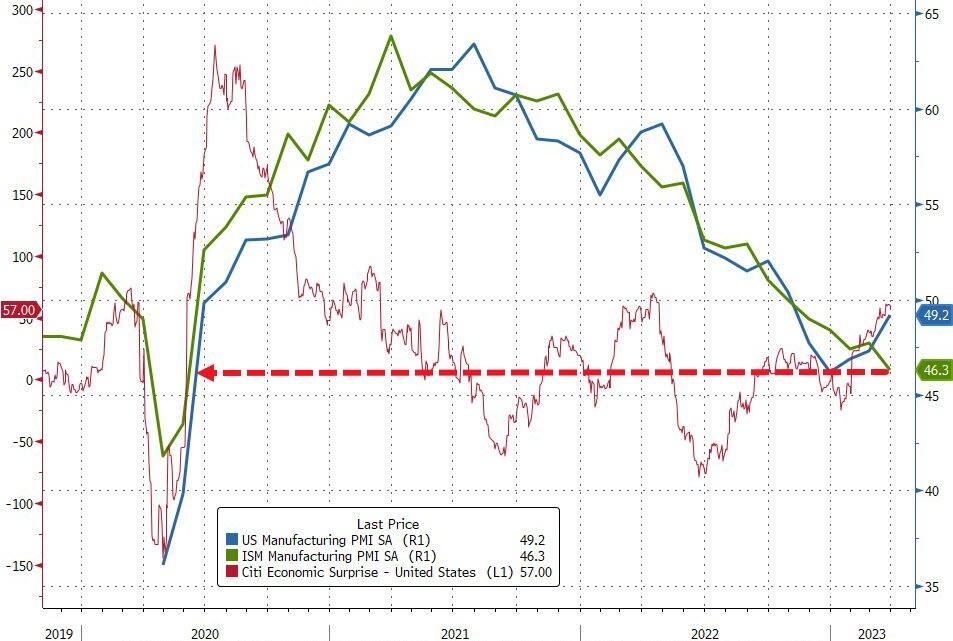
Not helping the threat of higher inflation, and supporting a stagflationary view of the economy, was the latest manufacturing data, which dropped for the 5th straight monthly contraction to the lowest since May 2020, as ZH reported.
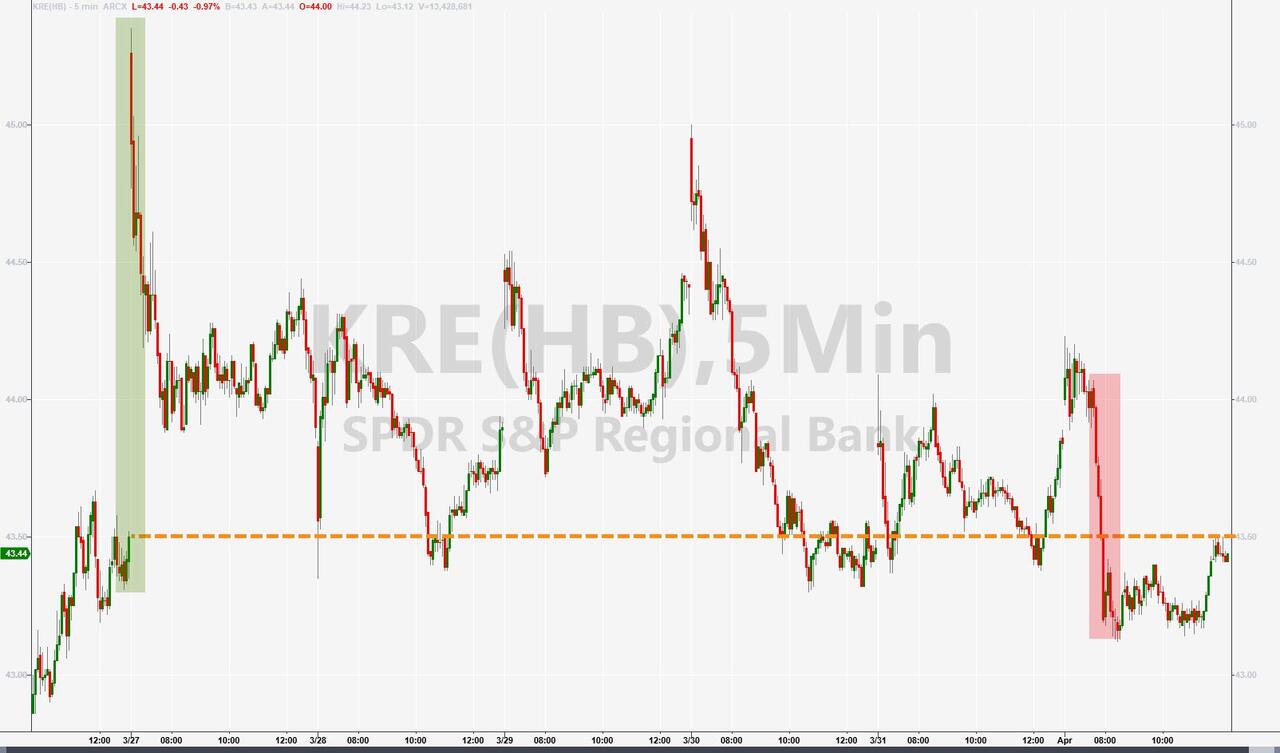
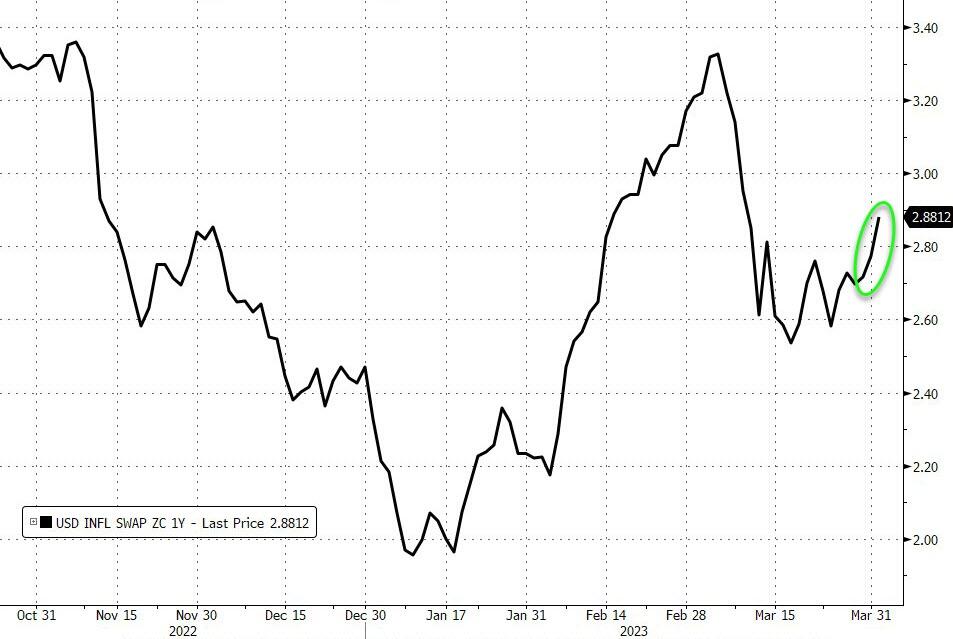
Regional banks struggled again with the KRE index taking another dive, as inflation expectations jumped to 5-week highs.
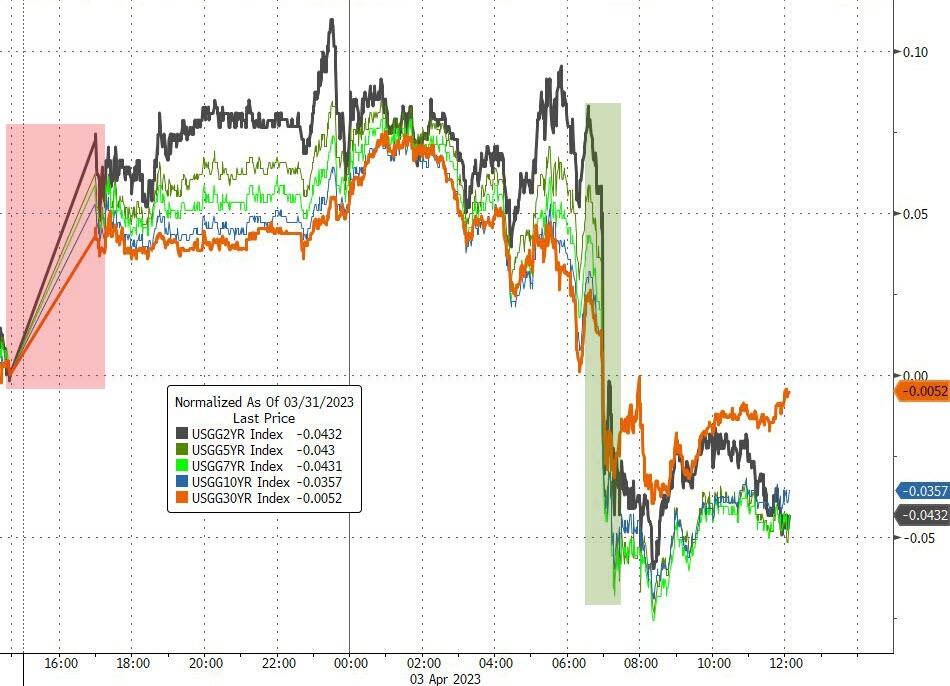
Bond yields rode the rollercoaster after the reduced oil production (inflationary) pushed yields higher, only to reverse and drop sharply after the disappointing manufacturing data (deflationary) showed weakness. It was a classic tug-of-war between inflationary and deflationary forces.
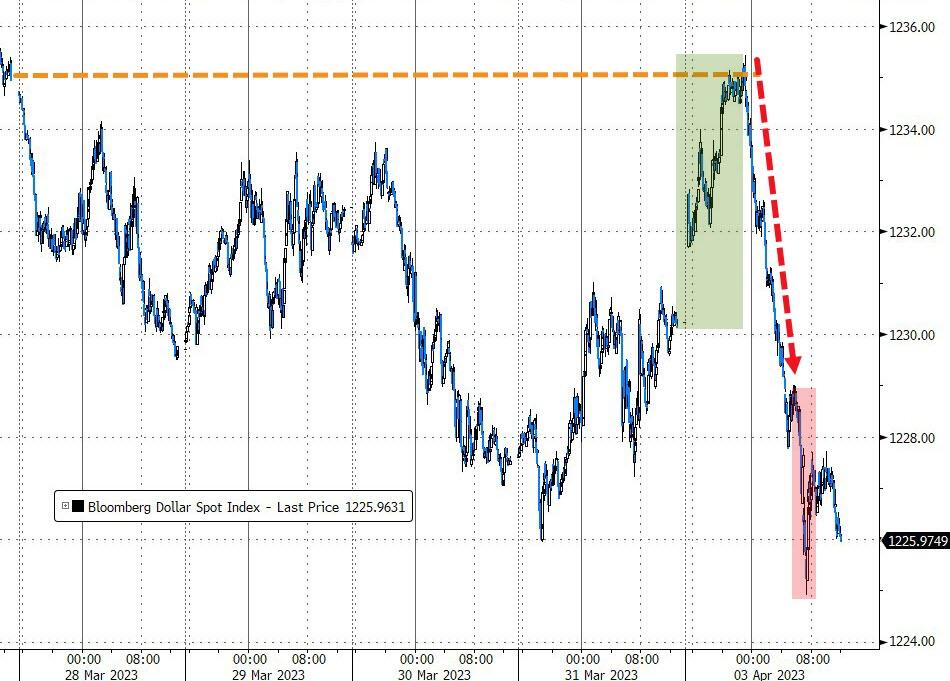
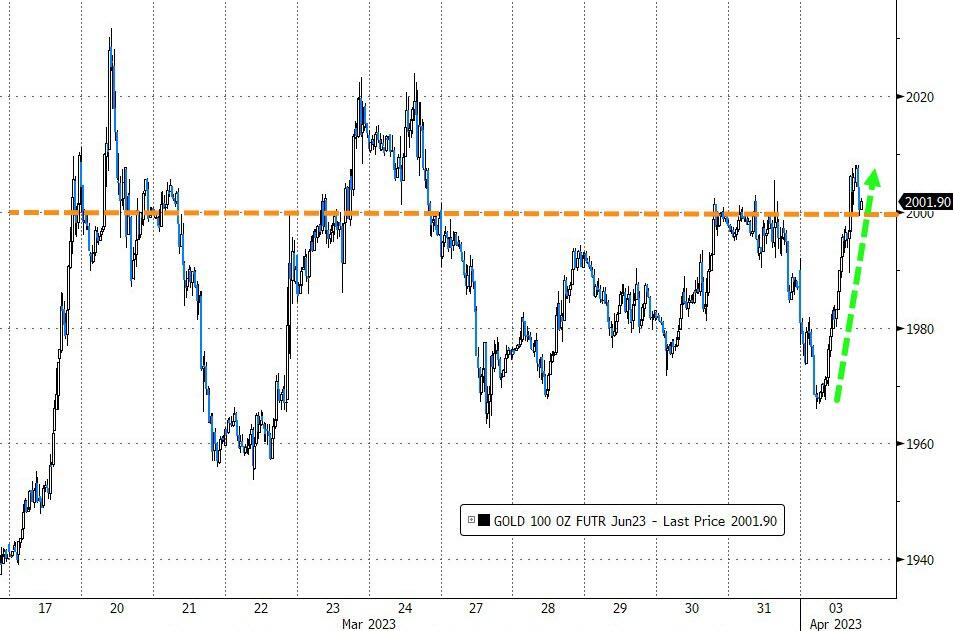
The US Dollar rode a bucking bronco as well by jumping first and then collapsing, which offered Gold the chance to not only reclaim its $2k level but actually close above it.
I am sure that the possibility of oil prices spiking, and contributing to the resurgence of inflation, after some CPI easing, will not sit well with the Fed. Expectations were for a pause in May, but the markets are now pricing in 65% odds of a 0.25% hike.
2. “Buy” Cycle Suggestions
For the current Buy cycle, which started on 12/1/2022, I suggested you reference my then current StatSheet for ETF selections. However, if you came on board later, you may want to look at the most recent version, which is published and posted every Thursday at 6:30 pm PST.
I also recommend you consider your risk tolerance when making your selections by dropping down more towards the middle of the M-Index rankings, should you tend to be more risk adverse. Likewise, a partial initial exposure to the markets, say 33% to start with, will reduce your risk in case of a sudden directional turnaround.
We are living in times of great uncertainty, with economic fundamentals steadily deteriorating, which will eventually affect earnings negatively and, by association, stock prices.
In my advisor’s practice, we are therefore looking for limited exposure in value, some growth and dividend ETFs. Of course, gold has been a core holding for a long time.
With all investments, I recommend the use of a trailing sell stop in the range of 8-12% to limit your downside risk.
3. Trend Tracking Indexes (TTIs)
As a result of OPEC+ reducing their daily output the indexes were swinging wildly, but in the end, calm was restored, and we closed moderately in the green.
This is how we closed 04/03/2023:
Domestic TTI: +2.35% above its M/A (prior close +2.27%)—Buy signal effective 12/1/2022.
International TTI: +7.77% above its M/A (prior close +7.02%)—Buy signal effective 12/1/2022.
All linked charts above are courtesy of Bloomberg via ZeroHedge.
Contact Ulli