
- Moving the markets
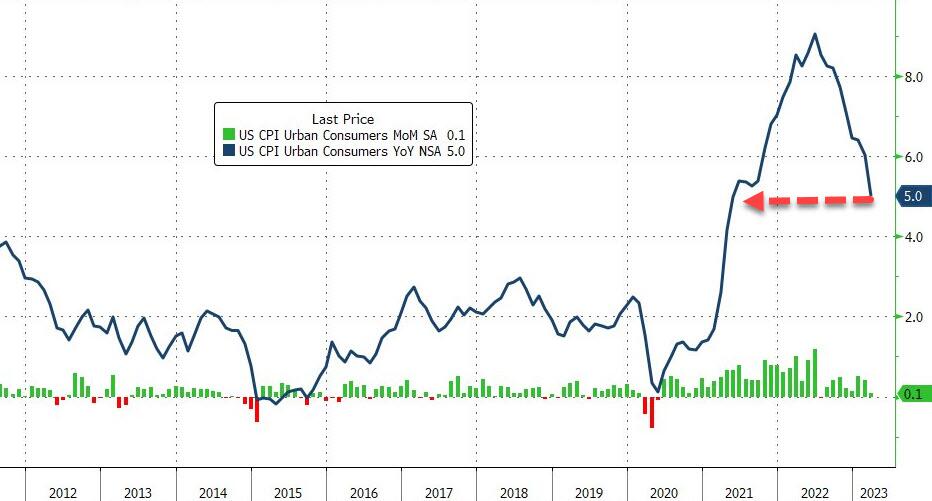
Despite the CPI turning out a bit “cooler” than expected, with the headline number printing +0.1% MoM and +5.0% YoY vs. 5.1% anticipated—and down from 6% YoY prior—the reaction was lukewarm at best.
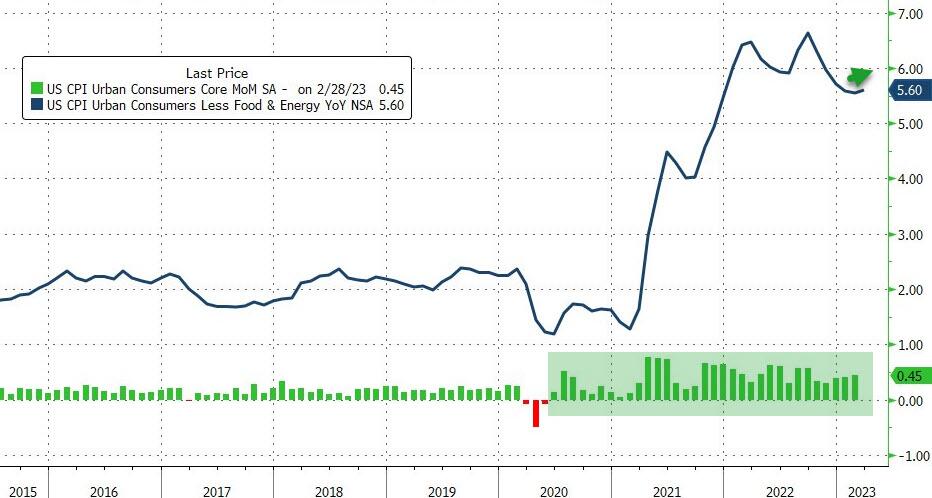
The Fed’s favorite core CPI rose 0.4% MoM, in line with expectations, but it pushed the index up 5.6% YoY, up from a prior 5.5%, as ZH reported.
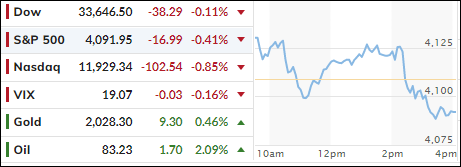
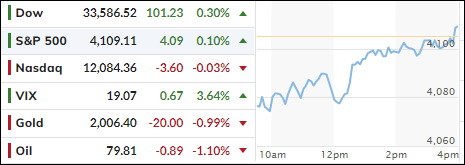
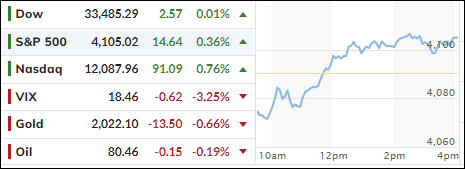
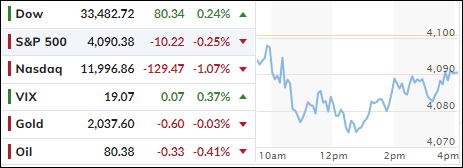
The market’s initial reaction was positive, yet after an early rally, the major indexes retreated, only to rebound at midday, after which a sudden decline across the board pushed all three of them into the red.
This kind of directional indecision appears to have been caused by the Fed’s release of the March minutes, which showed that officials were alarmed that the economy could slip into a mild recession later this year, with a potential recovery slated over the subsequent two years.
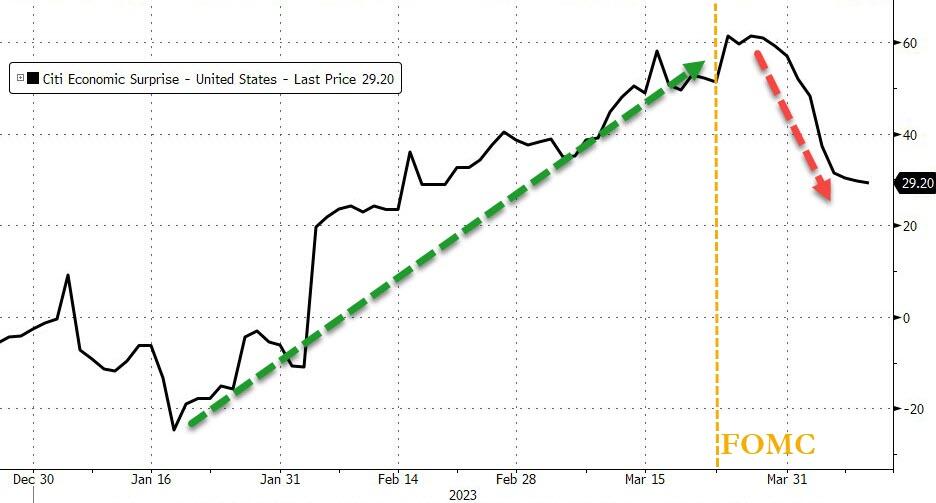
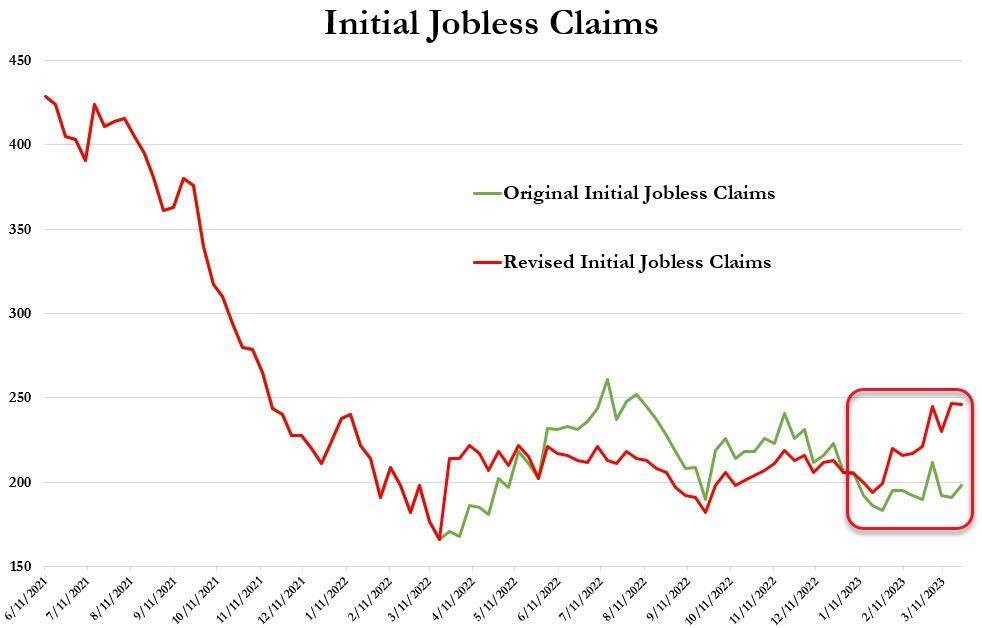
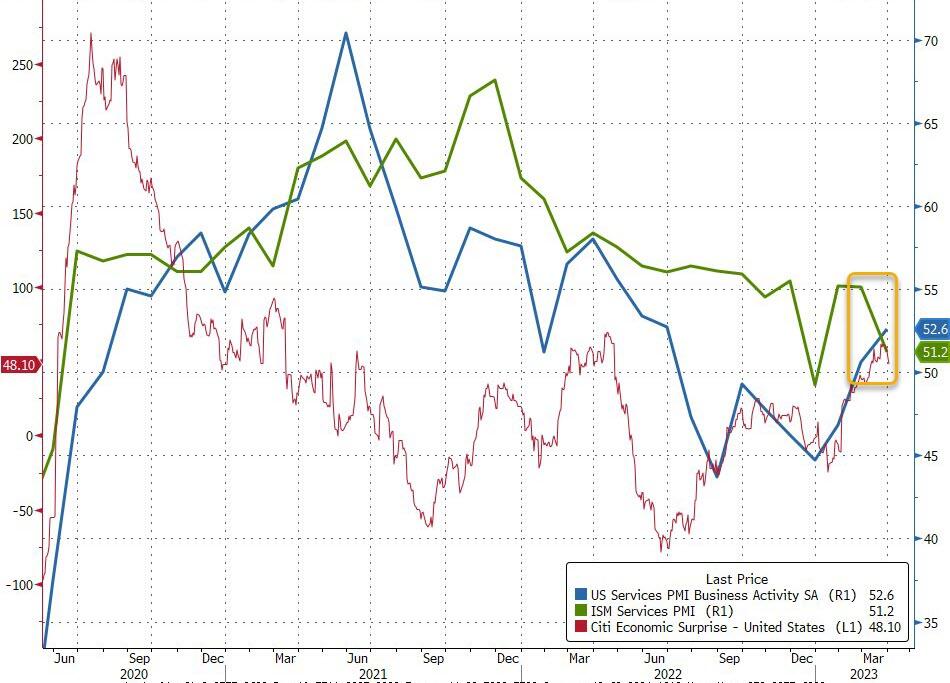
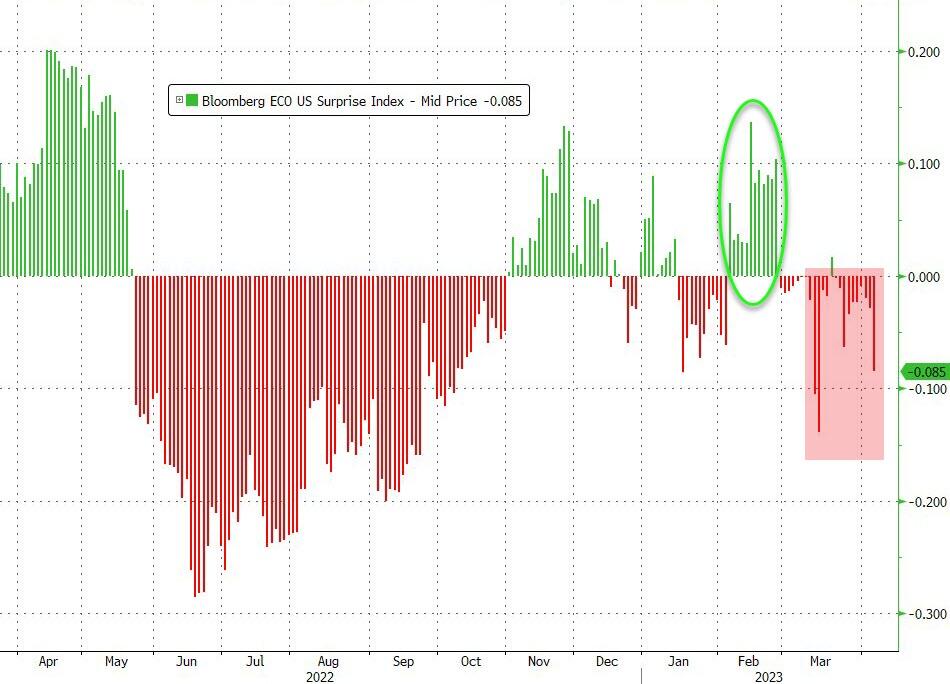
The Citi Economic Surprise index seems to confirm the fact that not all is well with the domestic economy, as the banking crisis, which is far from being over, has done its part to make the current environment appear to be not up to par.
Not helping the bulls to gain momentum were a couple of Fed mouthpieces singing from the same hymn sheet from a month ago that “policy makers have more work to do,” and “there are good reasons to think that policy may have to tighten more to bring inflation down,” along similar bon mots.
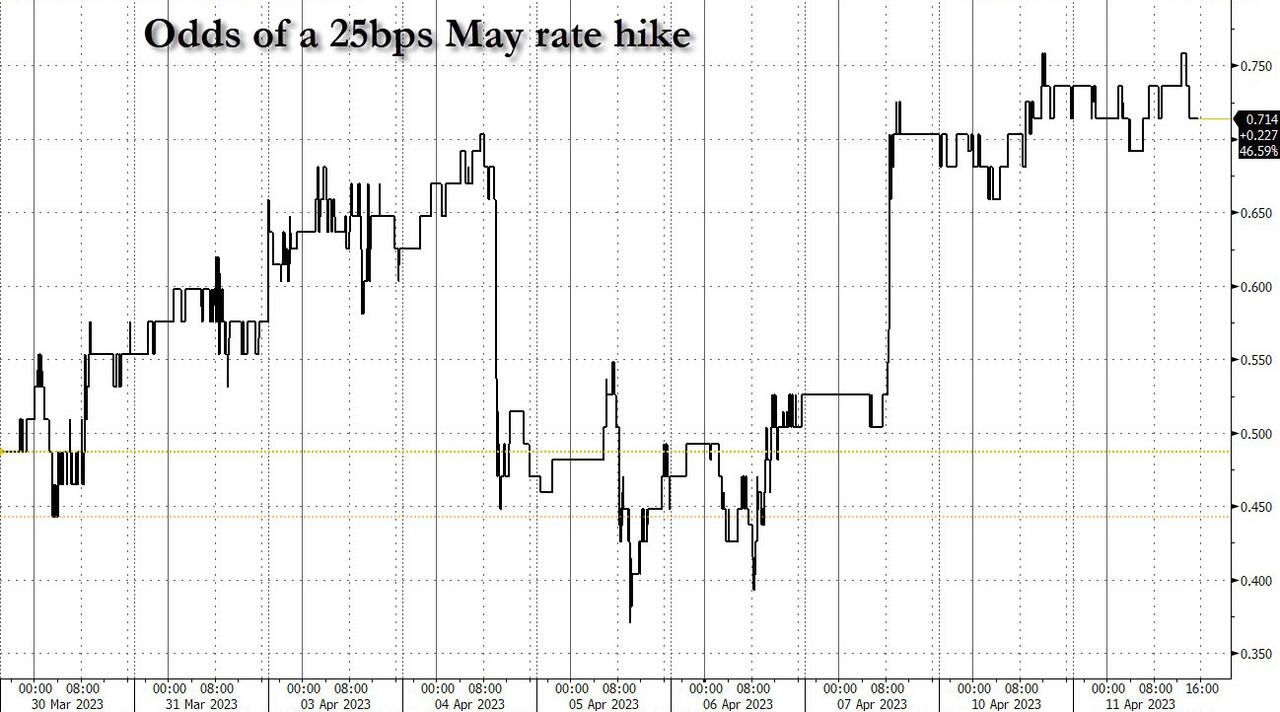
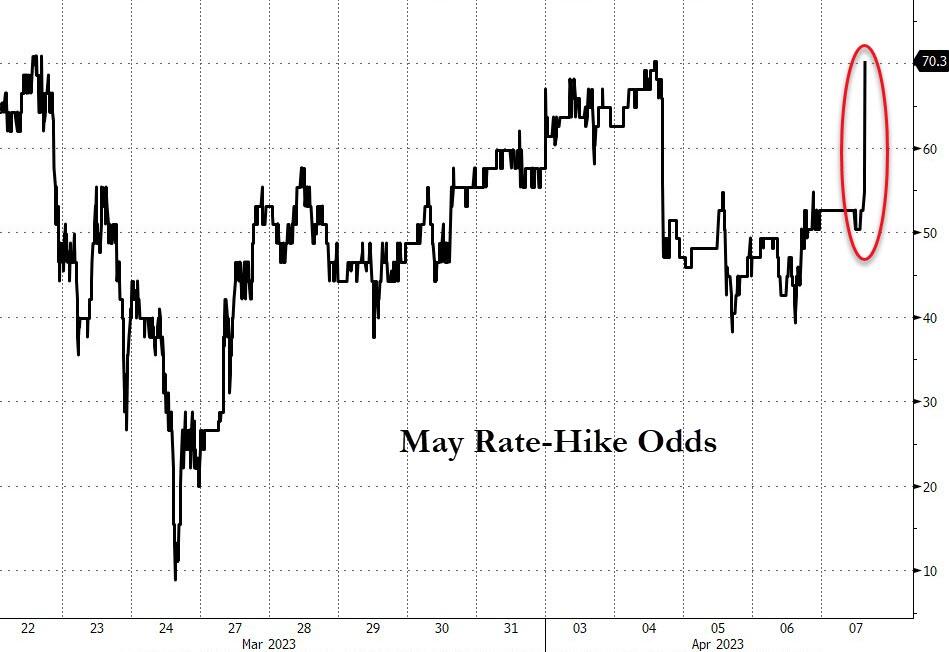
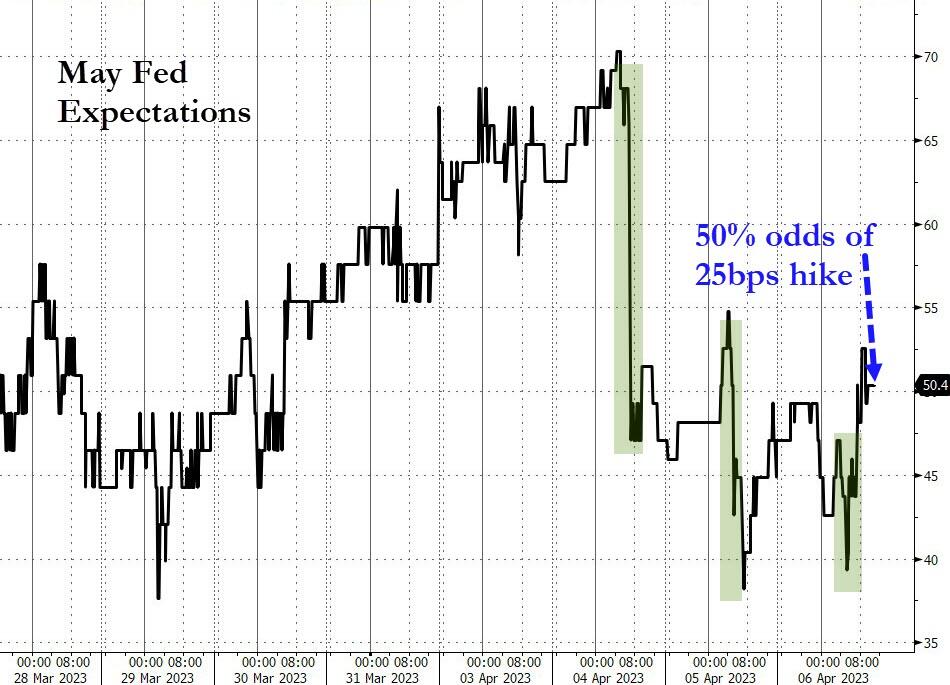
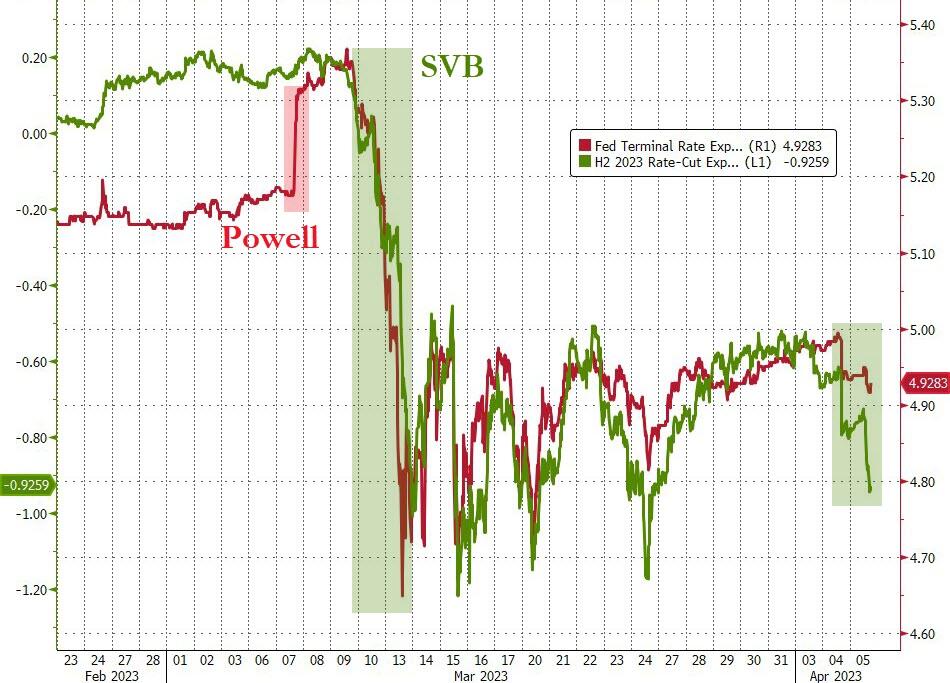
None of this is new, as the Fed had made it clear last year that rate hikes for “higher and longer” would be on the agenda, but that theme has been lost on traders and algos, who refuse to believe that a pause is not on the current horizon.
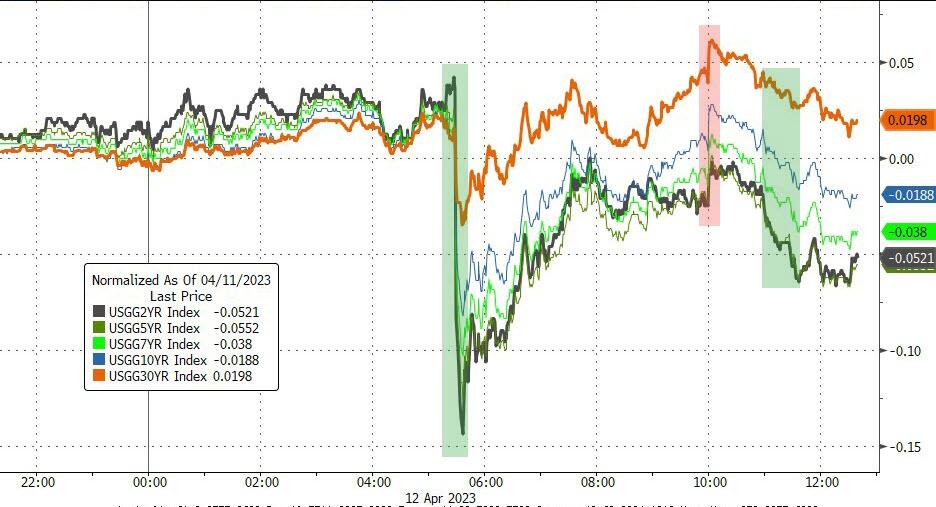
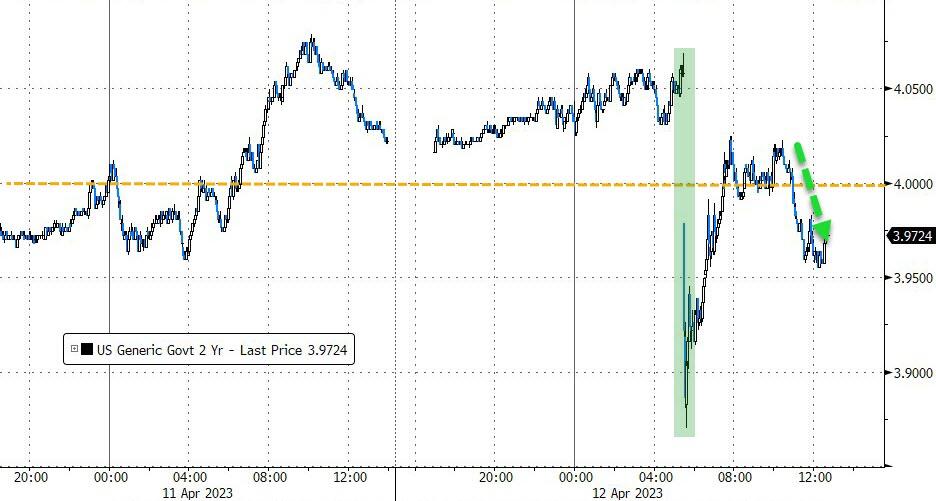
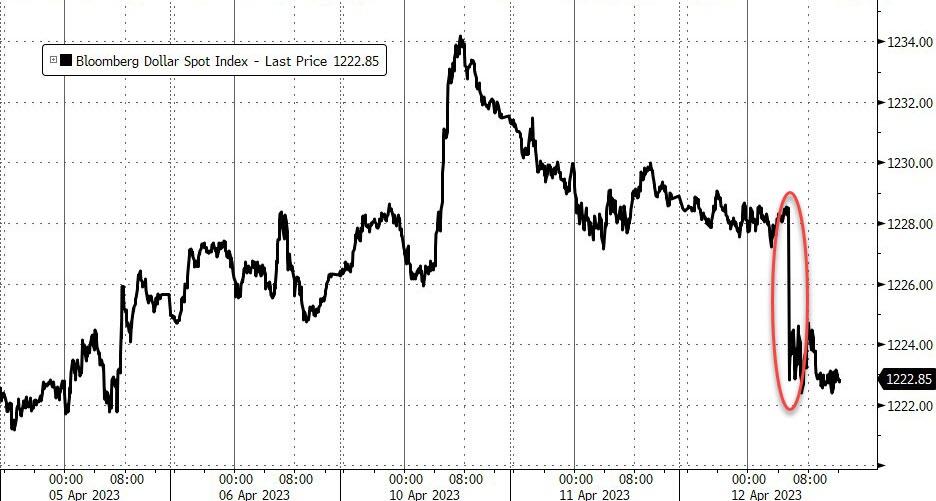
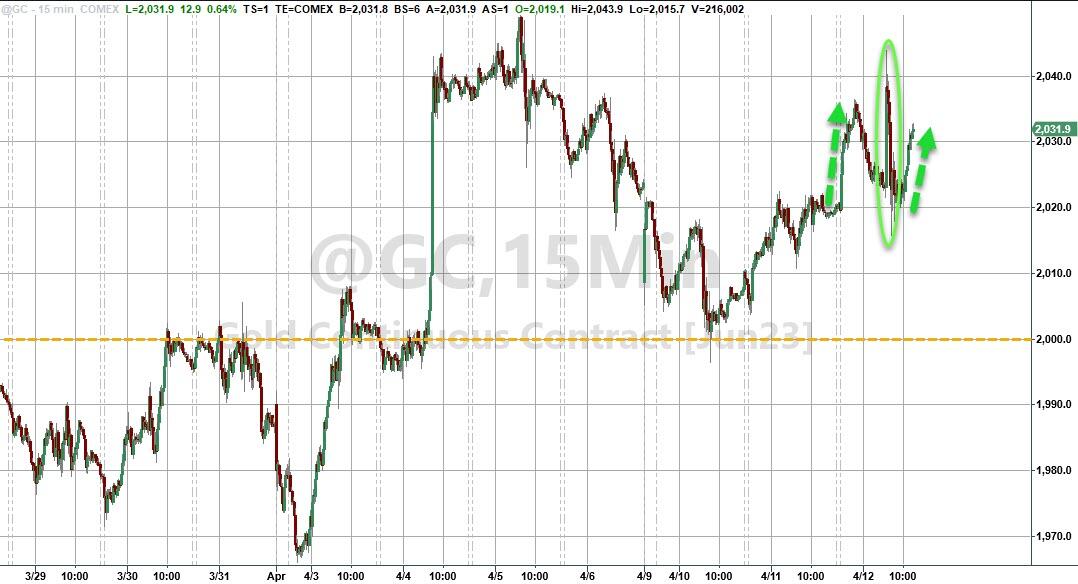
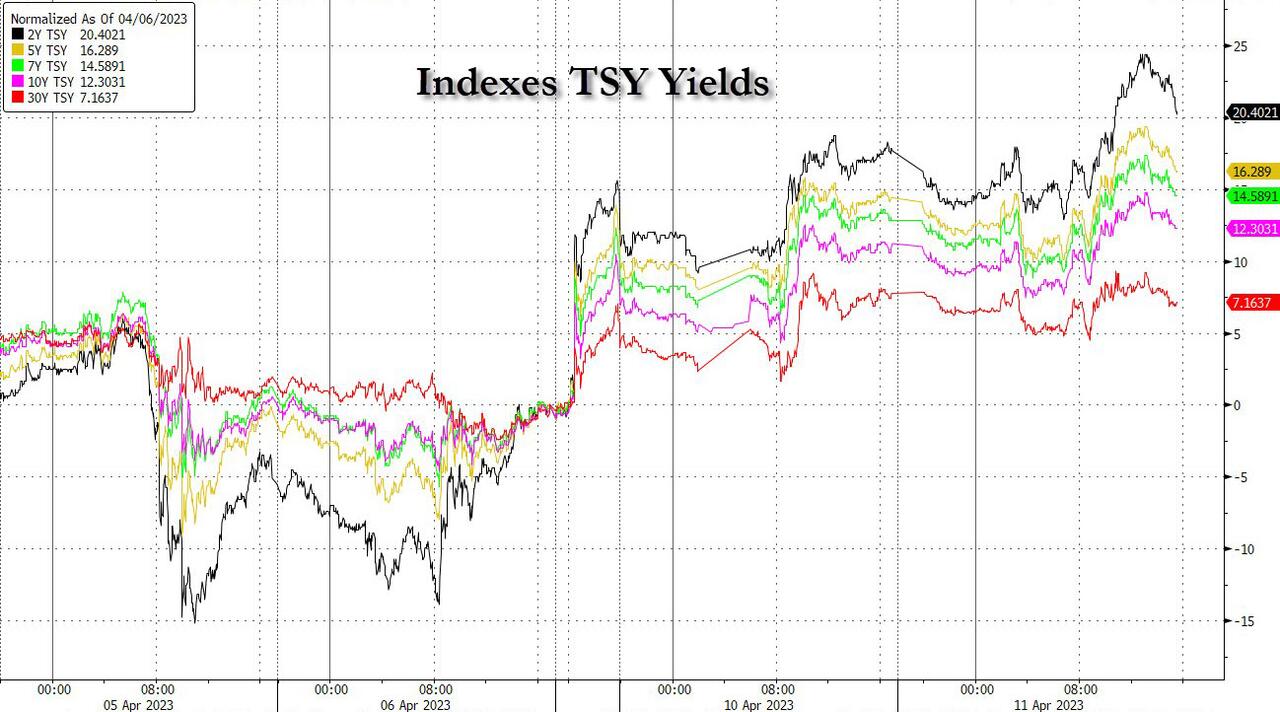
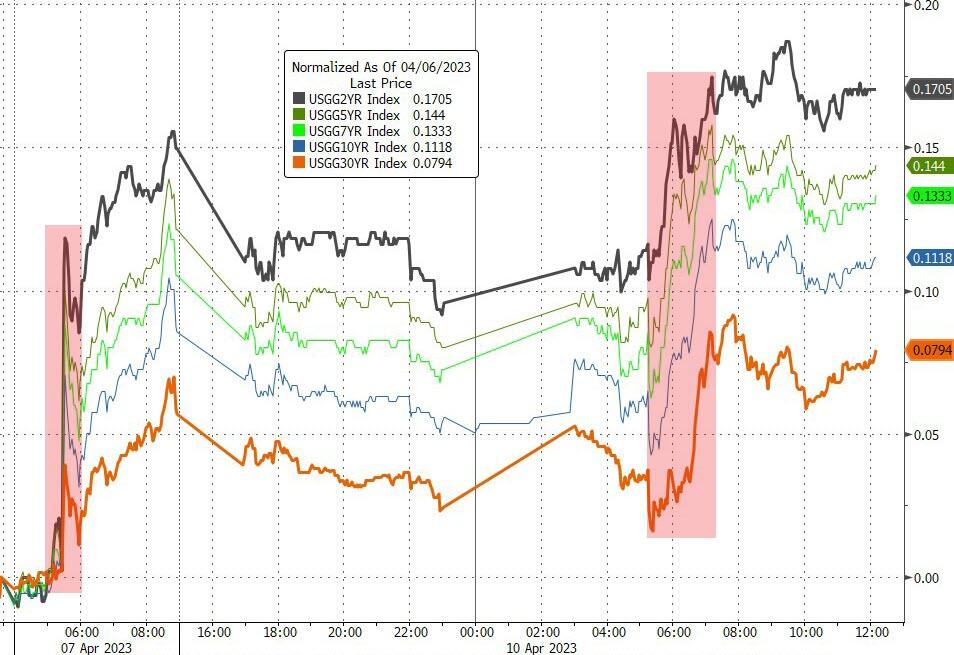
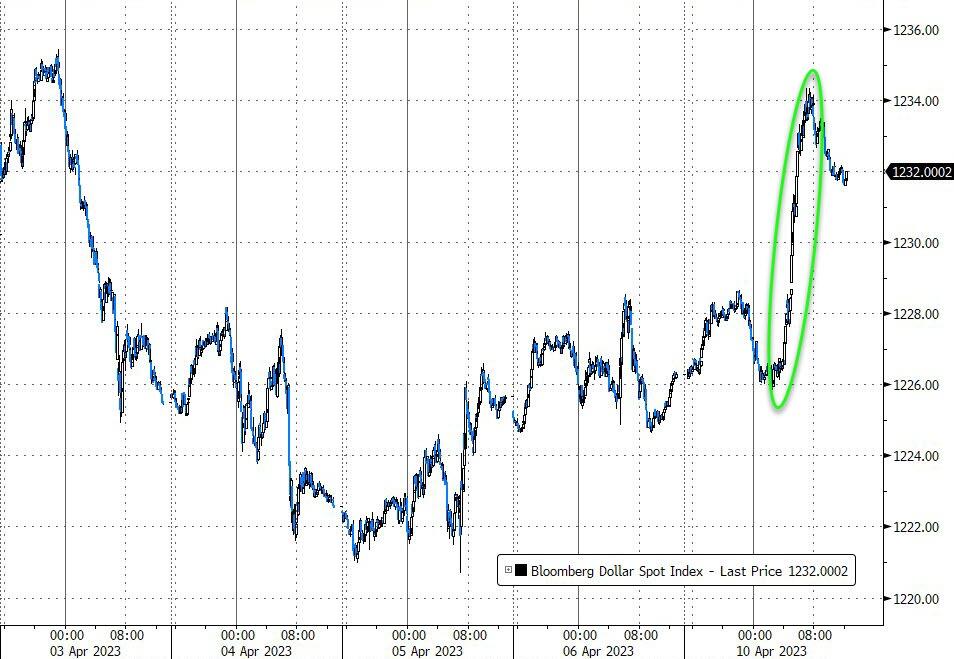
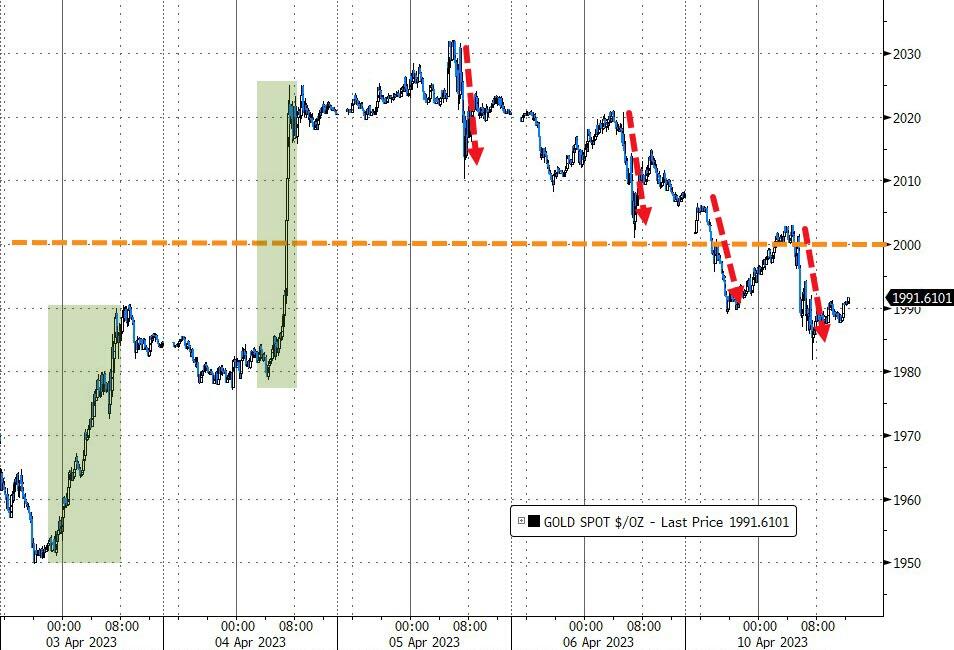
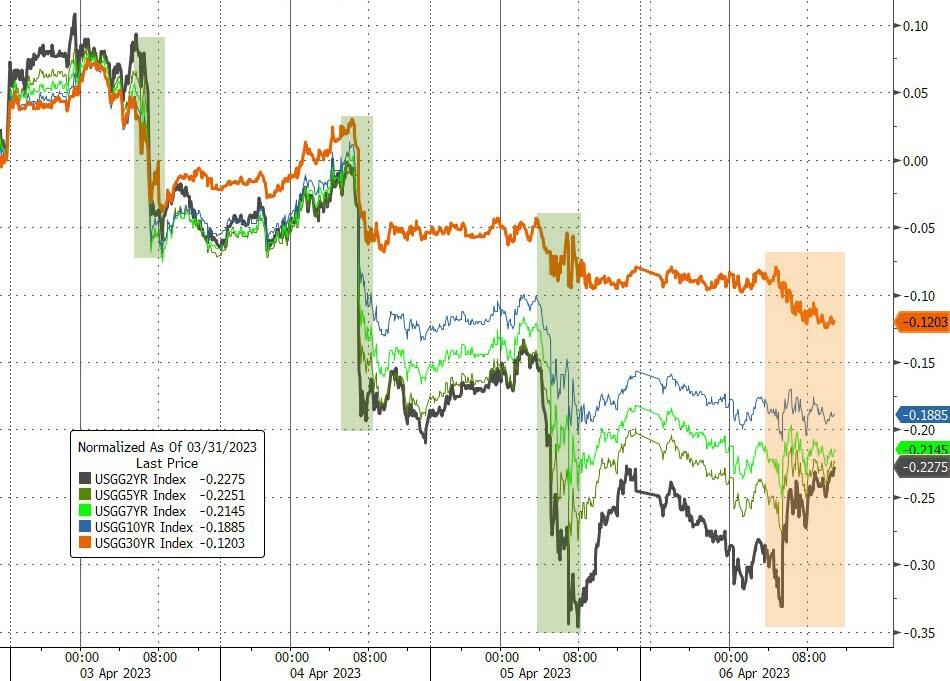
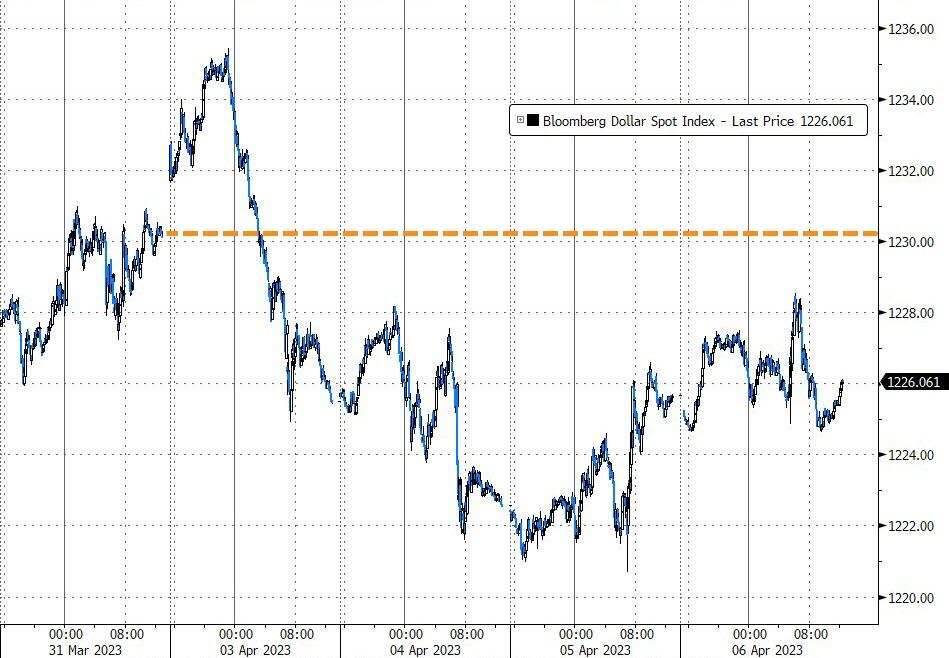
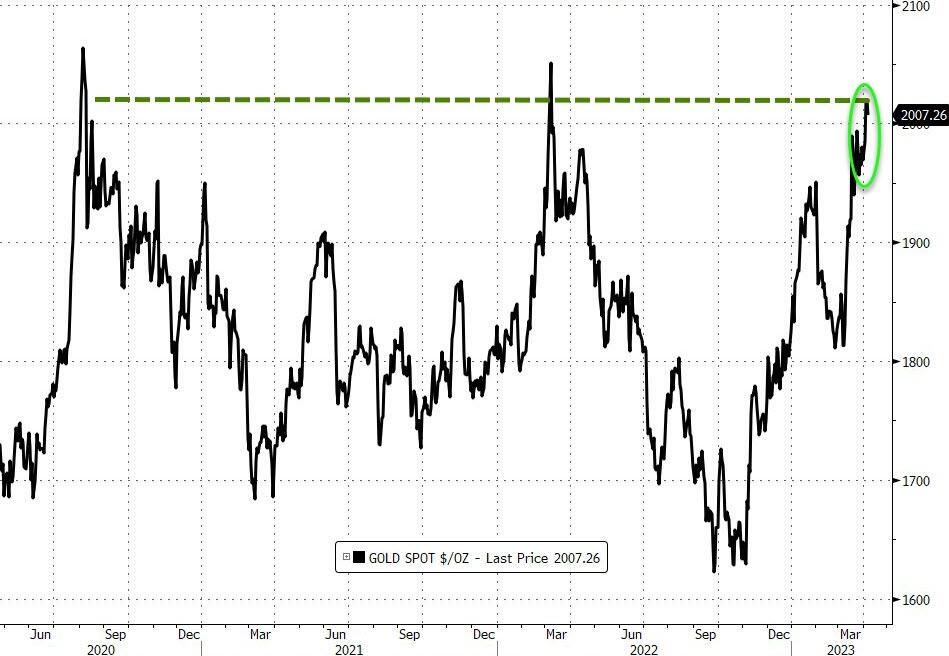
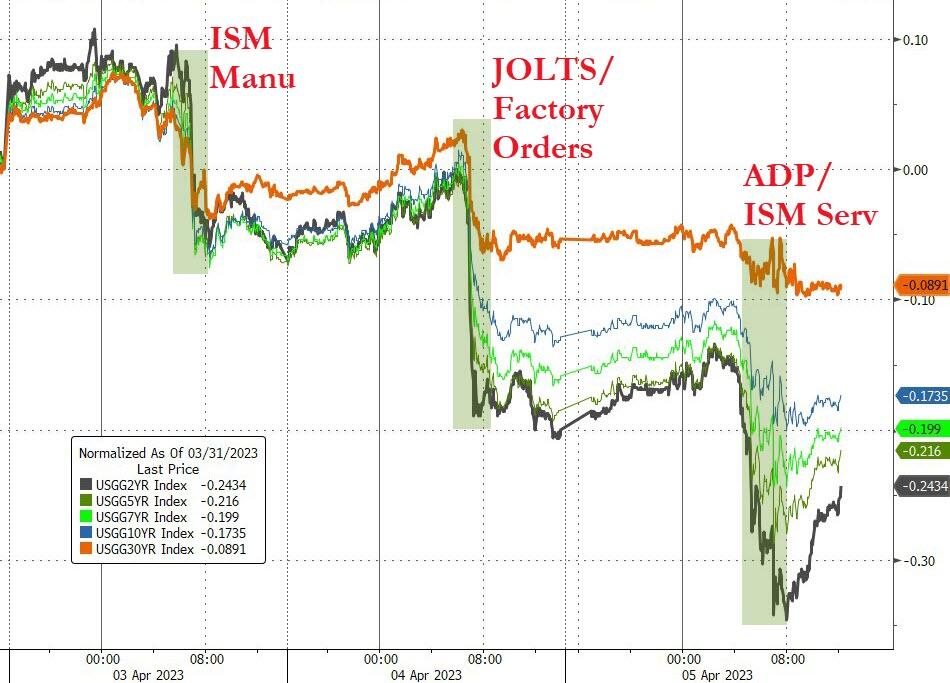
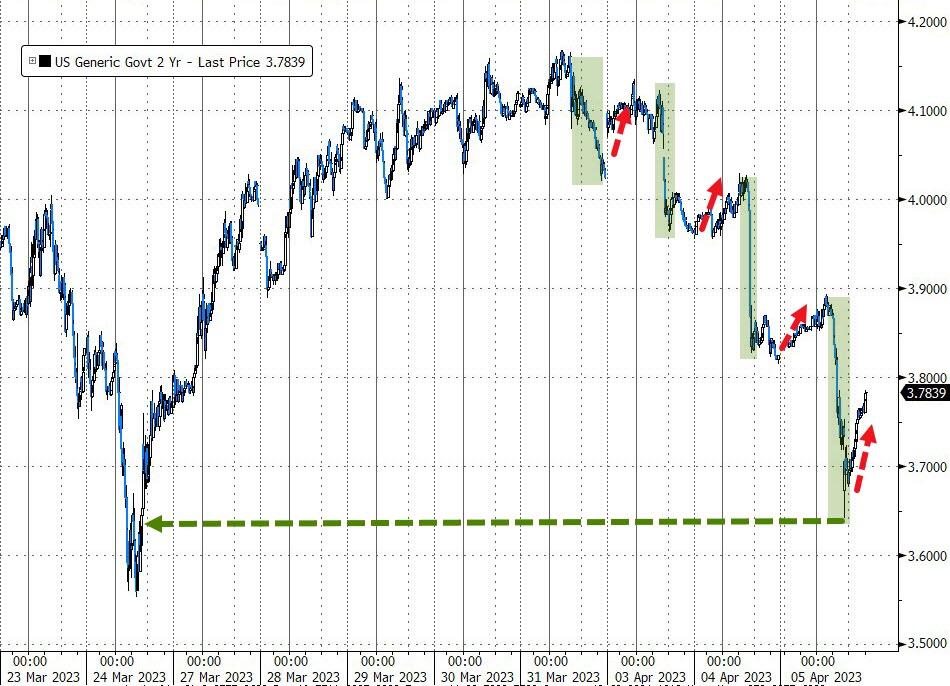
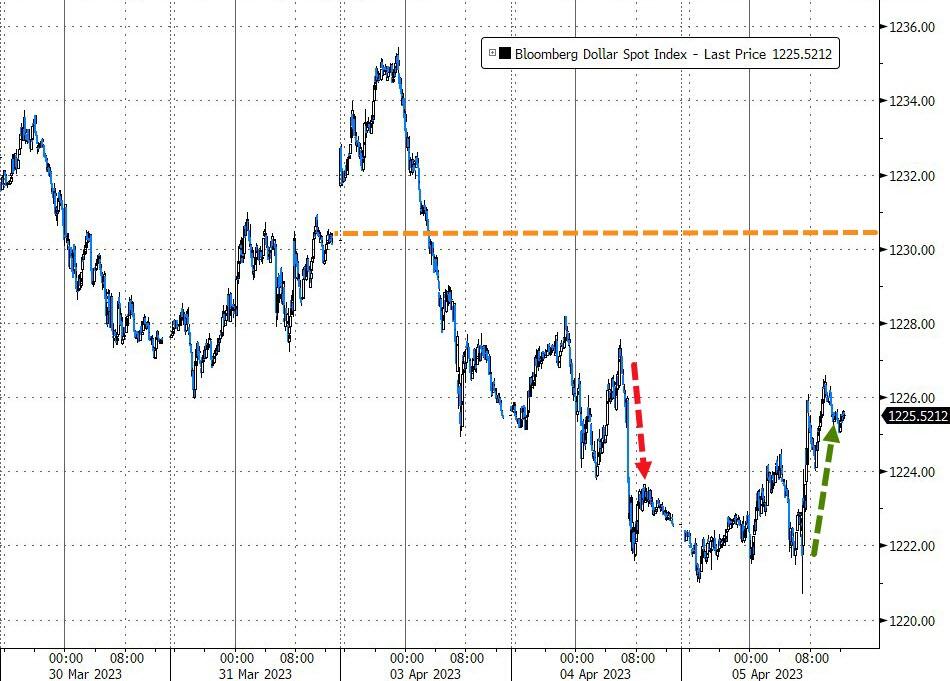
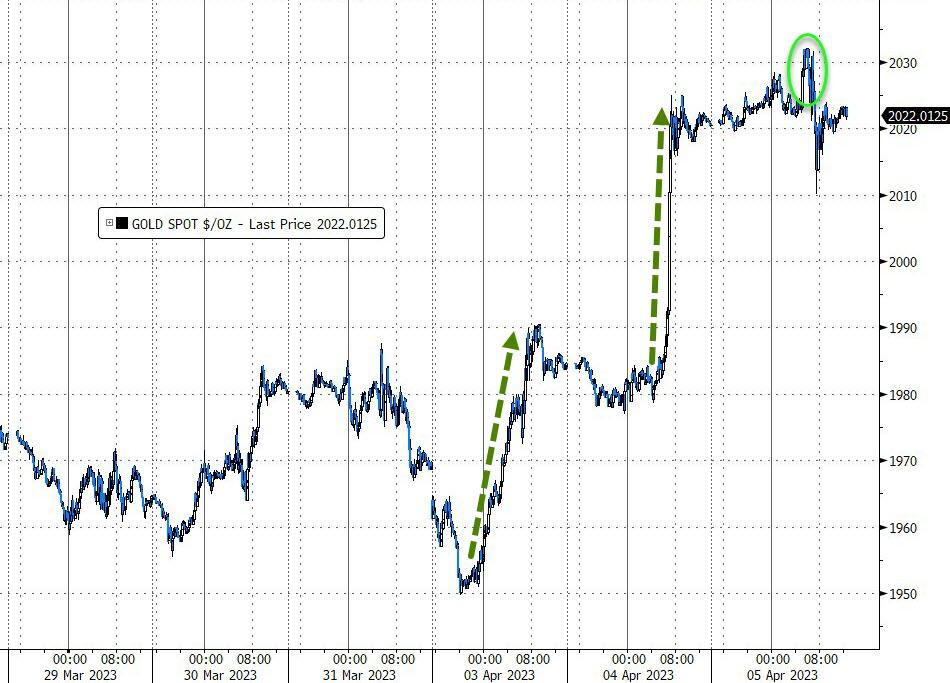
Bond yields went on a wild ride, ended the session just about unchanged, but the 10-year was yanked off its high and back below the 4% level. The US Dollar dove after the dovish CPI print, while Gold rode its own rollercoaster but managed to add another 0.45% to its impressive YTD gains.
Tomorrow, it’s up to the Producer Price Index (PPI) to determine short-term market direction.
Read More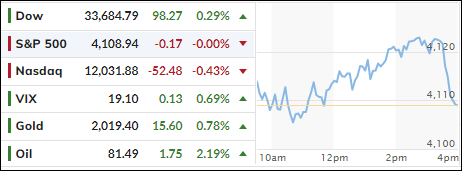
