Nasdaq Loses Its Grip While Silver Races Toward $67

Ulli Market Commentary Contact

[Chart courtesy of MarketWatch.com]

  1. Moving the market

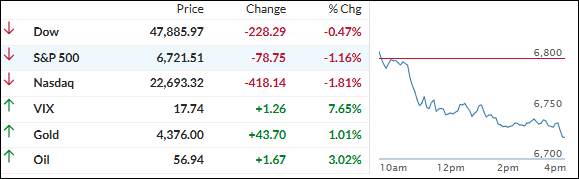
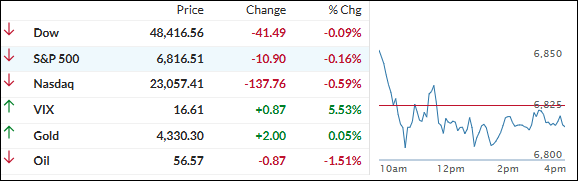
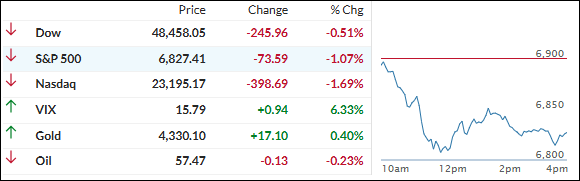
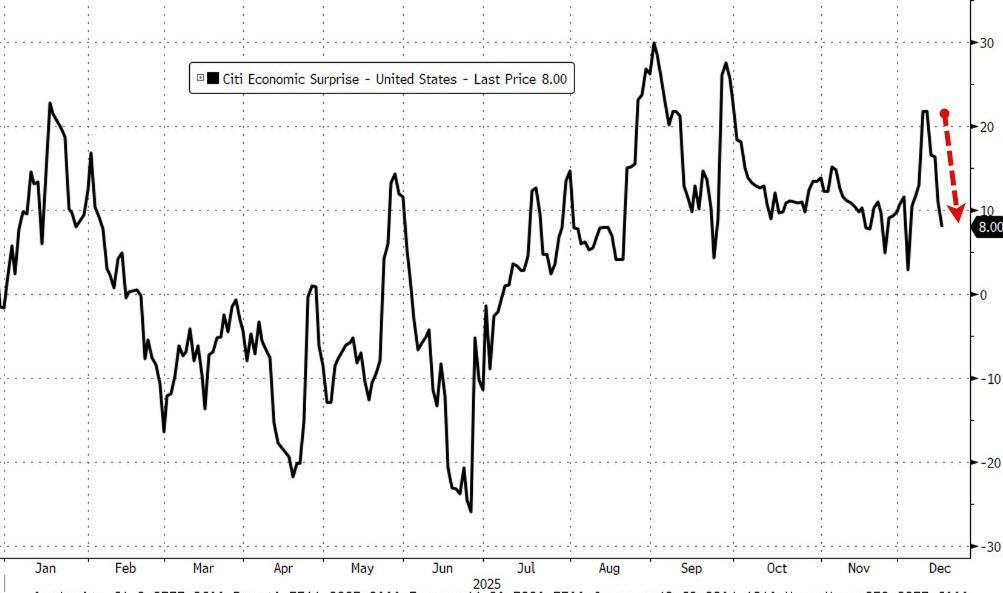
The markets started the day on shaky footing, with the S&P 500 and Nasdaq slipping while the Dow briefly held modest gains as traders sifted through the long-delayed jobs data and tried to gauge the real state of the economy.

After weeks of trading on hope, yesterday’s report made it clearer that growth has been cooling for a while, and attention is already shifting to Thursday’s November CPI release to see whether inflation is easing enough to justify more support next year. 

The real hit came from the AI story line. Oracle slid another 5% to its lowest level since mid‑June as fresh “data center drama” reignited worries about the pace and profitability of big AI investments, and AI stocks more broadly have now dropped about 9% over the past week.

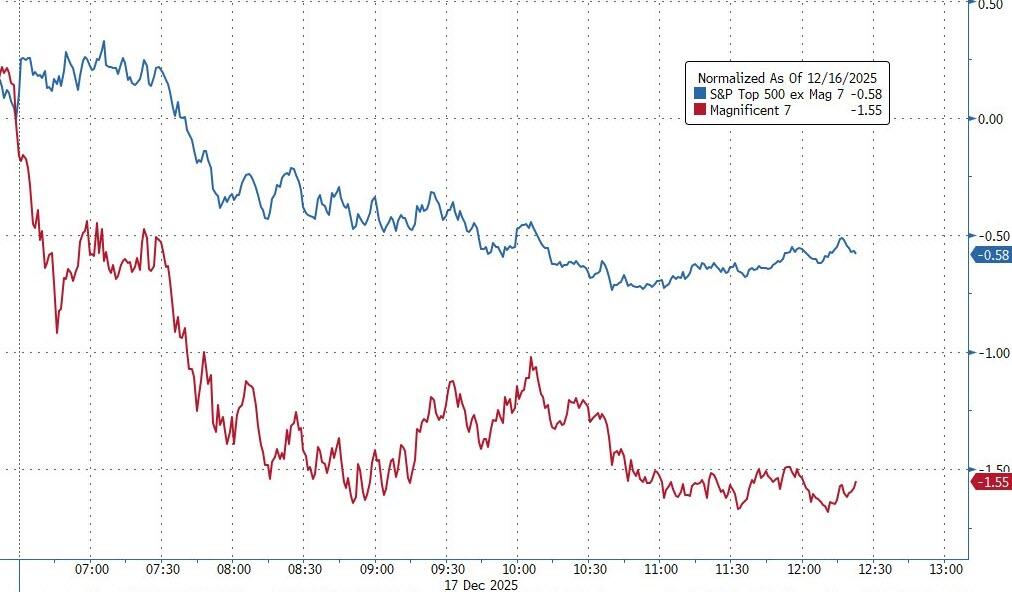
That knocked the wind out of the Nasdaq, which was hit hard and lost its 50‑day moving average, while the Dow held up relatively better; as a group, the Mag 7 names lagged the other 493 S&P components by a wide margin, underscoring how leadership has been wobbling. 

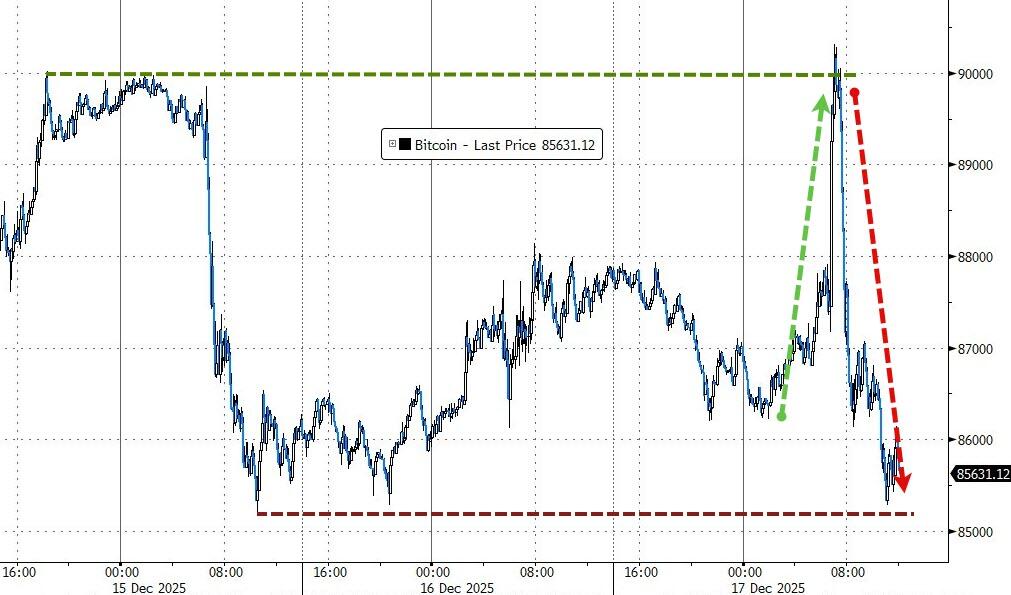
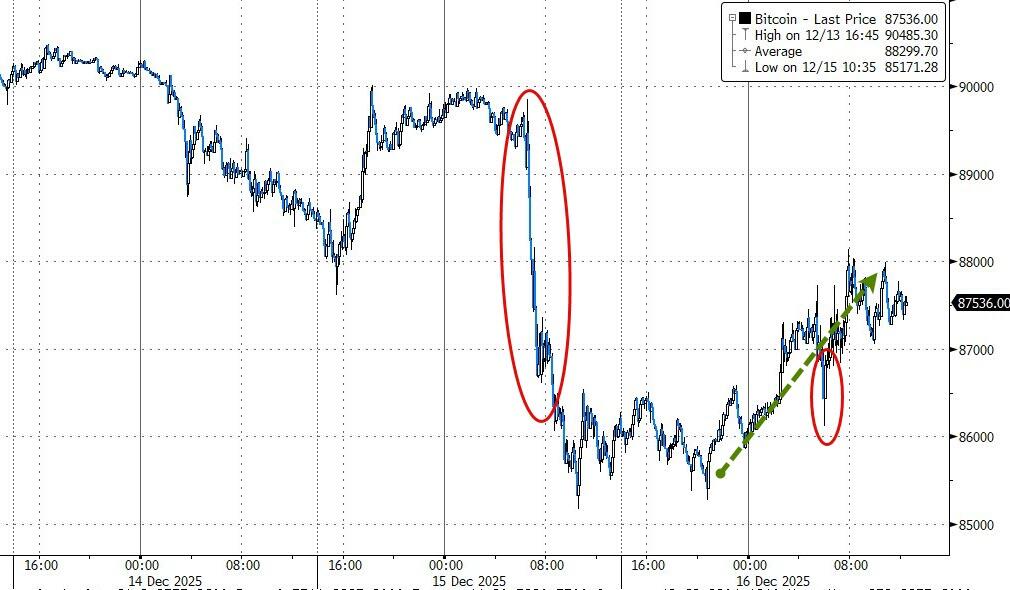
Crypto traded like a roller coaster, with Bitcoin spiking from around 86k up toward 90k before sliding back toward 85k by the close.

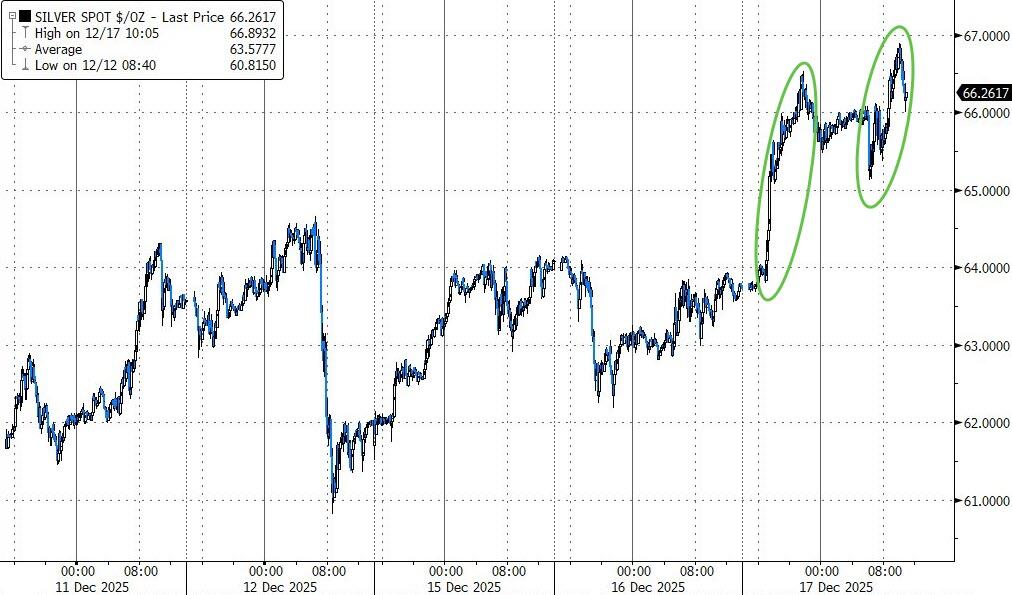
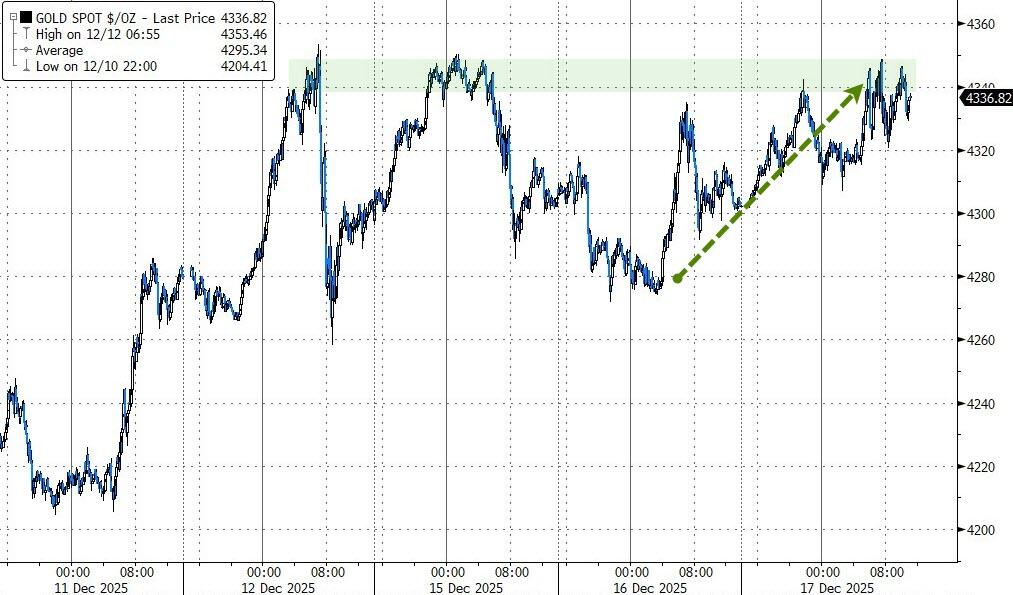
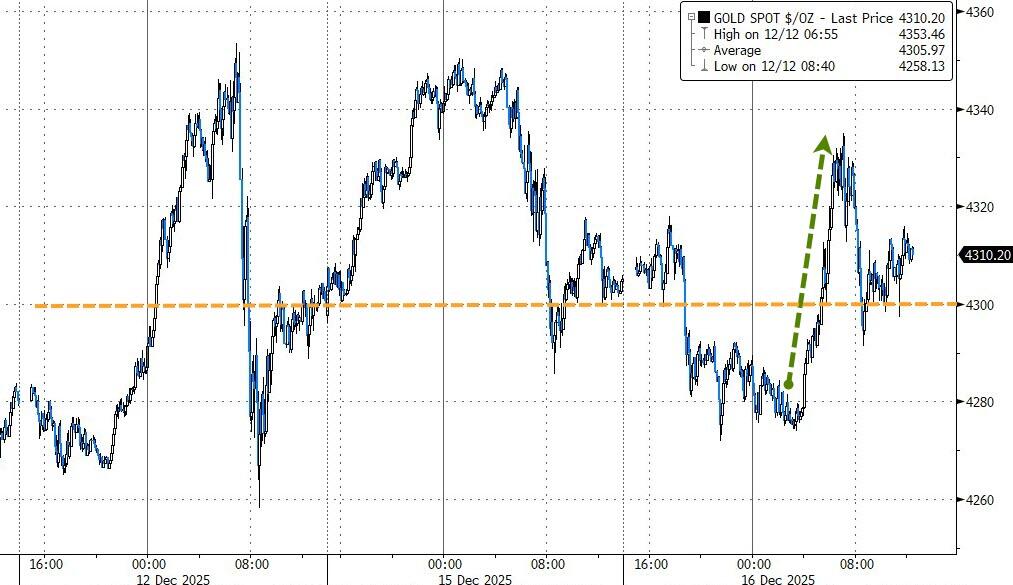
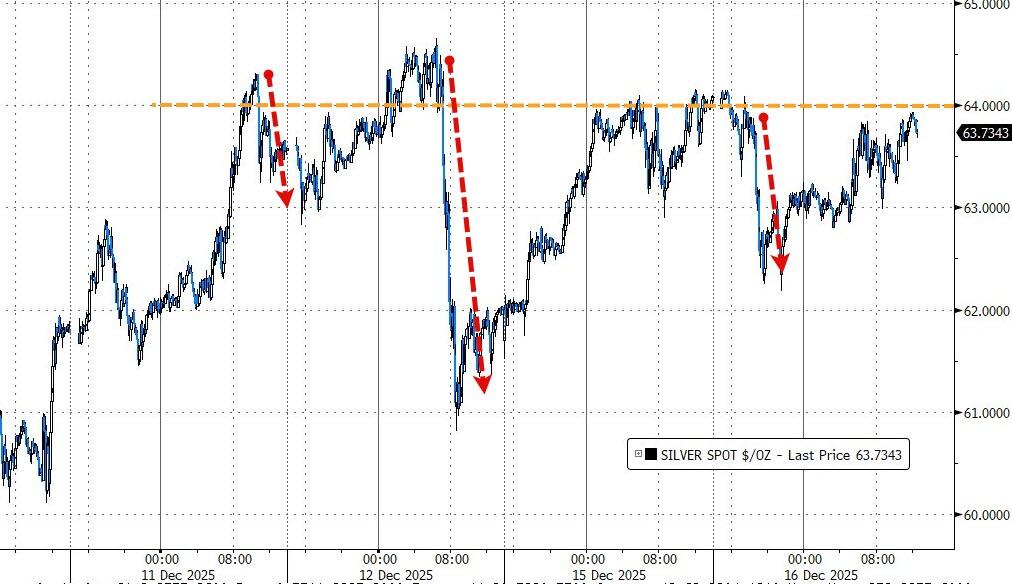
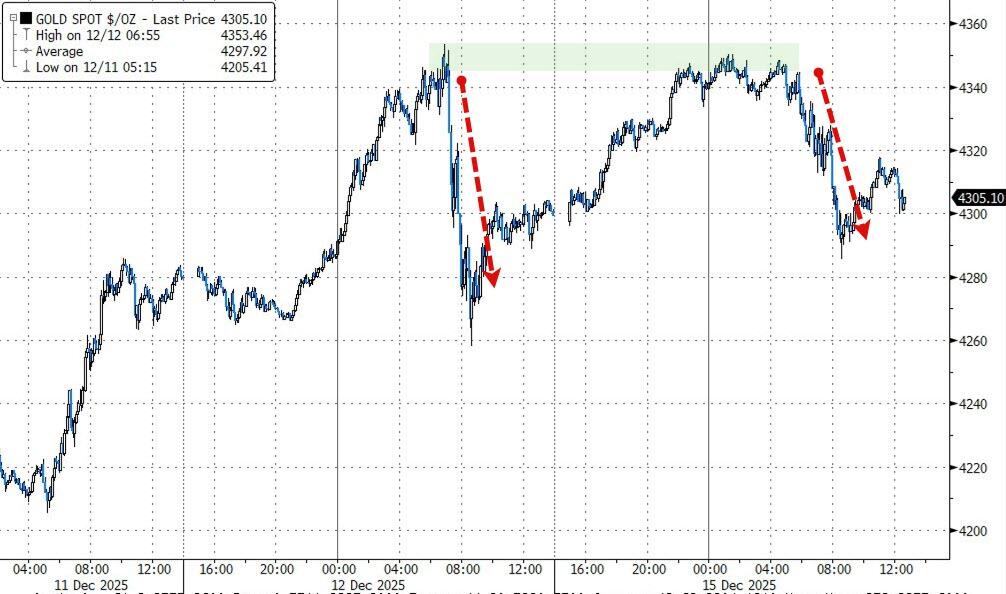
Precious metals, on the other hand, continued to act as a stabilizing force: silver ripped higher again, gaining roughly 4.4% as it pushed toward 67 before falling just short, and gold added about 1% but bumped into resistance near 4,350.

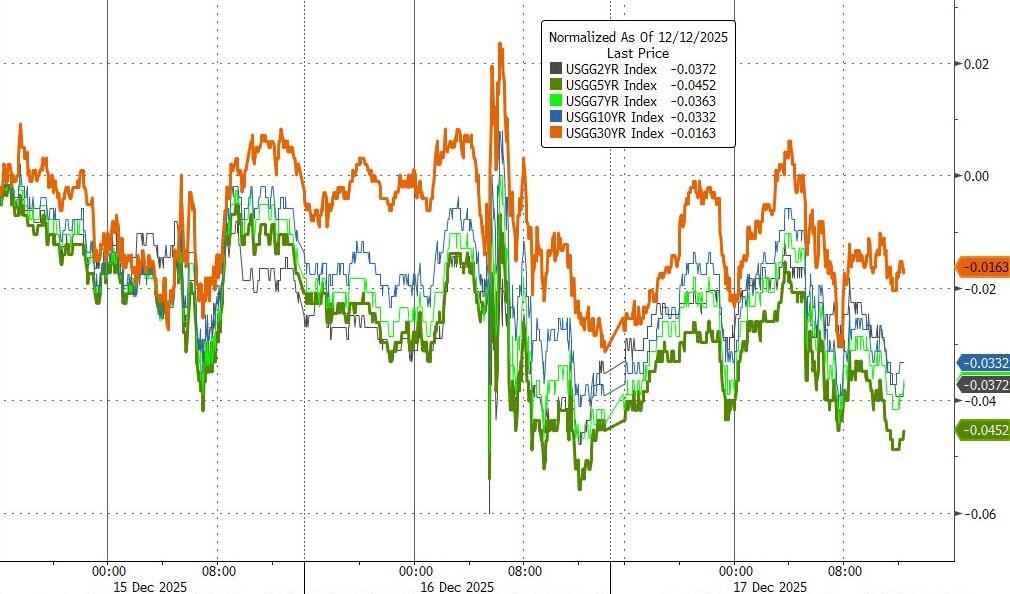
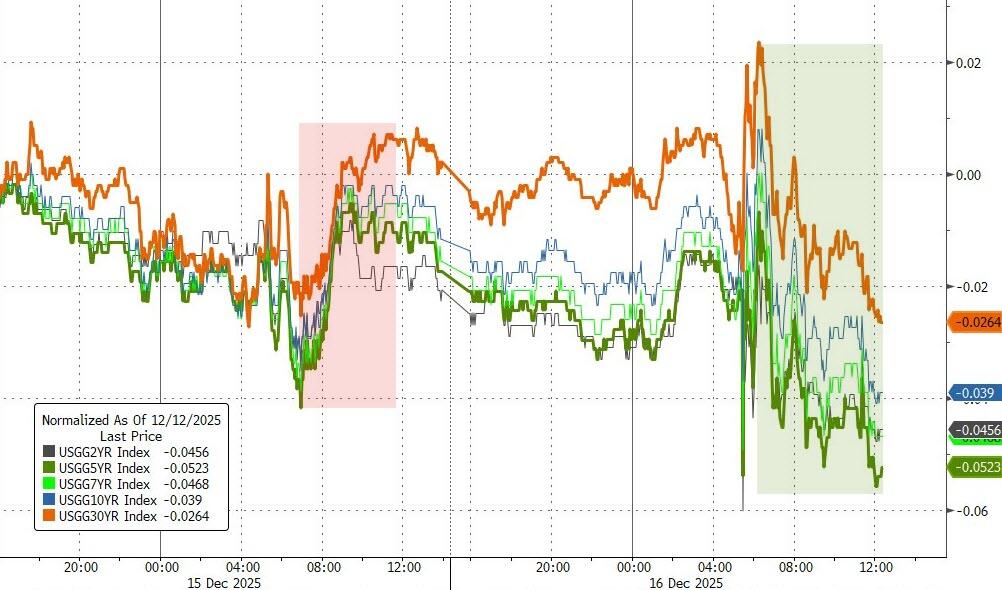
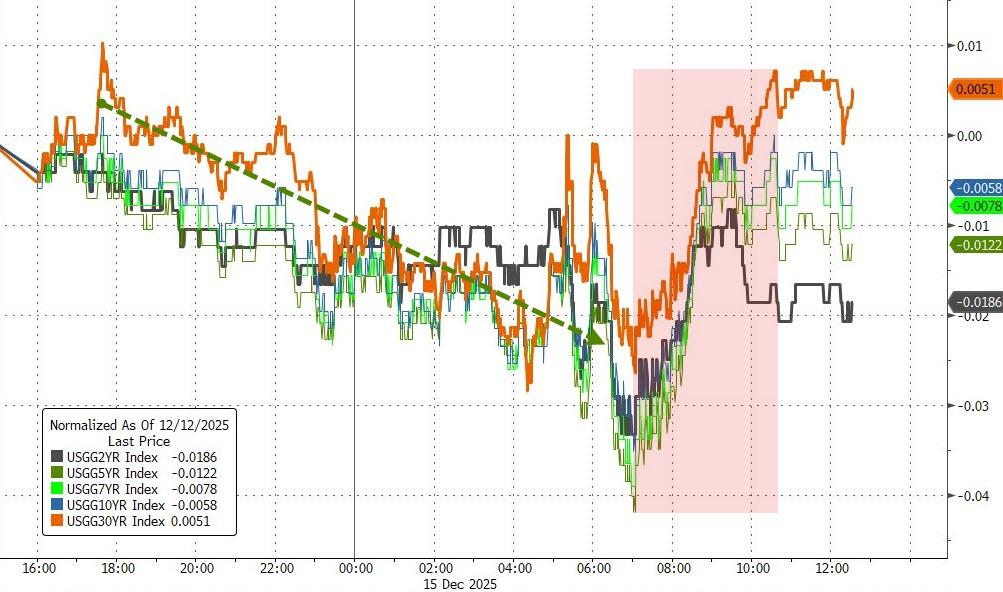
Bonds chopped around intraday, but yields remain lower on the week, offering at least a bit of support to risk assets in the background. 

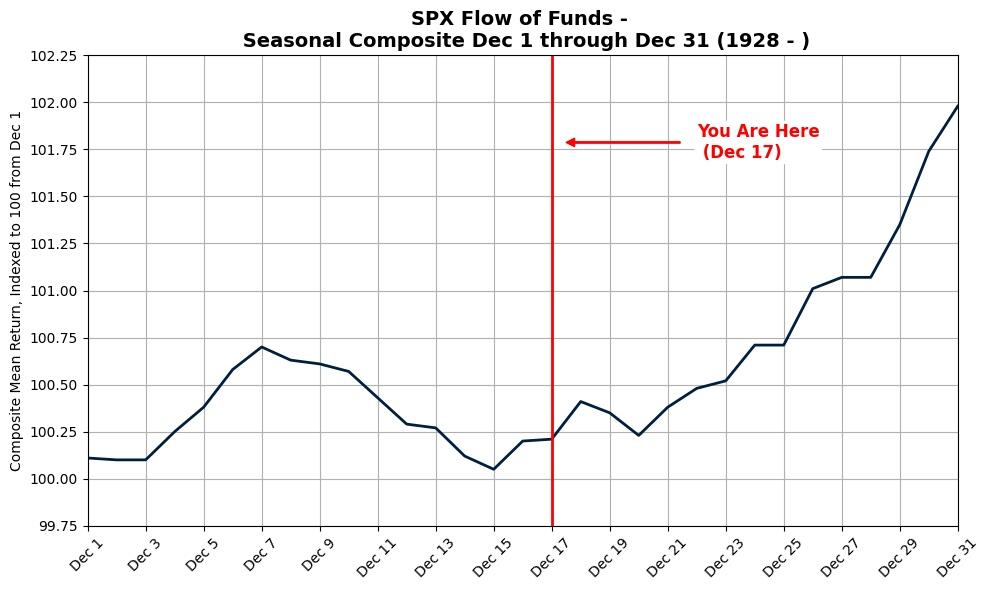
With only seven trading days left in the year, AI heavyweights stumbling, metals leading, and the macro picture looking softer but not outright broken, the big question is this one:

Can seasonality finally step in and give equities the year‑end tailwind they’re looking for—or if 2025 is destined to limp into the finish line instead of sprinting.

Read More

Gold Steady, Silver Slips, Bitcoin Tries To Bounce Back

Ulli Market Commentary Contact

[Chart courtesy of MarketWatch.com]

  1. Moving the market

Stocks slipped early on as traders chewed over the long-delayed November jobs report and what it might mean for the Fed’s next move.

The tape felt choppy rather than panicky, with markets trying to balance better‑than‑expected headlines against some softer details under the surface. 

November payrolls rose by 64,000 versus expectations for 45,000, but that strength was offset by a hefty 105,000 downward revision to October, an uptick in unemployment to 4.6%, and cooler wage growth.

Put together with weak headline retail sales (even if the core/control group held up) and ugly PMI readings on both the manufacturing and services sides, the broader macro picture landed as “not great, but maybe dovish enough” rather than truly reassuring. 

All of that helped keep hopes alive for another Fed rate cut early next year, at least in theory, giving equities some support into year‑end even if today’s price action didn’t fully show it.

The Citi macro surprise index rolled over alongside the major indexes, while U.S.–Europe trade tensions over digital taxes on big U.S. tech firms added another layer of uncertainty to the mix. 

Even so, the Nasdaq managed to sneak out a small gain, helped by sliding bond yields and continued pressure on the dollar.

Gold held its ground around the 4,300 level after a mild bounce, silver slipped back below 64, and Bitcoin staged a partial recovery from yesterday’s hit, poking up toward 88,000 intraday before failing to close above it. 

So, with data sending mixed signals, yields drifting lower, and markets still debating how many cuts are left in the Fed’s playbook—and when they’ll arrive—the question now is whether this is just a digestion phase before a year‑end push higher, or the start of a more cautious tone as 2026 comes into view.

Read More

AI Heavyweights Stumble As Metals Shine 

Ulli Market Commentary Contact

[Chart courtesy of MarketWatch.com]

  1. Moving the market

The market tried to get something going early, but the bounce fizzled and the major indexes slipped back into the red as pressure in the AI space kept weighing on sentiment.

Chipmaker Broadcom dropped more than 4%, while Oracle slid over 3%, extending last week’s weakness that already had the S&P 500 and Nasdaq on the back foot. 

For now, it’s starting to look like the “Magnificent 7” may be a little less magnificent heading into 2026, as fierce competition in the AI race chips away at the dominance they’ve enjoyed.

That kind of shake-up could be a long-term win for the “other” 493 stocks in the S&P 500, which stand to benefit if leadership broadens out beyond a handful of mega-cap names. 

This week’s data could play a big role in whether that rotation sticks. November nonfarm payrolls and October retail sales—both delayed by the fall government shutdown—are due Tuesday, with economists looking for roughly 40,000 new jobs, down sharply from September’s 119,000.

Then on Thursday, the November CPI report lands, giving markets a fresh read on the inflation side of the Fed’s mandate. 

Away from equities, bond yields were mixed, Bitcoin slid to a two-week low before finding support around 85,000, and gold briefly tested Friday’s highs before pulling back to finish with a modest gain.

Silver ripped higher again to close above 64, and copper tacked on nearly 1%, underscoring how consistently the metals complex has helped shore up portfolios on days when stocks can’t get out of their own way. 

With AI leaders stumbling, economic data back in focus, and metals quietly doing the heavy lifting, the question now is whether this is the early stage of a healthier, more diversified market—or just another pause in an AI-dominated story that comes roaring back once the next batch of headlines hits.

Read More

ETFs On The Cutline – Updated Through 12/12/2025

Ulli ETFs on the Cutline Contact

Do you want to know which ETFs are hot and which ones are not? Then you need my High-Volume ETF Cutline report. It tells you how close or far each of the 311 ETFs I follow is from its long-term trend line (39-week SMA). These are the ETFs that trade more than $5 million a day, so they are not some obscure funds that nobody cares about.

The report is split into two parts: The winners that are above their trend line (%M/A), and the losers that are below it. The yellow line is the line of shame that separates them. You can see how many ETFs are in each group and how they have changed since the last report (272 vs. 270 current).

Take a peek:

The HV ETF Master Cutline Report

If you are confused by some of the terms we use, don’t panic. I have a helpful Glossary of Terms for you.

If you want to learn more about the Cutline method and how it can make you rich (or at least less poor), read my original post here.

ETF Tracker Newsletter For December 12, 2025

Ulli ETF Tracker Contact

ETF Tracker StatSheet          

You can view the latest version here.

METALS KEEP SHINING, TECH KEEPS WHINING – WHAT’S NEXT?

[Chart courtesy of MarketWatch.com]

  1. Moving the market

The Dow kicked things off by flashing a fresh record high—value and cyclicals were still getting love while everyone kept dumping tech.

But that early pop ran out of gas fast, and by mid-morning all three major indexes were sliding into the red, with the Nasdaq taking the biggest beating.

The main villain? Broadcom cratered 9% even after beating earnings and guiding AI chip sales to double**. That reignited the whole “when do we actually see ROI on this AI spending?” panic.

Palantir, Micron, and the usual suspects got dragged lower too. Meanwhile, financials, health care, and industrials quietly picked up some gains—classic rotation trade in full swing.

It was a wild, confusing week: dovish Fed + decent macro data on one side, AI profit-taking and valuation jitters on the other. End result? Nasdaq and S&P finished as the week’s big losers, while the Dow and small caps held up way better.

The Mag 7 got absolutely crushed mid-week onward, while the other 493 S&P names actually outperformed.

Bonds were mixed, the dollar hung near 3-month lows, but precious metals kept stealing the show—gold topped $4,300, silver kissed $65 intraday (another new record) before a little profit-taking hit.

Bitcoin? Pure rollercoaster but closed the week basically flat.

Quick question as we’re heading into the weekend: with tech getting punished but the broad market hanging tough and metals still on fire, does this feel like a healthy rotation that sets up a real year-end push… or the first little hairline crack in the 2025 bull story?

Read More

Weekly StatSheet For The ETF Tracker Newsletter – Updated Through 12/11/2025

Ulli ETF StatSheet Contact

ETF Data updated through Thursday, December 11, 2025

How to use this StatSheet:

  1. Out of the 1,800+ ETFs out there, I only pick the ones that trade over $5 million per day (HV ETFs), so you don’t get stuck with a lemon that nobody wants to buy or sell.
  1. Trend Tracking Indexes (TTIs)

These are the main indicators that tell you when to buy or sell Domestic and International ETFs (section 1 and 2). They do that by comparing their position to their long-term M/A (Moving Average). If they cross above, and stay there, it’s a green light to buy. If they fall below, and keep going, it’s a red light to sell. And to make sure you don’t lose your shirt if things go south, I also use a 12% trailing stop loss on all positions in these categories.

  1. All other investment areas don’t have a TTI and should be traded based on the position of each ETF relative to its own trend line (%M/A). That’s why I call them “Selective Buy.” In other words, if an ETF goes above its own trend line, you can buy it. But don’t forget to use a trailing sell stop of 12%, or less if you’re feeling nervous.

If some of these words sound like Greek to you, please check out the Glossary of Terms and new subscriber information in section 9.

  1. DOMESTIC EQUITY ETFs: BUY— effective 5/20/2025

Click on chart to enlarge

This is our main compass, the Domestic Trend Tracking Index (TTI-green line in the above chart). It has broken above its long-term trend line (red) by +7.93% and remains in “Buy” mode, with our holdings being subject to our trailing sell stops.

Read More