
- Moving the markets
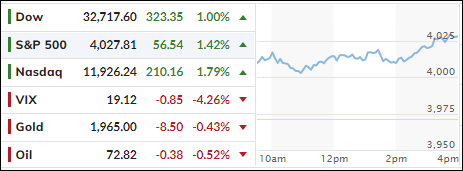
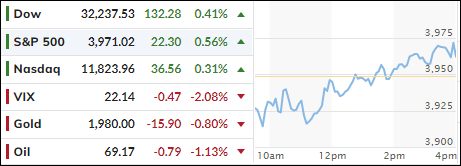
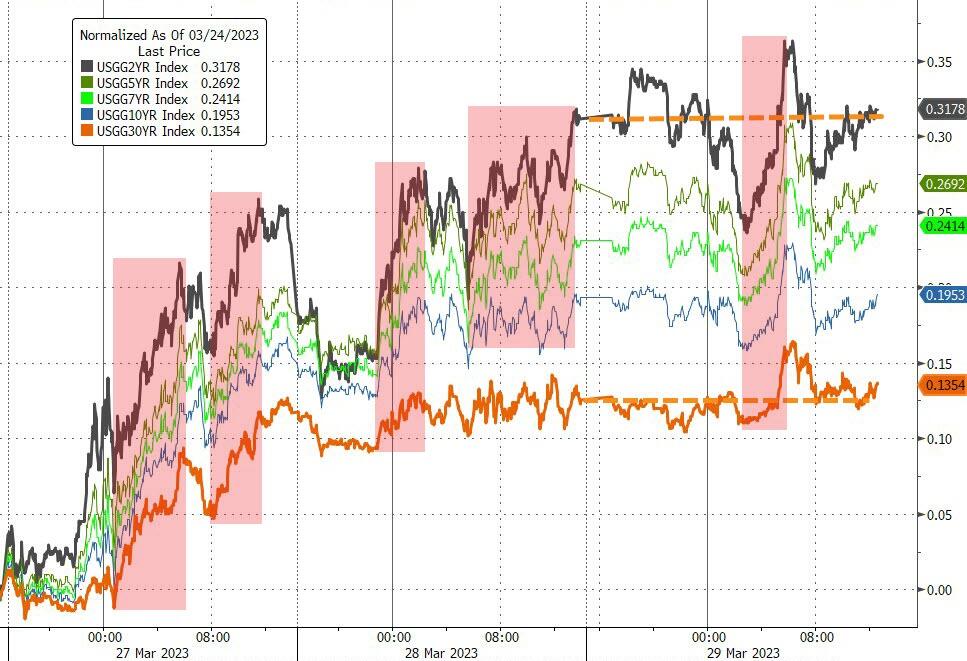
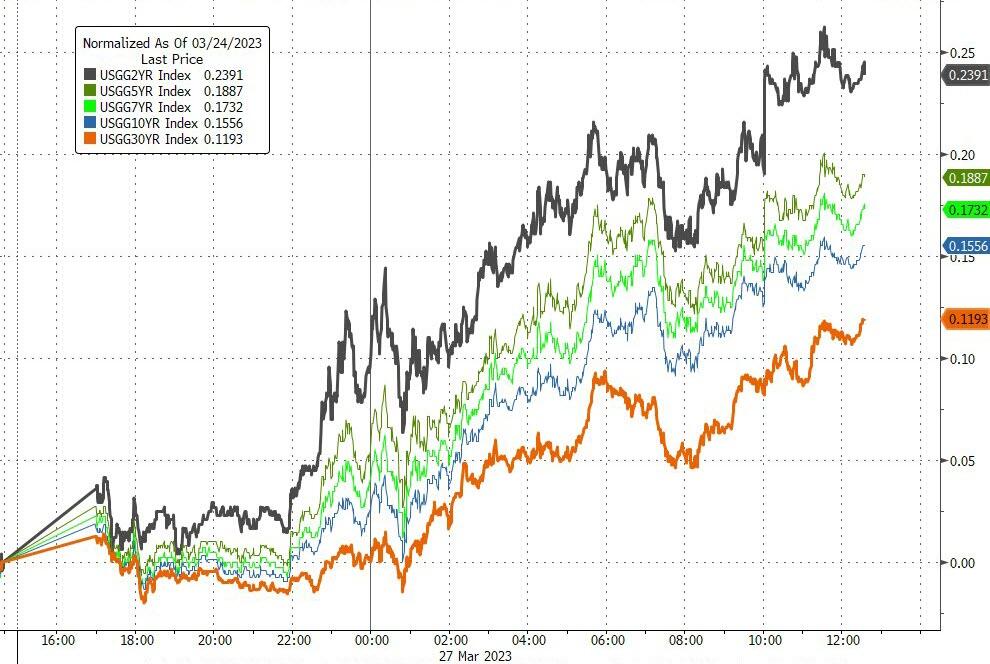
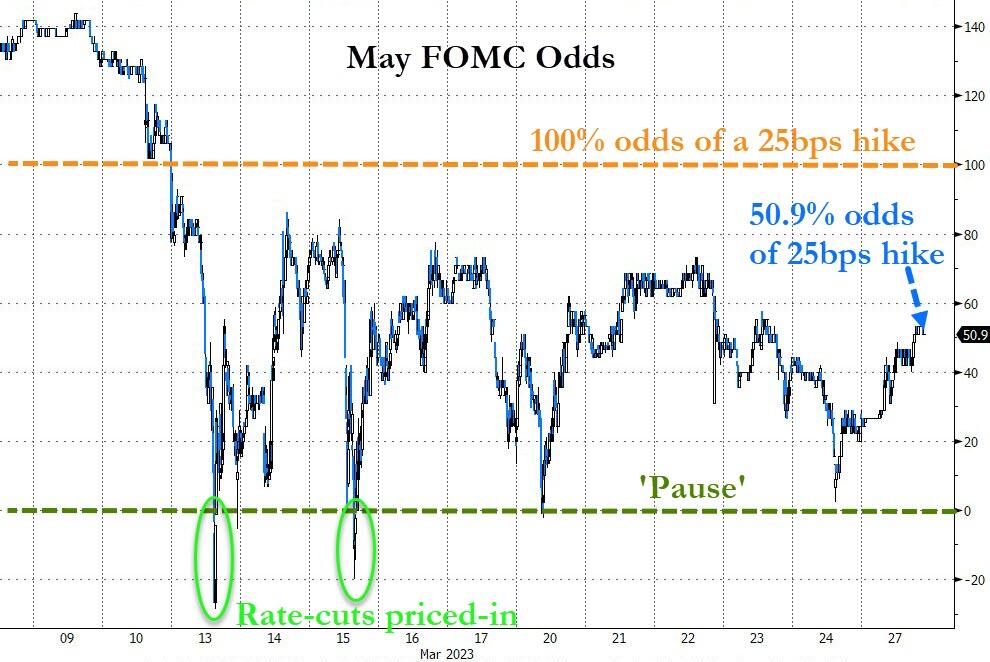
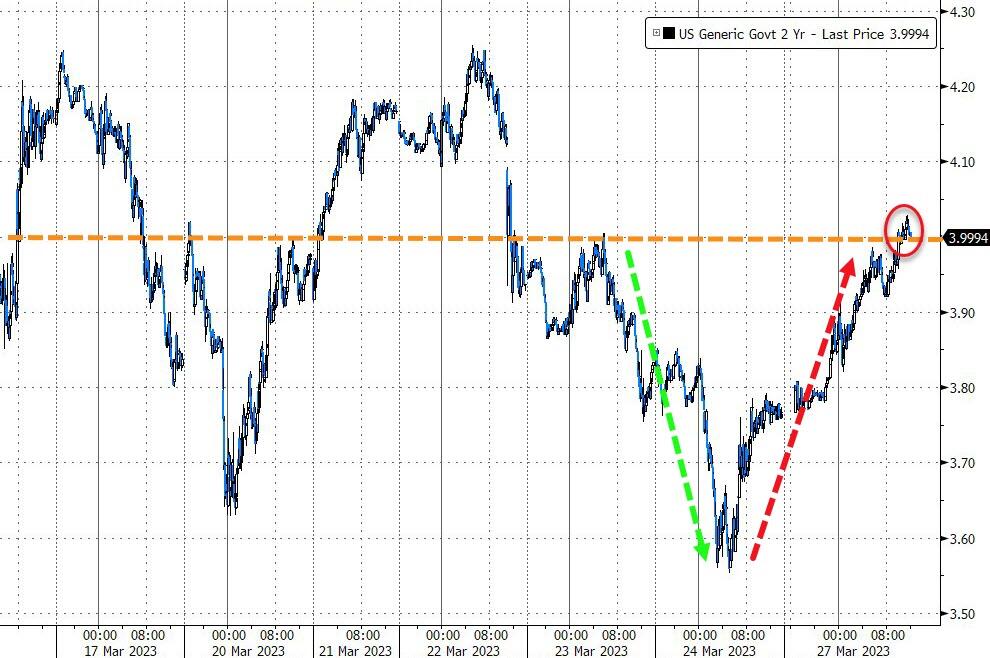
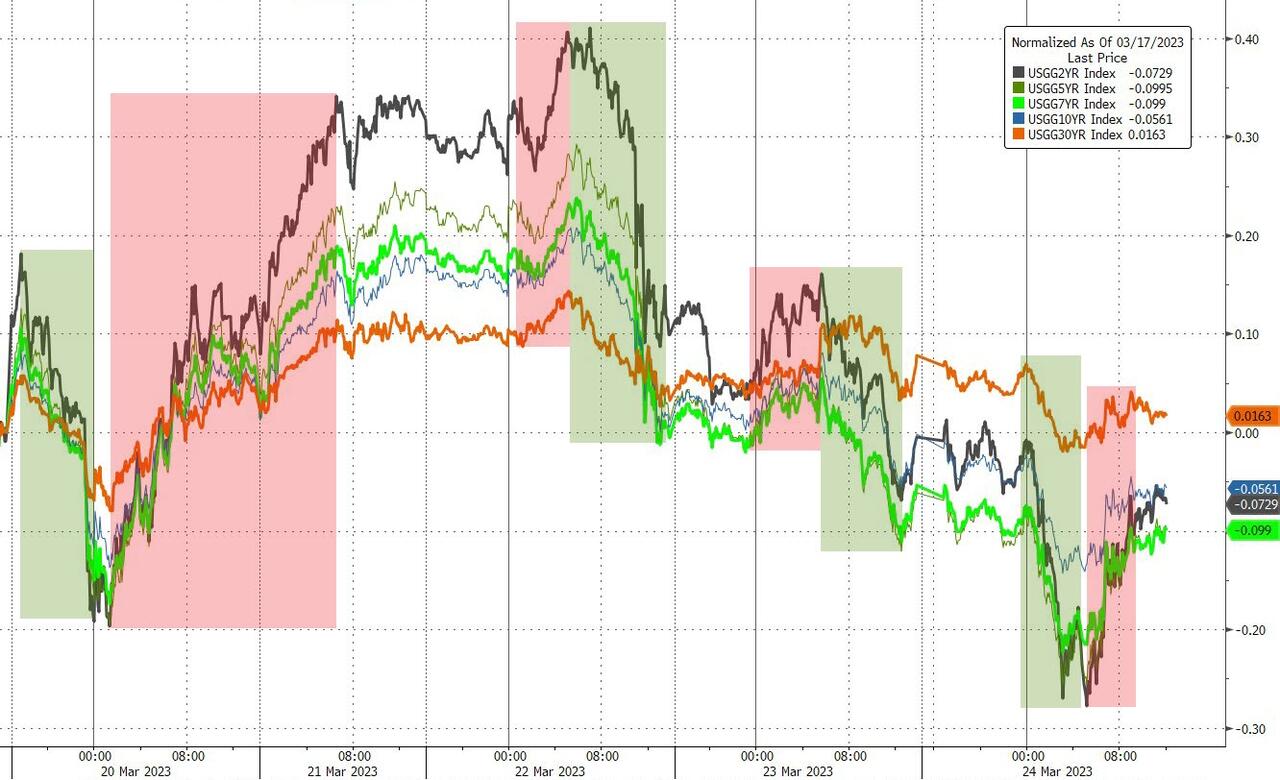
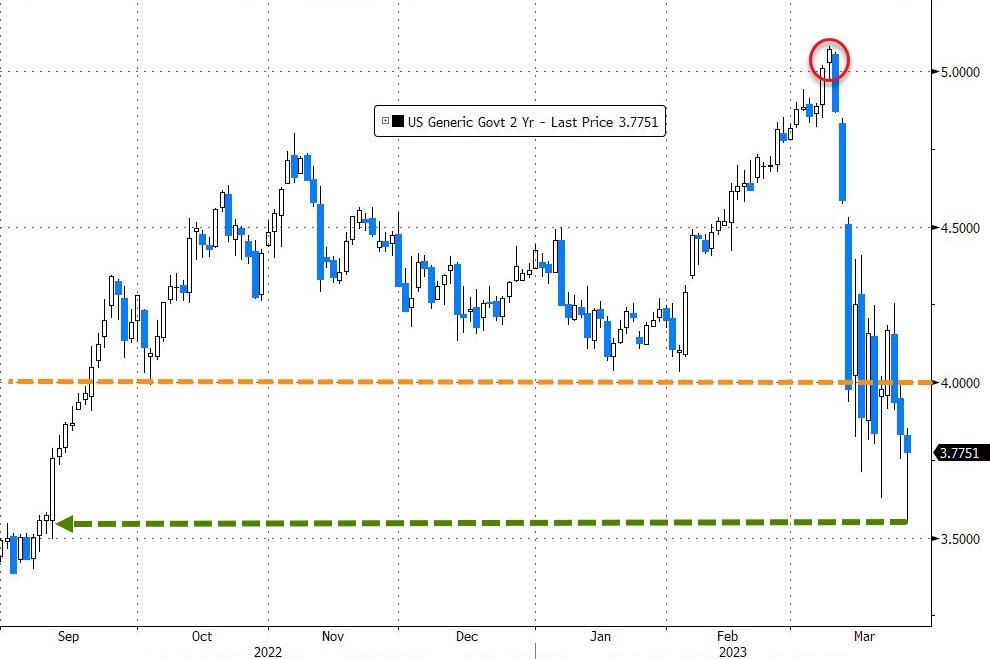
Judging by today’s rebound, it appears that traders and algos alike were no longer concerned with the state of the banking sector, nor if or when the Fed might shift into easing mode. None of it mattered, as sentiment maintained its bullish influence, with the S&P 500 reclaiming its 4,000 level—also helped by a calm bond market.
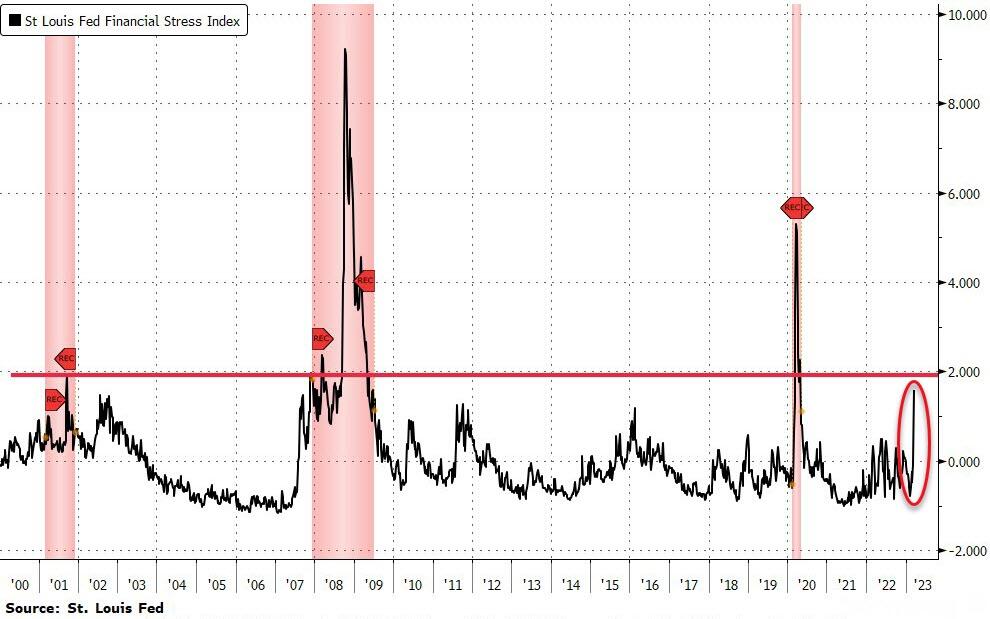
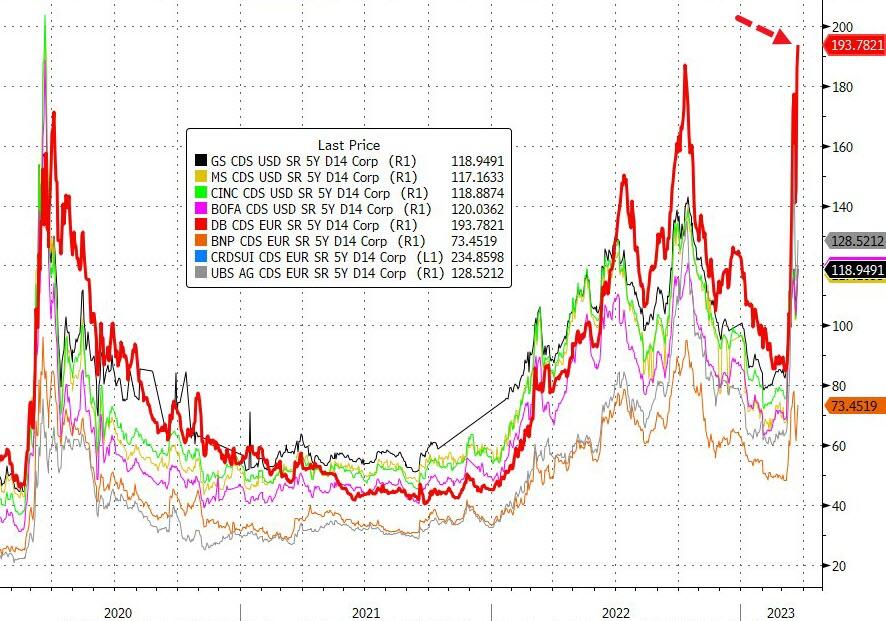
Never mind that the Fed’s gauge of financial stress has approached levels of concern, as ZH reported, but it seems that policymakers’ best hope will be that the current calm will prevail long enough to keep the economy from falling off a cliff.
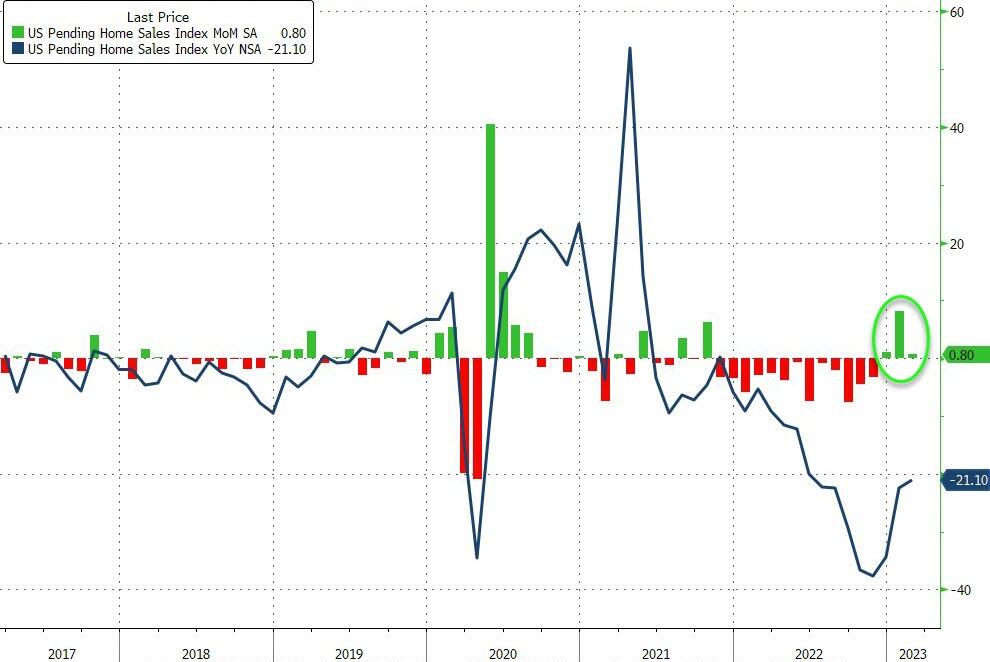
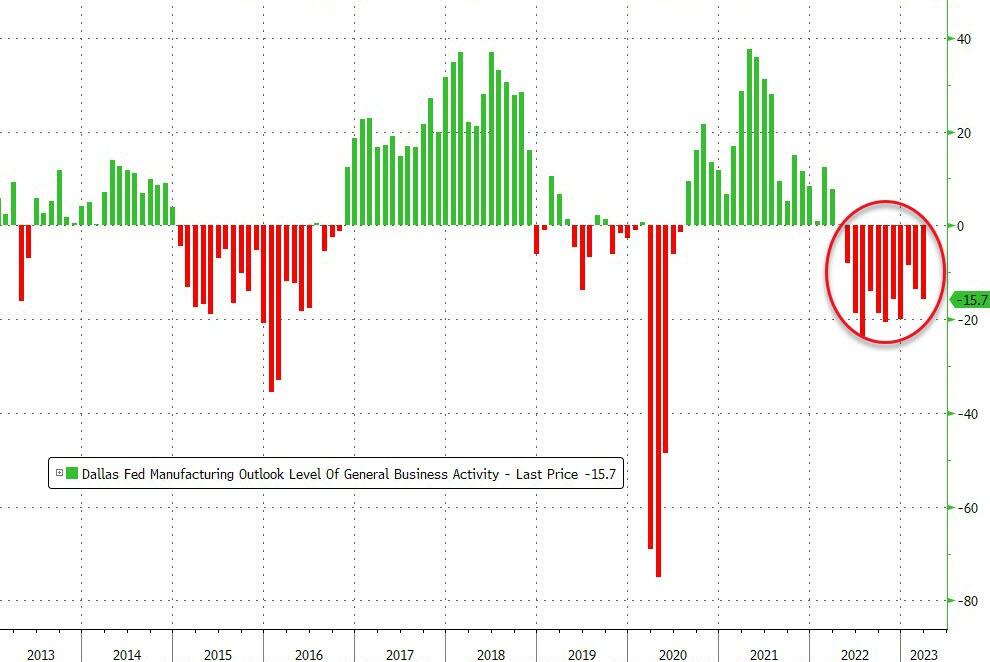
In economic news, we learned that the Pending Home sales rebound slowed in February after a huge 8.1% surge in January.
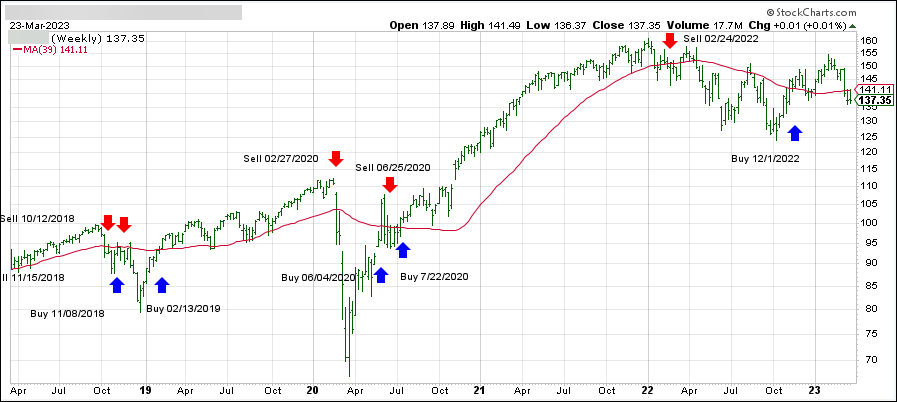
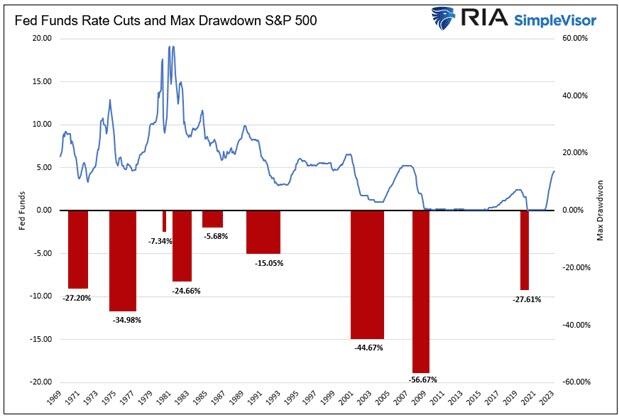
I enjoyed market analyst and charting guru Michael Lebowitz’ piece on clarifying that a Fed pivot (to lower rates) is not bullish, if history is any indicator. He states that since 1970, there have been nine instances in which the Fed significantly cut the Fed Funds rate. The average maximum drawdown from the start of each rate reduction period to the market trough was 27.25%, as his chart shows.
Makes me think of the old saying “be careful what you wish for,” something that traders should keep in mind rather than only focusing on the event, expecting that bullish times are here again.
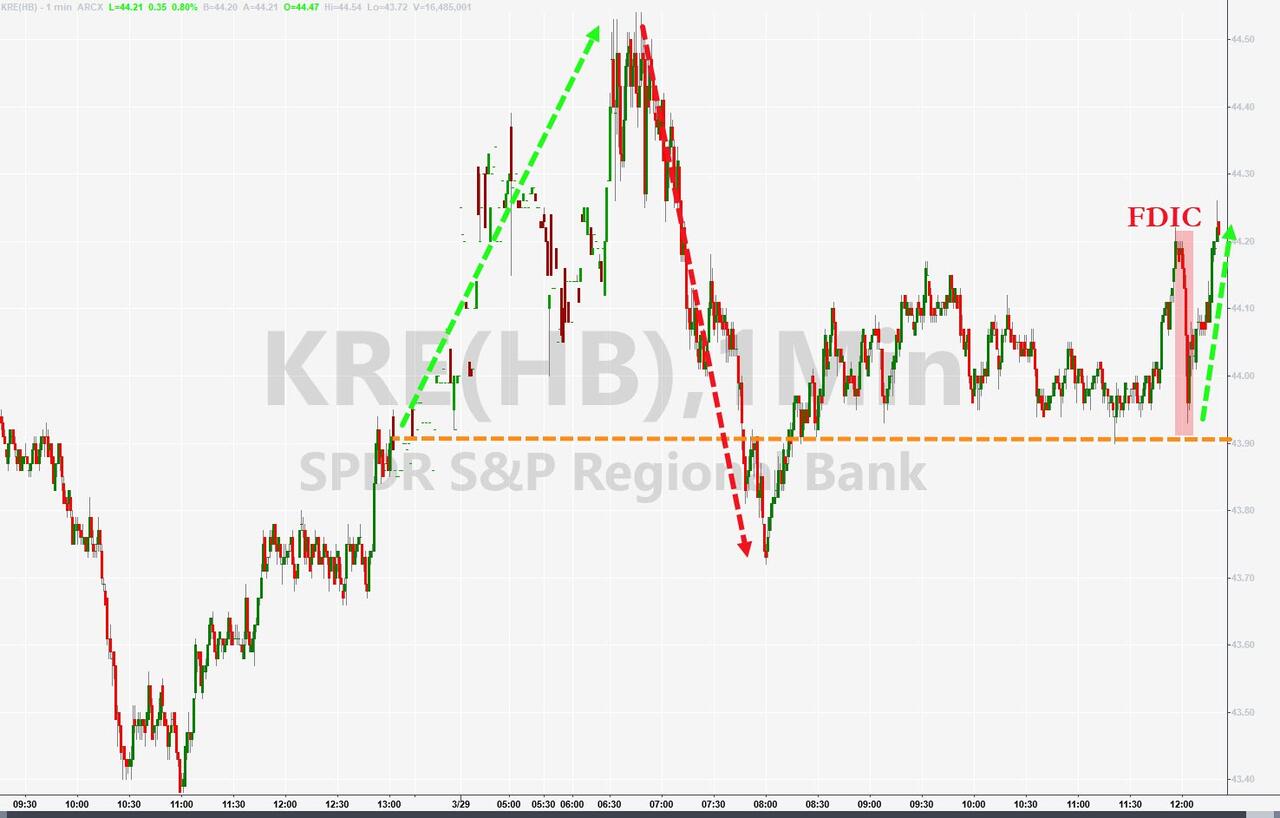
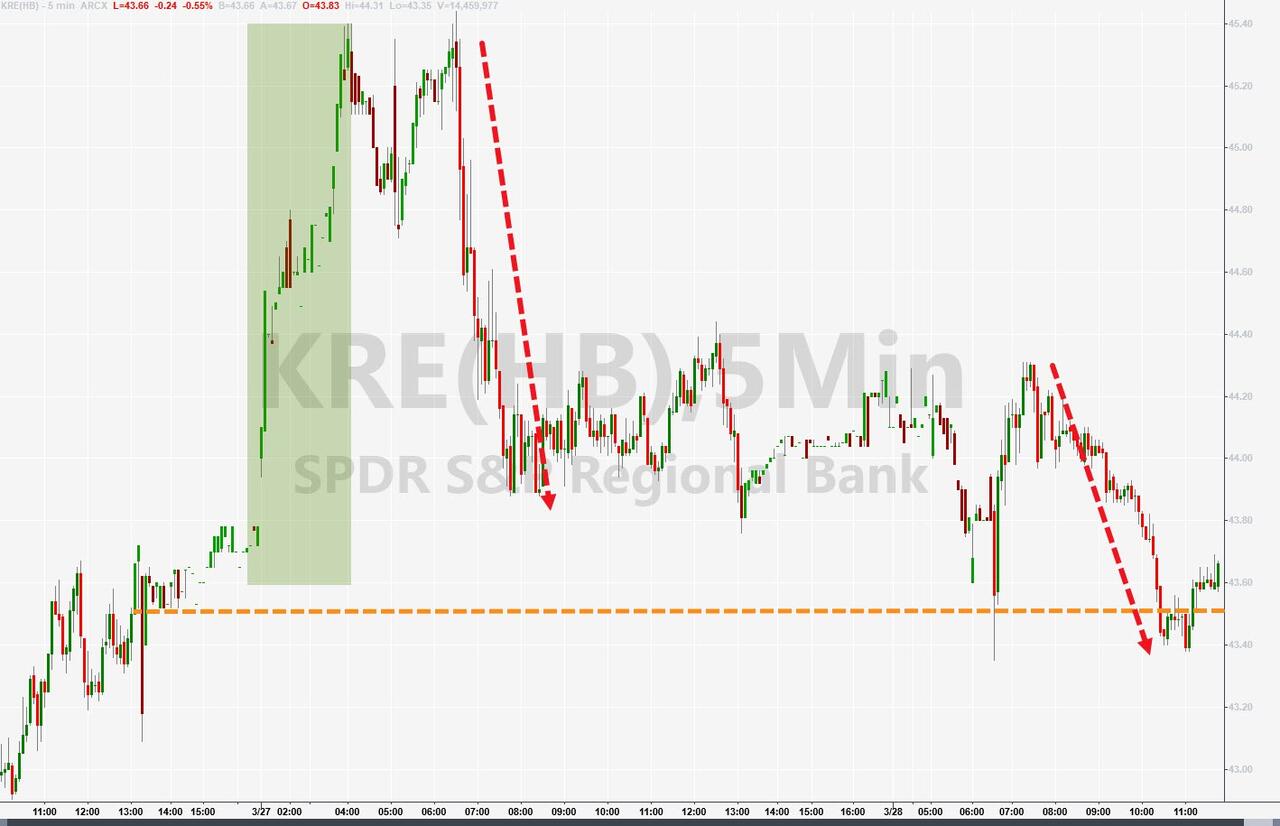
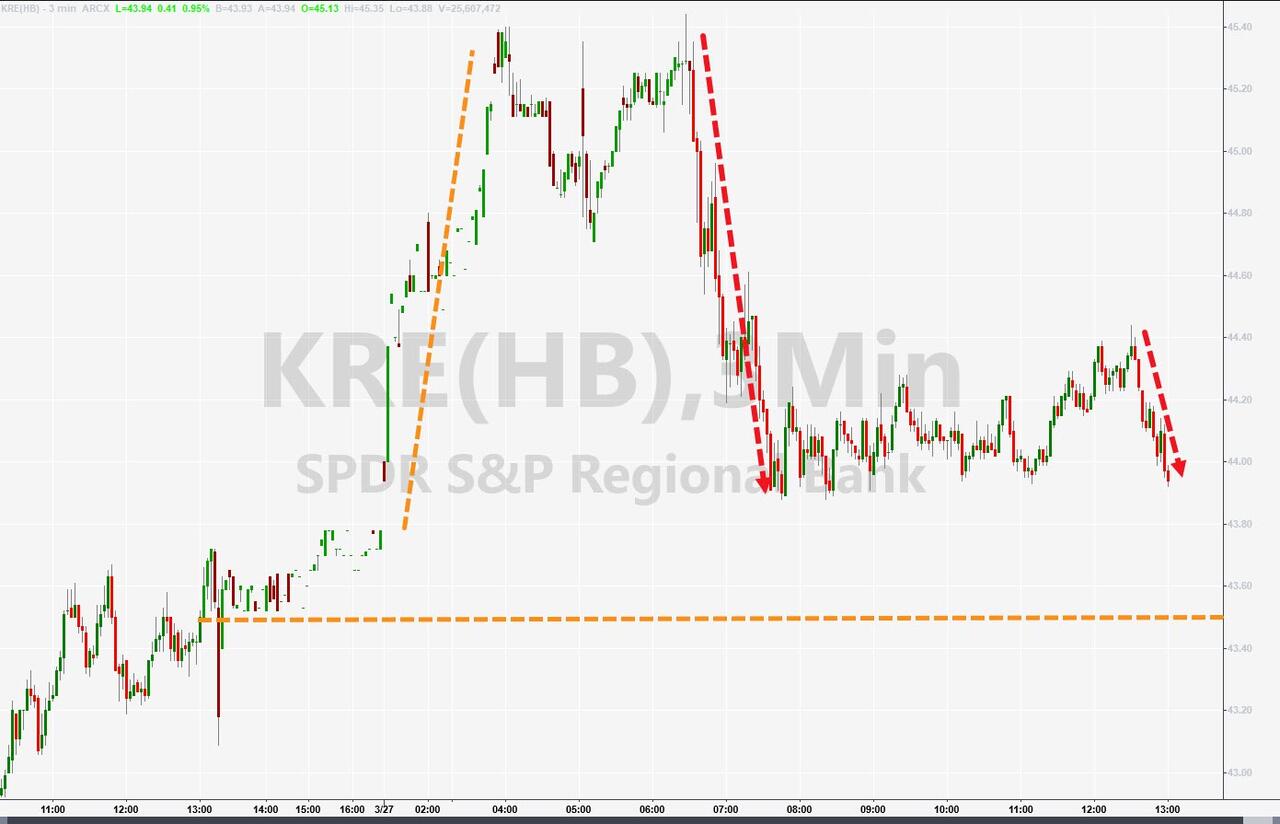
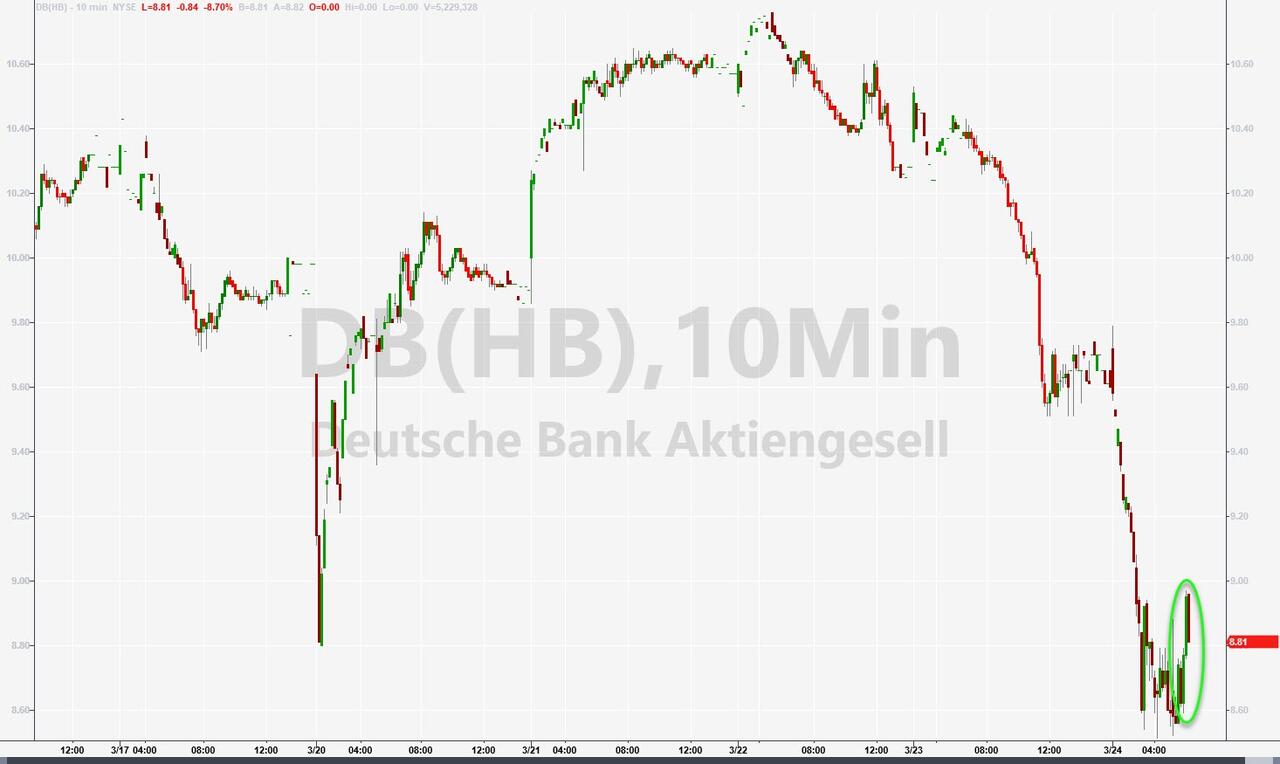
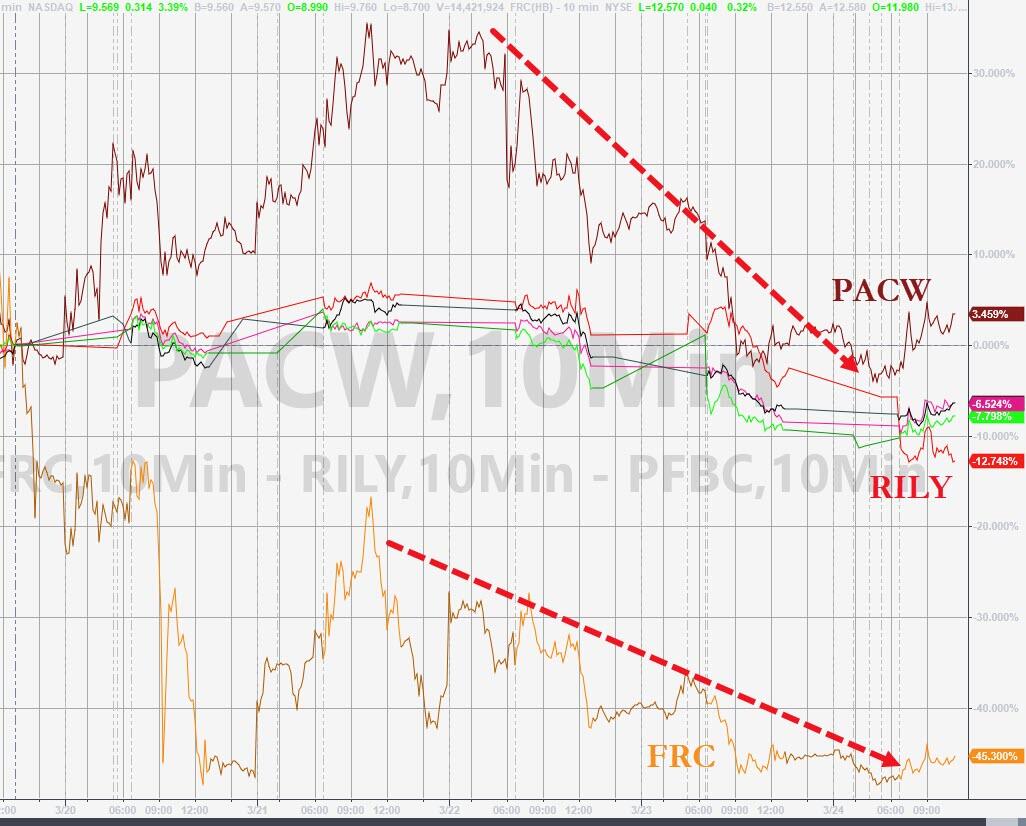
The regional banking sector’s ETF KRE pumped, dumped, and pumped again, which is surely not a sign of certainty or directional clarity. A similar rollercoaster happened to the big banks with KBWB first tanking and then cranking.
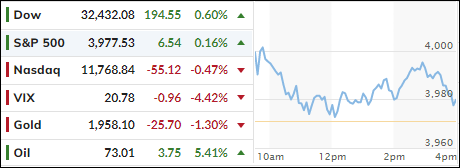
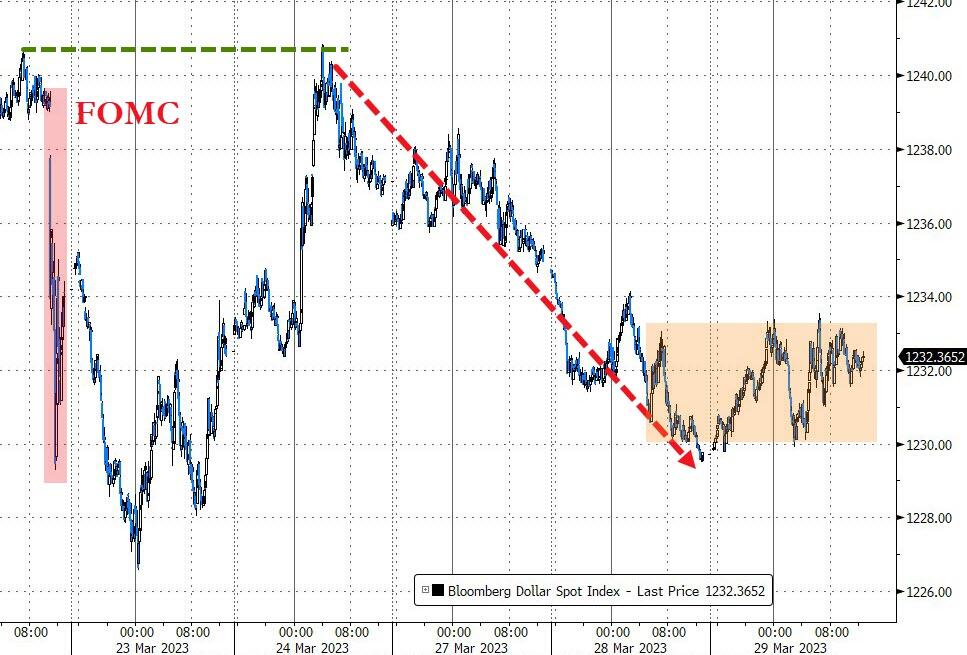
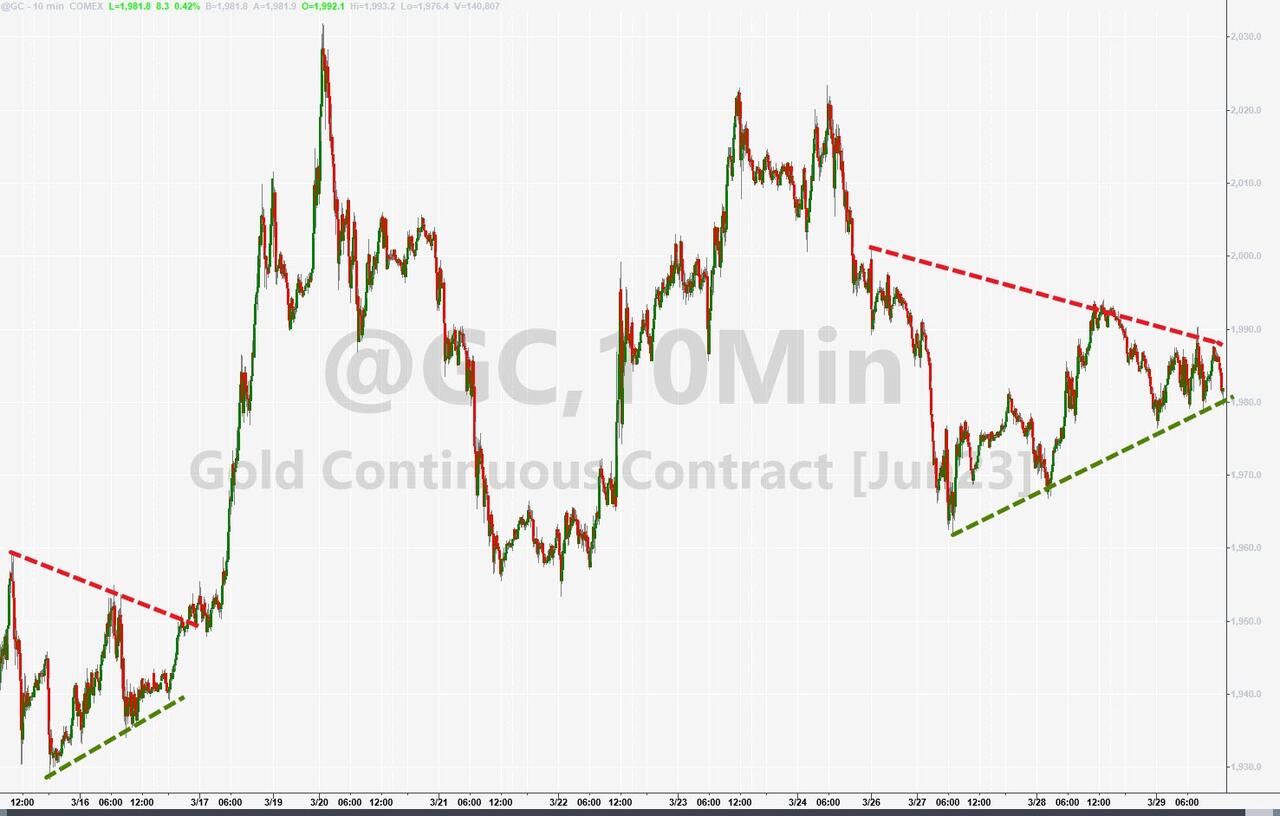
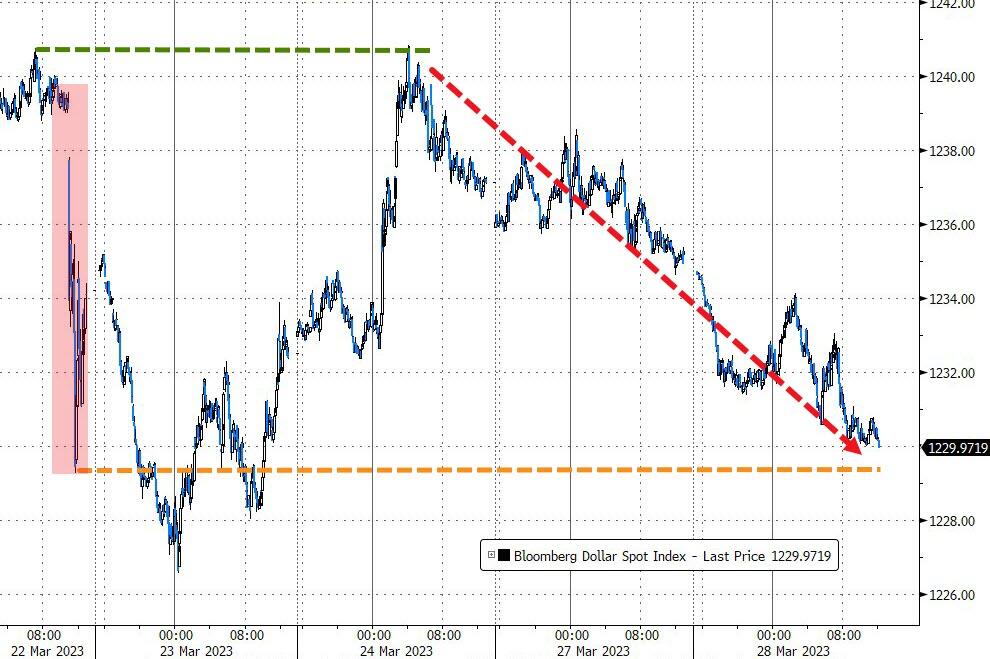
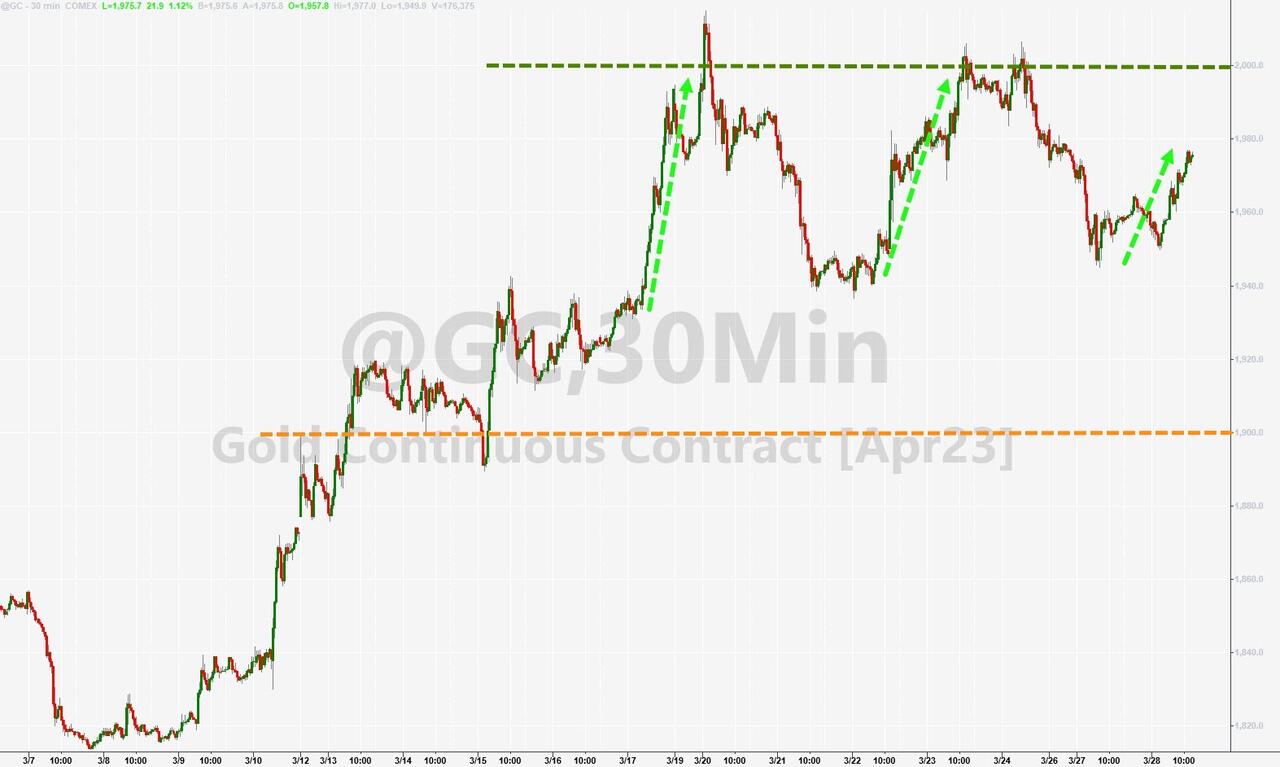
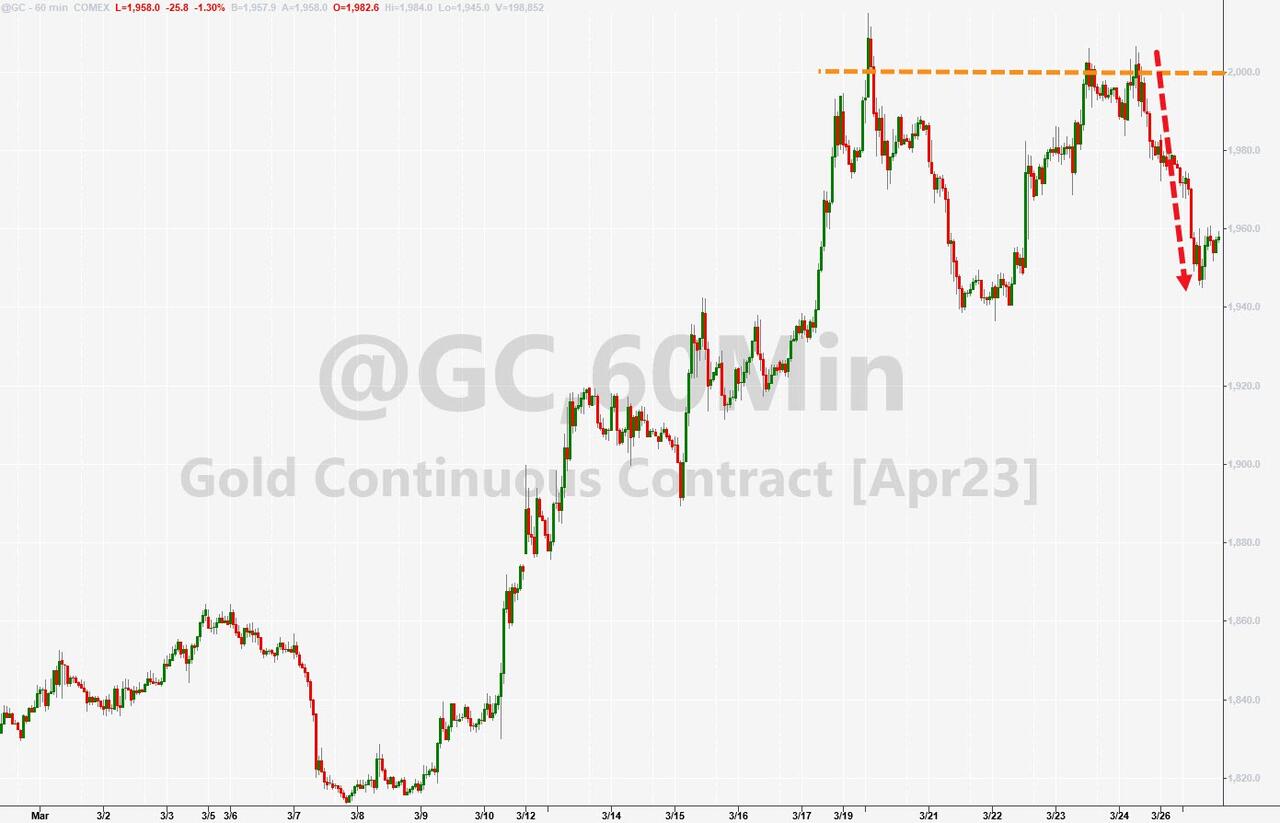
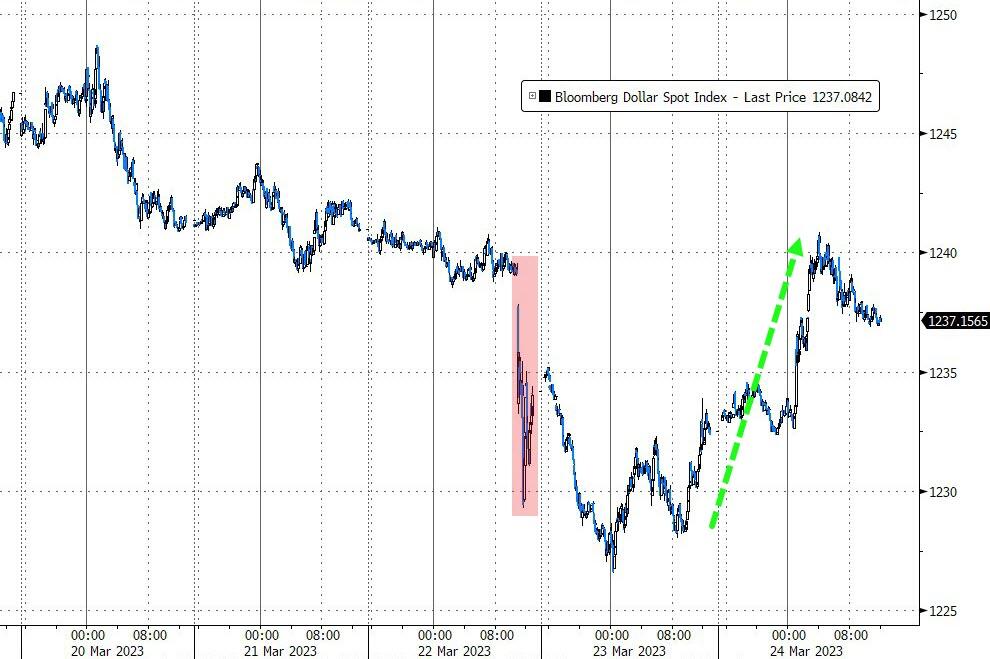
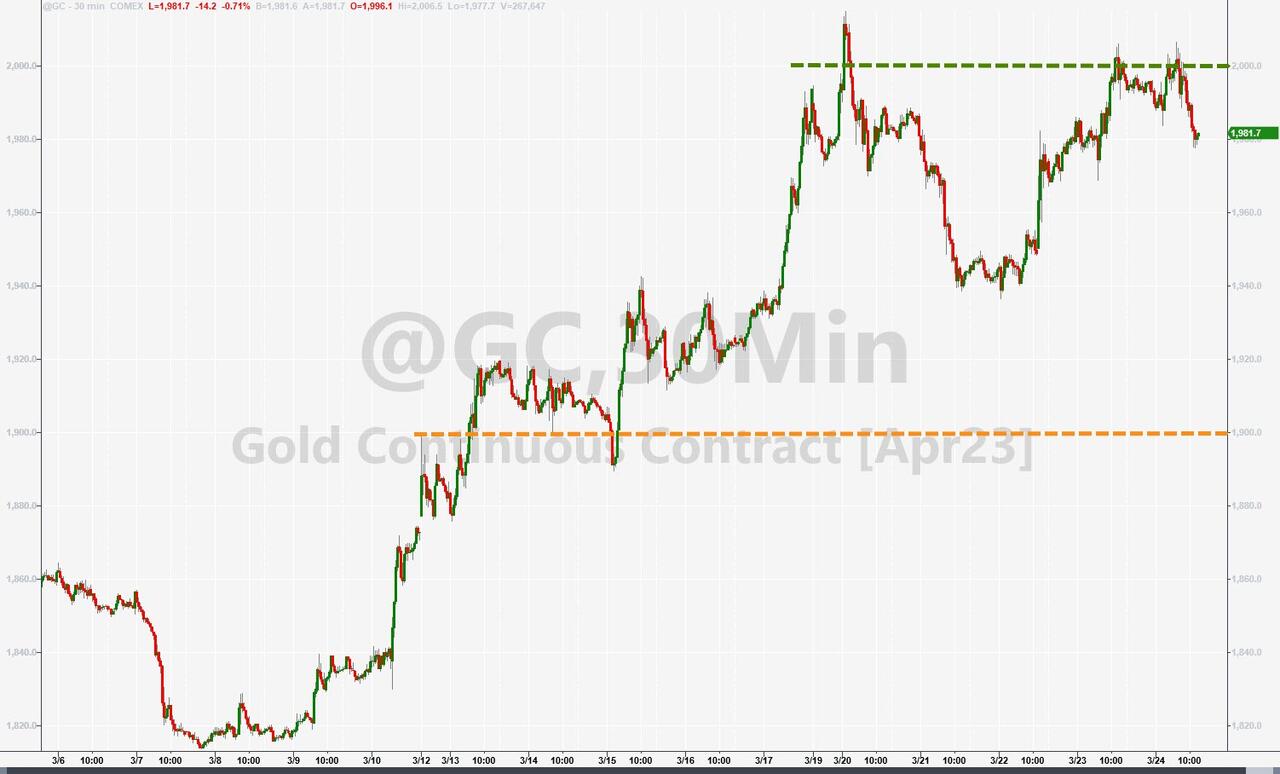
The US Dollar limped sideways, while Gold slipped but stayed above its $1,950 level and within striking distance of again taking out its $2,000 resistance point.
With today’s ramp, our Domestic TTI climbed back above its long term trendline for the first time in 3 weeks. Please see section 3 below for details.
Read More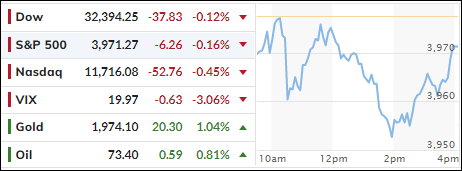
