Equities Rally On Buyout Hopes; Europe Bounces Back On Data

Ulli Market Commentary Contact

Tue pic

[Chart courtesy of MarketWatch.com]

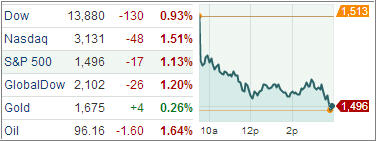
US stocks rebounded Tuesday to recoup much of the previous day’s biggest loss of the year for benchmark indexes as investors found confidence in robust corporate earnings and PC-maker Dell Inc’s decision to go private in the biggest leveraged buyout deal since the financial crisis.

Shares found some support in today’s economic data. The Institute for Supply Management’s index of US non-manufacturing businesses, which covers about 90 percent of the economy, dropped to 55.2 in January from 55.7 in the prior month. Any reading above 50 indicates expansion and, when considered in combination with last week’s better-than-expected manufacturing report, it becomes evident that the private-sector is holding up OK despite the turbulence in the public sector.

Separately, a CoreLogic report showed US home prices rose 0.4 percent in December, bringing the yearly gain to 8.3 percent and marking its biggest rise since May 2006.

Read More

02-05-2013

Ulli Newsletter Archives Contact

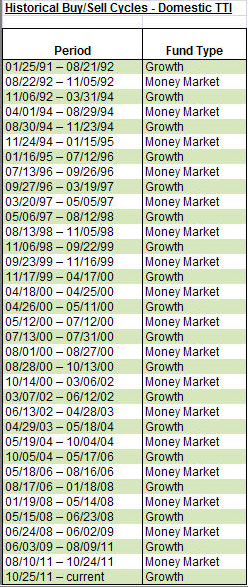
Buy-Sell Cycles

The ETF/No Load Fund Tracker—Monthly Review—January 31, 2013

Equities End January With A Bang; Europe Rise On US Economic Data

US equity averages saw broad gains as December’s last-minute budget deal, to avoid the so-called fiscal cliff, and a wave of economic numbers in January ensured more money flowed into equity funds than bond funds for the first time since 2007.

The benchmark S&P 500 jumped 5 percent for the month, hitting its highest level since December 2007 and marking its best January since 1997 when it added 6.1 percent. The benchmark index finished with a gain in 13 out of 21 sessions for the month.

Of course, let’s not forget that the main driver for this parabolic rise was not the underlying economy but merely the reckless money creation by the Fed at the tune of $85 billion a month. At that rate, it‘s only logical that some of that money finds its way into the stock market.

As we saw, much of the economic data released during the month came up short. Five out of seven January reports fell short of expectations.

Employment, the most crucial indicator on the economy’s health, remained a sticky issue. The economy added a modest 157,000 jobs in January, falling short of the 170,000 forecast by analysts, while the unemployment rate ticked up 0.1 percent to 7.9 percent. The hiring pace in January showed businesses are somewhat cautious about taking on new employees amid a weak growth outlook, a hike in US taxes and the continued budget wrangling in Washington over the crucial debt-ceiling issue.

But more importantly, the rise in the unemployment rate means the Federal Reserve is unlikely to curb its bond buying program any time soon. Also interest rates are likely to be held at ultra-low levels until the jobless rate falls to the Fed’s stated target of 6.5 percent. Consumer spending accounts for 70 percent of the US economy, and the Fed wants to make it easier for people to buy homes, cars and other big-ticket items.

In other words, while more fuel to continue the rally is being generated, it’s questionable in my mind, how long this disconnect between stock market levels and economic fundamentals can continue. Sooner or later, this difference will matter and either the economy picks up steam enough to justify the recent rally or the market indexes come back down to align with reality.

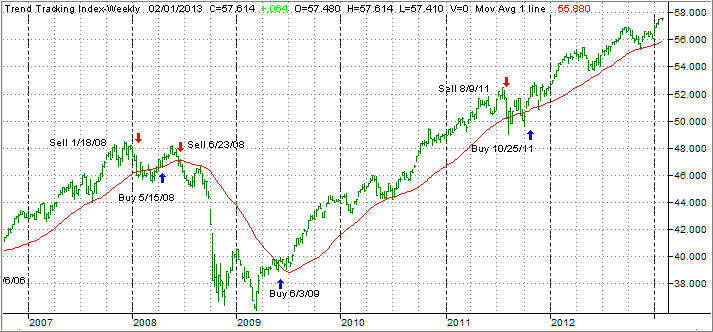
Our main directional gauge, the Domestic Trend Tracking Index (TTI), headed higher and is now positioned as follows:
TTI

As of last Friday, the TTI (green line) had rallied above its long term trend line (red) by +3.10% indicating a strong bullish position.

With the market indexes and our TTI being at multiyear highs, my preference remains to be balanced in our approach and not be recklessly exposed to equities only. While equity only exposure can have its rewards, it is a risky proposition given the fact that the only reason we are in nosebleed territory is due to monetary stimulation by the Fed.

I have mentioned it before, but it’s worthwhile repeating. None other than the NY Fed itself stated last December that the S&P 500 should be trading at a level of 700 (current level is 1,500) were it not for the variety of stimulus programs enacted over the past few years.

During this past month, I increased our holdings in Real Estate Trusts (VNQ) and Consumer Staples (XLP), both of which have performed well in the past but have also held up fairly well during market pullbacks.

The same applies to the Dow Jones Dividend Index (DVY), which was also added again to our current menu. Rounding out our exposure were additional bond purchases in BOND and PONDX.

We are now having primarily balanced portfolios with bonds providing a temporary buffer against equity declines; of course, our trailing sell stops will be our ultimate risk protection as I believe that continued market manipulation by the Fed will have unintended consequences with the big one being a sharp hit to equities and eventually to bonds.

However, as long as the rally goes on, we will participate, but I am well aware that there is a limit to this euphoria, and I am prepared to exit should the need arise.

Major Market Indexes Lose Face-Off with Gravity; Europe Dives

Ulli Market Commentary Contact

Mon pic

[Chart courtesy of MarketWatch.com]

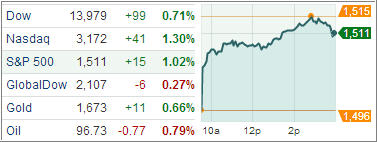
I did not think it was possible that the markets were actually able to lose a face-off with gravity after their relentless and almost uninterrupted ascent since mid-November. Even the by now well documented afternoon “lift-a-thon” was notably absent, as the major market indexes took their cue from Europe and produced their worst loss of this year.

Certainly, a correction was long overdue since this current trend is simply unsustainable; however, the trigger point causing this uncertainty was Europe, or more specifically rising Italian and Spanish bond yields caused by the corruption scandal in Spain along with hidden Italian bank losses and cover ups.

Well, I for one am glad to hear that Europe is fixed as the main stream media have been jaw boning about for the past few weeks. Now, all of a sudden, the sovereign debt crisis has gained momentum again as investors realized that nothing has been resolved; issues have been merely postponed.

Read More

ETFs/Mutual Funds On The Cutline – Updated Through 2/1/2013

Ulli ETFs on the Cutline Contact

Below are the latest ETF Cutline reports, which show how far above or below their respective long-term trend lines (39 week SMA) my currently tracked ETFs/MFs are positioned.

The first report covers the ETF Master List from Thursday’s StatSheet and includes 398 ETFs, of which currently 368 (last week 371) of them are hovering in bullish territory.

The second report includes only High Volume ETFs. To clarify, High Volume (HV) ETFs are defined as those with an average daily volume of $10 million or higher.

These ETFs are generated from my selected list of some 93 that I use in my advisor practice. It cuts out the “noise,” which simply means it eliminates those ETFs that I would never buy because of their volume limitations. 85 ETFs (last week 85) have managed to remain in bullish territory after the recent market volatility.

The third report covers Mutual Funds on the Cutline. There are currently 810 (last week 804) above the line and 49 below it out of the 859 that I follow.

Take a look:

1. ETF Master Cutline Report

2. ETF High Volume Cutline Report

3. MF Cutline Report

In case you are not familiar with some of the terminology used in the reports, please read the Glossary of Terms.

Last Week In Review: ETF News And Blog Posts To 2/3/2013

Ulli Market Review Contact

In case you missed it, here’s a summary of the ETF topics and market reviews I posted to my blog during the week ending on 2/3/2013.

After the S&P 500 broke its 1,500 milestone level last week, it was now the Dow’s turn, which conquered its own respective 14,000 marker on Friday. With 1,500 now clearly in the rear view mirror, I am running out of superlatives to describe this equity march into the stratosphere.

Sure, as I have repeatedly posted, whenever you create a reckless amount of money, such as the Fed’s $85 billion per month, a good part of it will look for a new home and equities are the place of choice despite poor earnings, a weak GDP and other numbers that in no way support these lofty levels.

Since we don’t control any of these issues, we will simply follow the trends as long as they last and exit our positions whenever our trailing sell stops give us the sign to do so. That eliminates any kind of guesswork or emotional decision making.

Over past week, we covered the following:

Read More

One Man’s Opinion: Do Bond Markets Pose The Biggest Risk?

Ulli Market Commentary Contact

92835431“If there is something untoward coming at us that people haven’t anticipated, it’s probably going to come from the fixed-income side,” says Michael Aronstein, president of Marketfield Asset Management. That’s where the participation is, that’s where the expectation is the highest and the fear of something disruptive is the lowest, he added.

Asked why something disruptive hasn’t happened yet in the fixed-income market, Michael said it is beginning to happen. We had a pretty substantial backup in all high grade bonds since the Fed embarked on its latest program (of buying mortgage bonds). The 10-year US Treasury notes bottomed out at 1.40 percent last year and the yield is at two percent now. Treasury yields are unlikely to come down again and the 31-year long bull-run in the bond markets exhausted in last summer.

Asked how should investors play in the bond markets, Michael said he would be very careful in holding fixed-income products and examine how much duration risk it has in high-grade bonds. It’s interesting to note that we have essentially the same structure in housing finance now (that we had before the crisis), he observed.

Read More