New ETFs On The Block: Wisdomtree Global Corporate Bond Fund (GLCB)

Ulli Bond ETFs Contact

56371366WisdomTree Investments, the New York-based ETF sponsor with over $20 billion in assets under management and known for its fundamentals-focused funds, has rolled out an actively managed global corporate bond ETF to be sub-advised by Western Asset Management Company (Western Asset).

The WisdomTree Global Corporate bond Fund (GLCB) is one of the first funds that blend a diverse portfolio of both developed and emerging market corporate debt with an aim to maximize total return through coupon income and capital appreciation.

GLCB invests in both dollar and non-dollar denominated investment grade and high-yield securities issued by private, public and state-owned or sponsored corporations from around the world, including the US. The fund will invest at least 80 percent of net assets, plus the amount of any borrowings for investment purposes, in corporate debt. Corporate debt includes fixed income securities such as bonds, notes, money market instruments and loan participation notes.

Read More

02-01-2013

Ulli Newsletter Archives Contact

ETF/No Load Fund Tracker Newsletter For Friday, February 1, 2013

ETF/No Load Fund Tracker StatSheet

————————————————————-

THE LINK TO OUR CURRENT ETF/MUTUAL FUND STATSHEET IS:

https://theetfbully.com/2013/01/weekly-statsheet-for-the-etfno-load-fund-tracker-newsletter-updated-through-01312013/

————————————————————

Market Commentary

Friday, February 1, 2013

DOW TOPS 14,000 ON JOBS DATA; EUROPE RISES AS US RECOVERY ALLEGEDLY GAINS TRACTION

US stocks rallied Friday with the Dow Industrials closing above 14,000 for the first time since 2007 after upbeat reports on the labor market and manufacturing boosted investor confidence in the world’s largest economy.

Markets surged after a Labor Department report showed the economy added 157,000 jobs in January following a revised 196,000 gain in the previous month and a 247,000 spike in November. The revisions revealed the economy added 335,000 more jobs than originally reported. Though the January reading fell short of the 180,000 rise projected by economists, investors were encouraged by the fairly healthy 181,000 per month addition in 2012. Unemployment rate, however, ticked higher to 7.9 percent in January from 7.8 percent in the previous month.

Separately, the Institute for Supply Management’s manufacturing index rose to a nine-month high of 53.1 in January, topping estimates of 50.5, in a sign that manufacturing is on the path to recovery.

The University of Michigan/Thomson Reuters monthly index of consumer confidence rose to 73.8 in January from 72.9 in the previous month. Economists were expecting a reading of 71.4.

A Commerce Department report showed construction spending rose 0.9 percent in December, coming in well above expectations.

The Dow Jones Industrial Average (DJIA) zoomed 149 points to 14,010, up 0.8 percent over last Friday and capping its fifth straight week of gains. The S&P 500 Index (SPX) rose 15 points to 1,513, with all the 10 business groups within the benchmark index advancing for the day. Telecommunications led today’s gains while the index added 0.7 percent for the week.

Treasuries slipped Friday, pushing yields to nine-month highs after a Labor Department report showed the US economy added more jobs than previously estimated, adding to signs the economic recovery is gaining traction.

Most European stocks posted solid gains on Friday though equity averages slumped to their biggest weekly decline this year after a report earlier in the week showed the US economy shrank unexpectedly in the fourth quarter and Spain’s regulator’s lifted a ban on shorting equities.

Data from the eurozone showed unemployment rate remained unchanged at 11.7 percent in December while it was revised down to 11.7 percent from 11.8 percent for November.

Separately, a report showed manufacturing in the currency union contracted at its slowest pace in 11 months in January. Markit’s final PMI reading rose to 47.9 from 46.1 in December. Reading below 50 indicates contraction.

Trend wise, our Trend Tracking Indexes (TTIs) followed the markets and ended the week as follows:

Domestic TTI: +3.10% (last week +3.21%)

International TTI: +11.94% (last week +11.52%)

Again, with the Fed having both hands on the print button to generate some $85 billion of new money every month, some of it is bound to find its way into the stock market. How long this can go on considering the total disconnect from fundamentals is anyone’s guess, but it behooves to be prepared to exit should this rampage come to an end all of a sudden.

Have a great week.

Ulli…

————————————————————-

READER Q & A FOR THE WEEK

All Reader Q & A’s are listed at our web site!
Check it out at:

http://www.successful-investment.com/q&a.php

A note from reader Don:

Q: Ulli: Considering the Fed’s current monetary policy, when would be the appropriate time to consider investing in a Bear ETF like TBF ProShares Short 20+ Year Treasury?

A: Don: A good time would be once TBF breaks above its long-term trend line to the upside, which it recently did. If you are an aggressive investor, you can look for some limited exposure, but use a trailing sell stop.

The Fed’s policies call for continued lower interest rates, and TBFs move could be just a dead cat bounce. That would also be true in case equities take a dive, which they will but the timing of it is totally up in the air.

———————————————————-

WOULD YOU LIKE TO HAVE YOUR INVESTMENTS PROFESSIONALLY MANAGED?

Do you have the time to follow our investment plans yourself? If you are a busy professional who would like to have his portfolio managed using our methodology, please contact me directly or get more details at:

https://theetfbully.com/personal-investment-management/

———————————————————

Back issues of the ETF/No Load Fund Tracker are available on the web at:

https://theetfbully.com/newsletter-archives/

ETF/No Load Fund Tracker Newsletter For Friday, February 1, 2013

Ulli ETF Tracker Contact

ETF/No Load Fund Tracker StatSheet

————————————————————-

THE LINK TO OUR CURRENT ETF/MUTUAL FUND STATSHEET IS:

https://theetfbully.com/2013/01/weekly-statsheet-for-the-etfno-load-fund-tracker-newsletter-updated-through-01312013/

————————————————————

Market Commentary

Friday, February 1, 2013

DOW TOPS 14,000 ON JOBS DATA; EUROPE RISES AS US RECOVERY ALLEGEDLY GAINS TRACTION

US stocks rallied Friday with the Dow Industrials closing above 14,000 for the first time since 2007 after upbeat reports on the labor market and manufacturing boosted investor confidence in the world’s largest economy.

Markets surged after a Labor Department report showed the economy added 157,000 jobs in January following a revised 196,000 gain in the previous month and a 247,000 spike in November. The revisions revealed the economy added 335,000 more jobs than originally reported. Though the January reading fell short of the 180,000 rise projected by economists, investors were encouraged by the fairly healthy 181,000 per month addition in 2012. Unemployment rate, however, ticked higher to 7.9 percent in January from 7.8 percent in the previous month.

Separately, the Institute for Supply Management’s manufacturing index rose to a nine-month high of 53.1 in January, topping estimates of 50.5, in a sign that manufacturing is on the path to recovery.

Read More

Weekly StatSheet For The ETF/No Load Fund Tracker Newsletter – Updated Through 01/31/2013

Ulli ETF StatSheet Contact

ETF/Mutual Fund Data updated through Thursday, January 31, 2013

Table of Content082312

If you are not familiar with some of the terminology used, please see the Glossary of Terms.


1. DOMESTIC EQUITY MUTUAL FUNDS/ETFs: BUY — since 10/25/2011

TTI

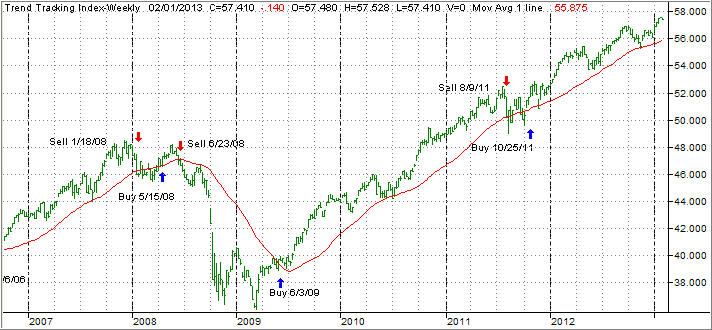
The domestic TTI broke through its long-term trend line generating a Sell for this area effective 8/9/2011. Over the recent past, we’ve seen the TTI hovering slightly below and above this dividing line between bullish and bearish territory. The clear break to the upside occurred on 10/24/11 and, effective 10/25/11, a new Buy signal for domestic equities went into effect.

As of today, our Trend Tracking Index (TTI—green line in above chart) has bounced off its long term trend line (red) by +2.87% as part of the post election rebound.

To avoid a potential whip-saw, a Sell signal to move out of all domestic equity positions will be generated once we have clearly pierced the line to the downside. Be sure to tune into my blog for the latest updates.

Read More

Equity Indexes Retreat, But Notch Strong January; Europe Edges Lower

Ulli Market Commentary Contact

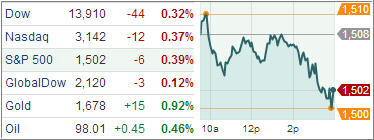
Thur pic

[Chart courtesy of MarketWatch.com]

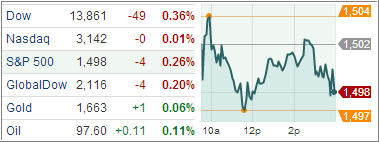
Equity ETFs finished lower Thursday, ending a blockbuster month on a soft note after a government report showed jobless claims rose, but the Dow Jones Industrial Average still managed to produce the best January rally since 1994.

First time claims for unemployment benefits climbed 38,000 to 368,000 last week, the first rise in two weeks, a Labor Department report showed. The weekly data comes ahead of tomorrow’s all-important nonfarm-payrolls number for January.

Separately, a Commerce Department report showed consumer spending rose by 0.2 percent while personal income jumped 2.6 percent in January, boosted by early dividend payments. The Chicago-area Purchasing Manager’s Index rose to 55.6 in January, the highest level since April 2012, from an upwardly revised 50 level.

Read More

GDP Experiences Shrinkage; Stocks Retreat On Growth Worries; Europe Falls After US Economic Data

Ulli Market Commentary Contact

Wed pic

[Chart courtesy of MarketWatch.com]

US equities finished lower Wednesday, dragging the index averages off five-year highs after the Federal Reserve said economic growth had paused following the release of a government report that showed the US economy contracted in the fourth quarter.

The Federal Open Market Committee kept interest rates unchanged at near zero and maintained its aggressive bond-buying program. The central bank said it will keep purchasing bonds at the rate of $85 billion a month after concluding its two-day policy-setting meeting today.

Earlier in the day, the Commerce Department said the economy contracted at a 0.1 percent annual pace in the final quarter of last year, falling short of the 1 percent growth projected by economists.

Gross Domestic Product, the aggregate of all goods and services produced, fell to its lowest level since the second quarter of 2009, when the economy was still in recession. Today’s report, however, contained a few bright spots such as an uptick in business investment, consumer spending and home building, suggesting the pause was probably due to bad weather and other transitory factors, and the underlying economy possibly grew at around 2 percent, if you can believe this type of Main Stream Media spin.

Read More