02-08-2013

Ulli Newsletter Archives Contact

ETF/No Load Fund Tracker Newsletter For Friday, February 8, 2013

ETF/No Load Fund Tracker StatSheet

————————————————————-

THE LINK TO OUR CURRENT ETF/MUTUAL FUND STATSHEET IS:

https://theetfbully.com/2013/02/weekly-statsheet-for-the-etfno-load-fund-tracker-newsletter-updated-through-02072013/

————————————————————

Market Commentary

Friday, February 8, 2013

US AND EUROPE RISE ON TRADE DATA

US stocks advanced Friday on strong trade data, pushing the S&P 500 to the highest level since November 2007 though the Dow Industrials retreated for the week, snapping a five-week long winning streak.

Stocks received some support from economic data in early trade. A report by the Commerce Department showed trade deficit narrowed to $38.5 billion in December from $48.6 billion in the previous month, thanks to record exports of petroleum products. Today’s better-than-expected trade data may lead to revisions of fourth-quarter GDP numbers into positive territory.

Trade data released by China’s customs administration showed exports jumped 25 percent and imports climbed 29 percent, adding to evidence of a growth rebound in the world’s second largest economy.

The Dow Jones Industrial Average (DJIA) rose 49 points to 13,993, after rising to an intraday high of 14,022 though it recorded its first weekly decline in six, dropping 0.1 percent for the week while the S&P 500 Index (SPX) added 9 points and climbed 0.3 percent.

Treasuries were little changed on Friday though the benchmark 10-yield posted its biggest weekly decline since November after political leaders agreed to trim the European Union budget, adding to concern that the world’s largest trading bloc will struggle to expand, spurring demand for safe-haven assets.

European stocks surged ahead Friday after robust trade data from the US and China boosted risk sentiment, with banks leading the northward march.

The Stoxx Europe 600 index added 1.2 percent to close at 287.34. Friday’s jump, however, was not good enough to push the index in the green territory for the week and the pan-European index extended losses for the second straight week.

In the ETF space, the Market Vectors Vietnam ETF (VNM) was one of the biggest gainers, adding 3.05 percent for the day.

The Invesco Powershares QQQ Trust Series (QQQ) also jumped, adding 1.03 percent for the day.

Our Trend Tracking Indexes (TTIs) offered a mixed picture as the Domestic TTI headed higher while the International TTI retreated. Both closed the day as follows:

Domestic TTI: +3.35% (last week +3.23%)

International TTI: +11.04% (last week +12.31%)

Have a great week.

Ulli…

————————————————————-

READER Q & A FOR THE WEEK

All Reader Q & A’s are listed at our web site!
Check it out at:

http://www.successful-investment.com/q&a.php

A note from reader John:

Q: Ulli: I’m in the UK and really appreciate your insights to the market in general. I have a question – when do you add to positions? Do you wait for the market to pull back or would you, for example, add funds on a monthly basis. If so would you do so at the moment with markets so over extended? Hope you can help.

A: John: Well, the ideal time is always at the beginning of a buy cycle. However, once time has passed, I try to add new money on down days. Say, we are in bullish territory with my TTI, and I want to add some more VTI, then I would wait for a day when equities are pulling back and place my order at that time.

If I am looking to add a bond position, I use the same approach in that I look for a down day in bonds. For most investors, I recommend a balanced portfolio as opposed to an outright equity one. While it gives you a lesser return, it also decreases the risk quite a bit.

Personally, I am not in favor of adding small amounts on a monthly basis. My preference is to wait until I have say $5k or more and then invest it in a fund/ETF that is appropriate at the time. Again, there is no right or wrong; it’s simply my preference.

———————————————————-

WOULD YOU LIKE TO HAVE YOUR INVESTMENTS PROFESSIONALLY MANAGED?

Do you have the time to follow our investment plans yourself? If you are a busy professional who would like to have his portfolio managed using our methodology, please contact me directly or get more details at:

https://theetfbully.com/personal-investment-management/

———————————————————

Back issues of the ETF/No Load Fund Tracker are available on the web at:
https://theetfbully.com/newsletter-archives/

ETF/No Load Fund Tracker Newsletter For Friday, February 8, 2013

Ulli ETF Tracker Contact

ETF/No Load Fund Tracker StatSheet

————————————————————-

THE LINK TO OUR CURRENT ETF/MUTUAL FUND STATSHEET IS:

https://theetfbully.com/2013/02/weekly-statsheet-for-the-etfno-load-fund-tracker-newsletter-updated-through-02072013/

————————————————————

Market Commentary

Friday, February 8, 2013

US AND EUROPE RISE ON TRADE DATA

US stocks advanced Friday on strong trade data, pushing the S&P 500 to the highest level since November 2007 though the Dow Industrials retreated for the week, snapping a five-week long winning streak.

Stocks received some support from economic data in early trade. A report by the Commerce Department showed trade deficit narrowed to $38.5 billion in December from $48.6 billion in the previous month, thanks to record exports of petroleum products. Today’s better-than-expected trade data may lead to revisions of fourth-quarter GDP numbers into positive territory.

Trade data released by China’s customs administration showed exports jumped 25 percent and imports climbed 29 percent, adding to evidence of a growth rebound in the world’s second largest economy.

The Dow Jones Industrial Average (DJIA) rose 49 points to 13,993, after rising to an intraday high of 14,022 though it recorded its first weekly decline in six, dropping 0.1 percent for the week while the S&P 500 Index (SPX) added 9 points and climbed 0.3 percent.

Read More

Weekly StatSheet For The ETF/No Load Fund Tracker Newsletter – Updated Through 02/07/2013

Ulli ETF StatSheet Contact

ETF/Mutual Fund Data updated through Thursday, February 7, 2013

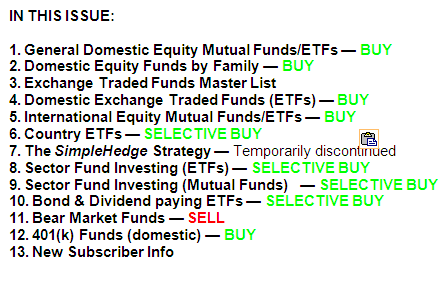
Table of Content082312

If you are not familiar with some of the terminology used, please see the Glossary of Terms.


1. DOMESTIC EQUITY MUTUAL FUNDS/ETFs: BUY — since 10/25/2011

TTI

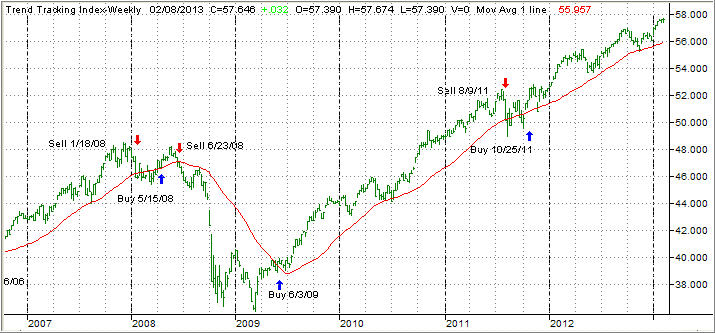
The domestic TTI broke through its long-term trend line generating a Sell for this area effective 8/9/2011. Over the recent past, we’ve seen the TTI hovering slightly below and above this dividing line between bullish and bearish territory. The clear break to the upside occurred on 10/24/11 and, effective 10/25/11, a new Buy signal for domestic equities went into effect.

As of today, our Trend Tracking Index (TTI—green line in above chart) has bounced off its long term trend line (red) by +3.16% as part of the post election rebound.

To avoid a potential whip-saw, a Sell signal to move out of all domestic equity positions will be generated once we have clearly pierced the line to the downside. Be sure to tune into my blog for the latest updates.

Read More

Stock Indexes Lose Steam; Europe Drifts Lower On Draghi

Ulli Market Commentary Contact

Thur pic

[Chart courtesy of MarketWatch.com]

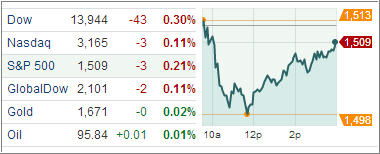
After a two-day advance, US stock indexes drifted lower today as investors lost risk appetite following the release of mixed economic reports, and European policy makers warned a strong euro could hamper the region’s recovery.

On the economic front, applications for weekly jobless benefits dropped to 366,000, down 5,000 from the previous week but above forecasts, Labor Department figures showed. Economists surveyed by Bloomberg had forecast 366,000 claims.

Meanwhile, the nation’s productivity, a measure of employee output per hour, dropped at an annualized two percent in the final quarter of 2012, said the Bureau of Labor Statistics. Following a 3.2 percent gain in the prior three months, that was the worst performance in almost two years.

In addition to economic data, investors sifted through comments from Chicago Fed President Charles Evans who said the Fed’s policies have already done a lot of good and he’s optimistic the economy will allegedly improve soon.

Read More

Index ETFs Rise On Earnings; Europe Slips On Italian Austerity Worries

Ulli Uncategorized Contact

Wed pic

[Chart courtesy of MarketWatch.com]

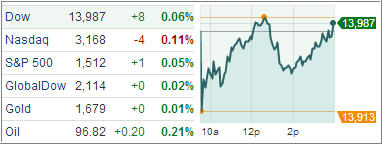
US indexes finished slightly higher Wednesday, recouping early losses as better-than-forecast earnings eclipsed concerns over Europe’s debt crisis ahead of tomorrow’s European Central Bank meeting in Frankfurt.

Equities had slumped earlier amid concerns Europe’s debt crisis may get worse. An opinion poll in Italy showed former Premier Silvio Berlusconi’s anti-austerity campaign has boosted his popularity before this month’s general elections. Berlusconi’s proposals go completely against the policies implemented by the current technocrat Prime Minister Mario Monti, who has accused Berlusconi of trying to buy votes.

Meanwhile, European Central Bank officials are set to meet Thursday while euro-area leaders will gather for a summit in Brussels amid widespread concerns over a rising currency. Greek finance minister Yannis Stournaras today expressed concern over the recent gain in strength of the euro. French President Francois Hollande had voiced concern about the currency’s rapid appreciation yesterday.

Read More

7 ETF Model Portfolios You Can Use – Updated through 2/5/2013

Ulli Model ETF Portfolios Contact

Sitting above and trying to hold on to the 1,500 S&P level was the theme of the past week, as the benchmark index managed to add 3 points since last week’s ETF Model Portfolio was published.

Although that’s not the entire story as the S&P dropped 17 points on Monday only to regain 15 of them back on Tuesday. Maybe some volatility is creeping in at these lofty levels.

With equities having been all the rage this year due to the continued Fed pump fest, it’s not surprising that our bond portfolio is lagging. However, this has only been one month and as equities inch higher, the case for a serious correction becomes much more likely, which should help our bond positions.

Again, some analysts see the old S&P high of some 1,575 taken out before the indexes head down sharply. Since no one really knows, we’ll let our sell stops be our guide as to when to exit any of the current holdings.

Here’s the latest update for our Model ETF Portfolios:

Read More