
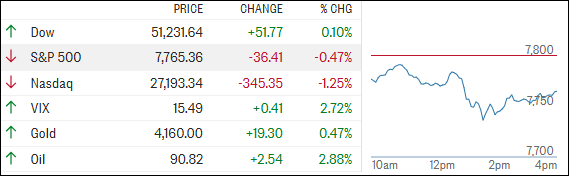
[Chart courtesy of MarketWatch.com]
- Moving the market
Stocks started the day on the defensive as stubbornly high Treasury yields and another spike in oil kept investors on edge. The 10-year hovered around 5.28%, while crude jumped roughly 4% to about $104 as Middle East tensions intensified.
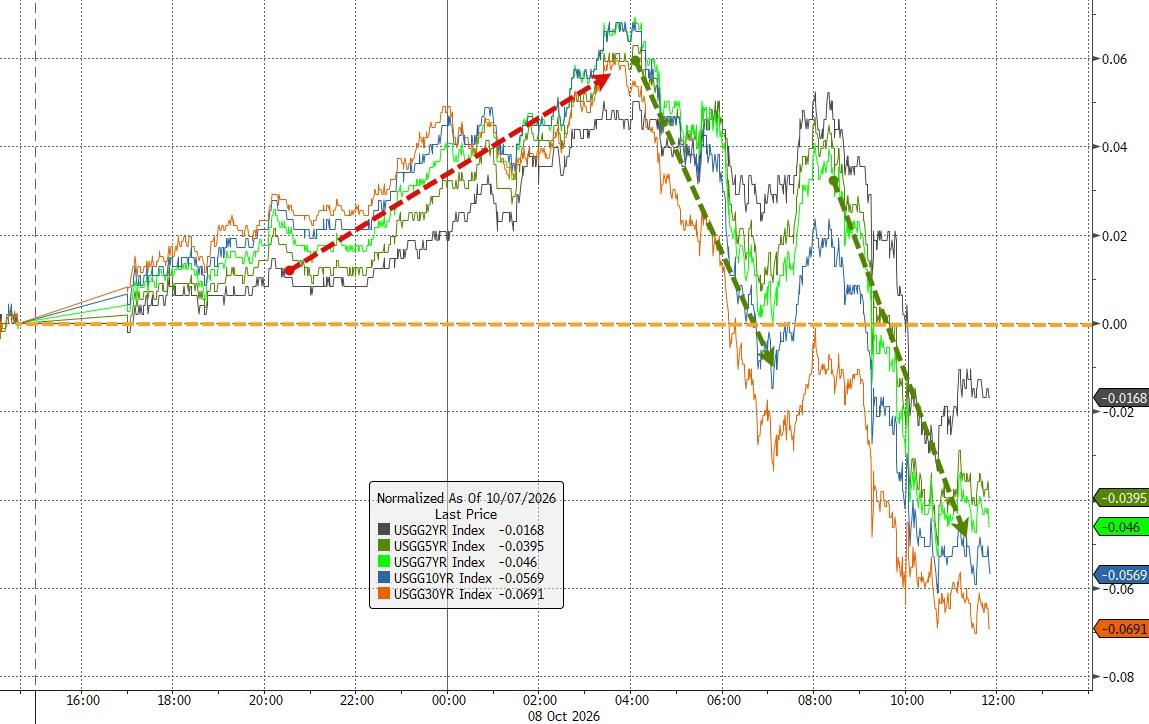
That’s not exactly the recipe the Fed ordered for bringing inflation back under control.
Rate-sensitive areas like banks and technology bore the brunt of the pressure, but the real damage came in the Nasdaq after disappointing reports about OpenAI’s revenues triggered another round of selling across tech and AI stocks.
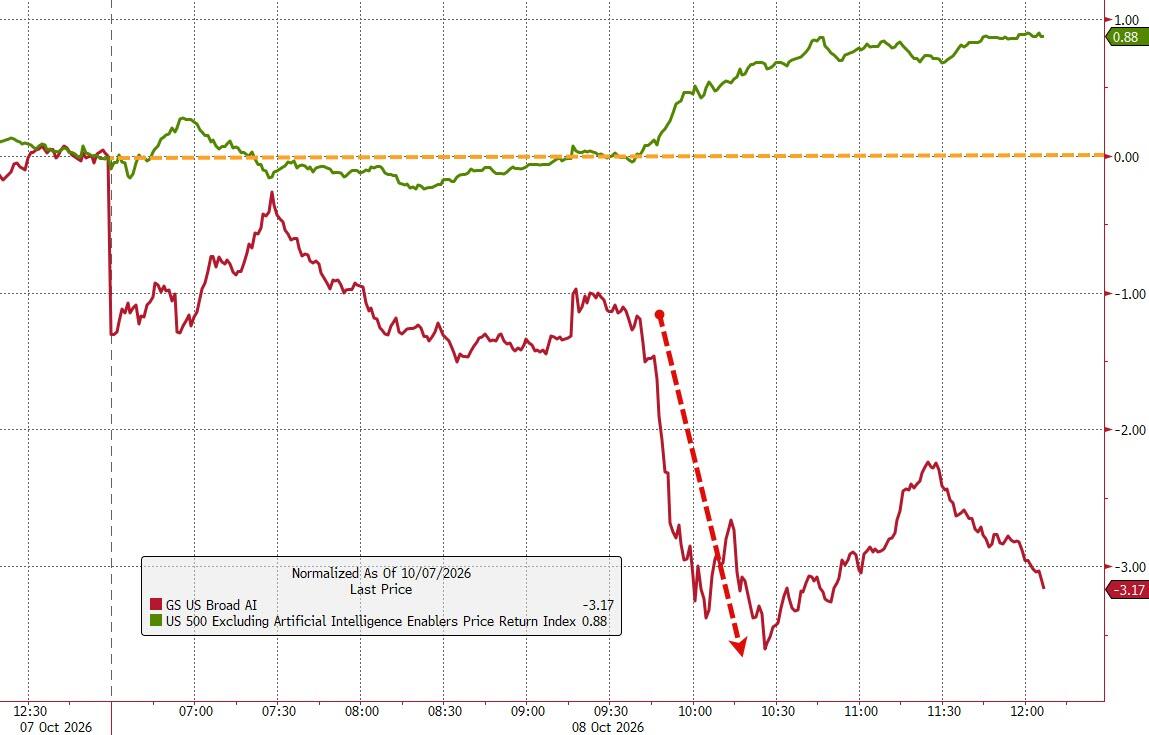
Apparently, even artificial intelligence isn’t immune to very human expectations.
The bigger issue remains oil. Higher energy prices feed inflation, squeeze consumers, and make it harder for the Fed to ease up.
A meaningful drop in crude could quickly take some pressure off yields and stocks, but until geopolitical tensions cool, that remains a big “if.”
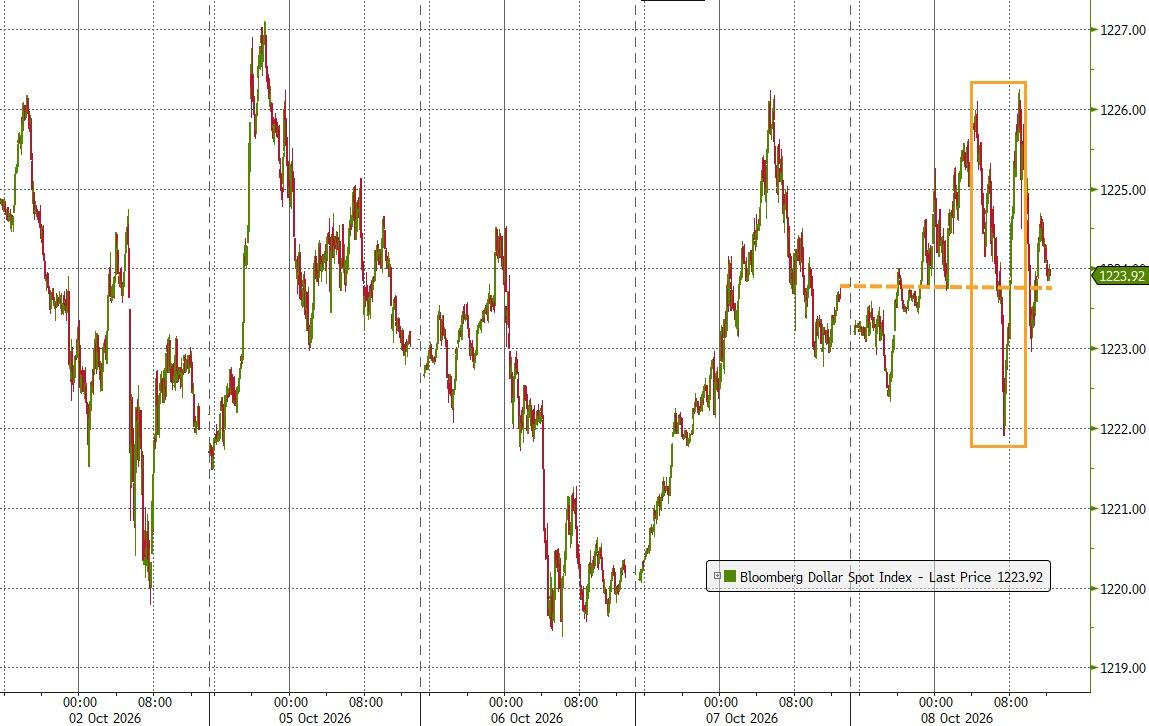
Elsewhere, the dollar went on a wild intraday ride but finished little changed, gold eked out a gain, and Bitcoin tumbled before finding support around $80,000.
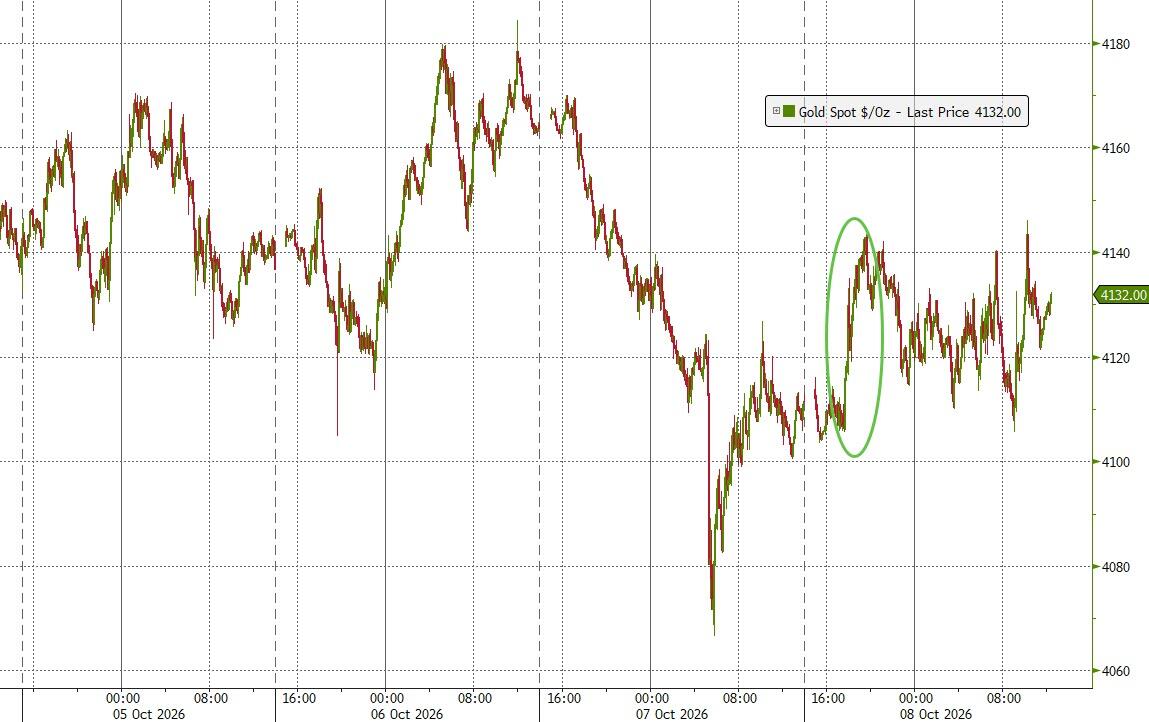
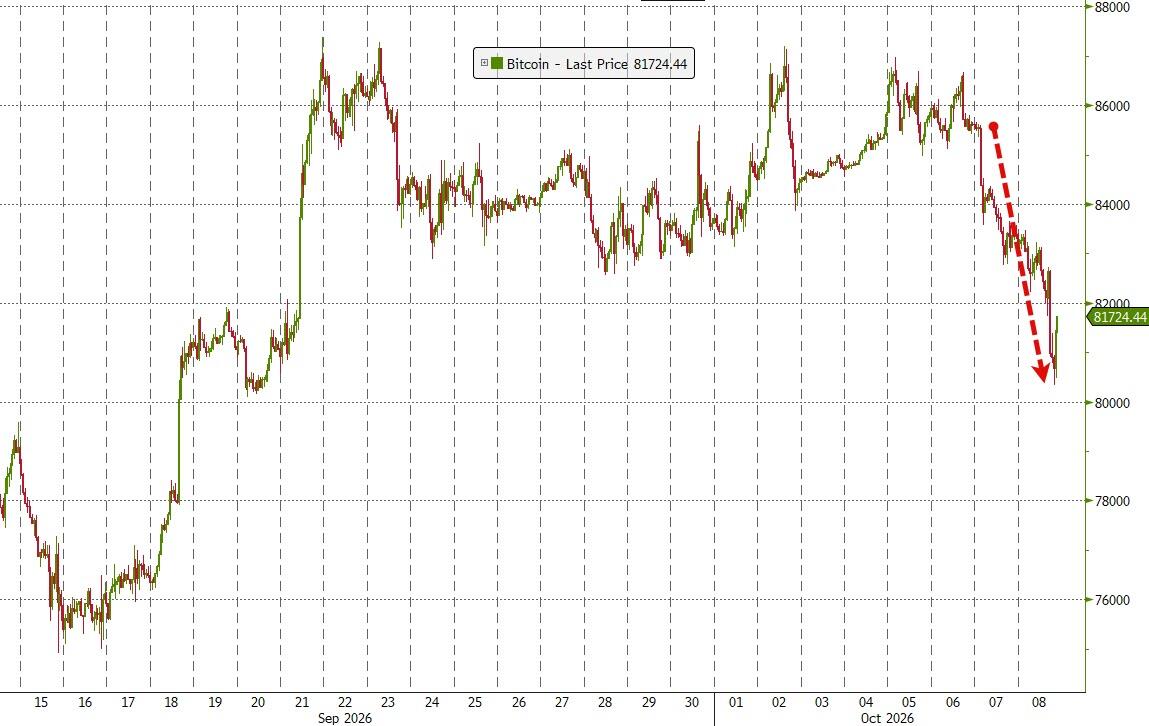
For now, markets seem stuck between strong earnings hopes and the increasingly heavy weight of high oil prices and high real rates.
The question is: can earnings remain strong enough to pull stocks through this economic tug-of-war?
2. Current domestic “Buy” Cycle (effective 5/20/2025); International “Buy” Cycle (effective 5/8/25)
Our domestic bullish cycle that began on November 21, 2023, concluded on April 3, 2025, following a market downturn triggered by President Trump’s tariff policy announcement.
This development caused significant declines across major indexes and broader market indices. However, markets subsequently rebounded, culminating in a new domestic “Buy” signal taking effect May 20, 2025.
Concurrently, our International Trend Tracking Index (TTI) experienced parallel volatility. On April 4, 2025, it breached critical thresholds, prompting a “Sell” recommendation. This position reversed as global markets recovered, with the International TTI regaining sufficient momentum to issue a new “Buy” signal effective May 8, 2025.
3. Trend Tracking Indexes (TTIs)
Tech and AI took it on the chin today, but the rest of the market held up surprisingly well.
The Dow finished in the green, gold moved higher, and our TTIs joined the party with positive closes.
The International TTI mostly treaded water, while the Domestic TTI, our read on the broader market, pushed decisively higher.
Not a great day for the tech crowd, but underneath the hood, the market looked pretty healthy.
This is how we closed 10/08/2026:
Domestic TTI: +3.24% above its M/A (prior close +2.62%)—Buy signal effective 5/20/25.
International TTI: +2.56% above its M/A (prior close +2.58%)—Buy signal effective 5/8/25.
All linked charts above are courtesy of Bloomberg via ZeroHedge.
———————————————————-
WOULD YOU LIKE TO HAVE YOUR INVESTMENTS PROFESSIONALLY MANAGED?
Do you have the time to follow our investment plans yourself? If you are a busy professional who would like to have his portfolio managed using our methodology, please contact me directly to get more details.
Contact Ulli