ETF/No Load Fund Tracker Newsletter For November 28, 2014
ETF/No Load Fund Tracker StatSheet
————————————————————-
THE LINK TO OUR CURRENT ETF/MUTUAL FUND STATSHEET IS:
https://theetfbully.com/2014/11/weekly-statsheet-for-the-etfno-load-fund-tracker-newsletter-updated-through-11262014/?preview=true
————————————————————
Market Commentary
Friday, November 28, 2014
STOCKS EDGE OUT SIXTH STRAIGHT WEEK OF GAINS

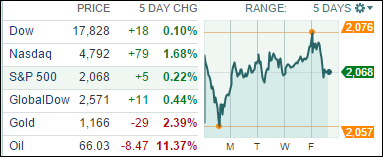
[Chart courtesy of MarketWatch.com]
1. Moving the Markets
Stocks finished higher on the week, marking a sixth straight week of gains. Wall Street has been keeping a close watch on retail stocks as we head into the holiday season, while trying to deal with falling oil prices. For the week, the major indexes gained slightly.
Oil prices continue moving downward. A barrel of Texas Intermediate crude was trading for $67.17 Friday. Today, the Organization of the Petroleum Exporting Countries (OPEC) announced it decided to leave its production quota (supply of oil) unchanged. Oil is off more than 30% since this summer as slowing global growth has reduced demand and as domestic production has increased significantly in the past several years.
On the other hand, the drop in oil prices may actual signal The True State Of The Economy, as this article so eloquently explains.
Next week, investors will be anxiously awaiting an updated jobs report. According to Bloomberg, expectations are for 228,000 jobs to have been added in November. That would make the 10th consecutive month of more than 200,000 jobs created, which would be the longest streak since 1995. Also, we’ll be keeping an eye on major retailer stocks like Wal-mart (WMT) and Macy’s (M).
6 of our 10 ETFs in the Spotlight inched higher today; 5 of them made new highs as the YTD table below shows.
2. ETFs in the Spotlight
In case you missed the announcement and description of this section, you can read it here again.
It features 10 broadly diversified ETFs from my HighVolume list as posted every Monday. Furthermore, they are screened for the lowest MaxDD% number meaning they have been showing better resistance to temporary sell offs than all others over the past year.
Here are the 10 candidates:

The above table simply demonstrates the magnitude with which some of the ETFs are fluctuating in regards to their positions above or below their respective individual trend lines (%M/A). A break below, represented by a negative number, shows weakness, while a break above, represented by a positive percentage, shows strength.
Year to date, here’s how the above candidates have fared so far:
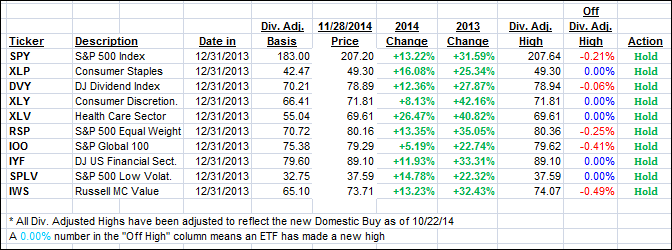
Again, the first table above shows the position of the various ETFs in relation to their respective long term trend lines (%M/A), while the second one tracks their trailing sell stops in the “Off High” column. The “Action” column will signal a “Sell” once the -7.5% point has been taken out in the “Off High” column.
3. Trend Tracking Indexes (TTIs)
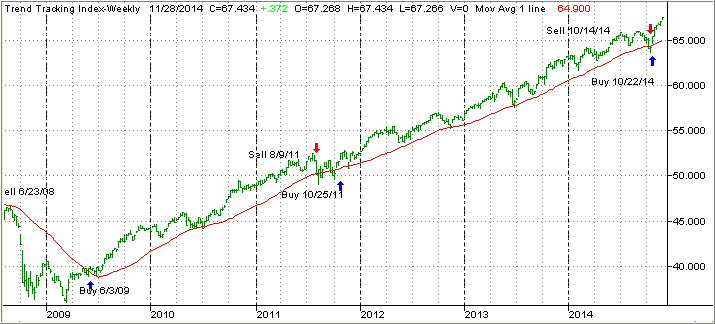
Our Trend Tracking Indexes (TTIs) continued their run deeper into bullish territory and closed the week as follows:
Domestic TTI: +3.70% (last Friday +3.47%)—Buy signal since 10/22/2014
International TTI: +1.54% (last Friday +1.24%)—New Buy signal effective 11/24/14
Have a nice weekend.
Ulli…
Disclosure: I am obliged to inform you that I, as well as advisory clients of mine, own some of these listed ETFs. Furthermore, they do not represent a specific investment recommendation for you, they merely show which ETFs from the universe I track are falling within the guidelines specified.
————————————————————-
READER Q & A FOR THE WEEK
All Reader Q & A’s are listed at our web site!
Check it out at:
http://www.successful-investment.com/q&a.php
Reader Ira:
Q: Ulli: I know we got whipsawed a bit earlier last month. I pulled out and stayed out up to now. I was wondering… when you go back in after that kind of buy-sell-buy switch, how do you transition back into the market? I personally still see lots of danger signals, but as you noted multiple times- with the different govt’s interfering in the markets, all bets are off.
So, I was wondering how you went back in and what % invested you might be now. Also- are there any sectors that might be holds even in a sell signal (like Health…)?
Thanks and best regards.
A: Ira: I posted about my process of getting back into the market after the Domestic TTI signaled a ‘Sell.’ As the TTI rebounded and crossed back above its long-term trend line, I waited a few days to make sure the crossing was holding up. It appeared that way as, after a few days of meandering, the TTI broke the +1% level, which created a new Buy signal effective 10/22/14. I reinvested about 50-60% of available assets (100% for small accounts under $15k). About a week later, the momentum was still up, so I invested the balance giving us a 100% market exposure.
When markets turn bearish, usually all sectors will be affected. As much as I like Healthcare (XLV), I ended up selling it, capturing some profits, and later buying it again. I don’t believe there is any fund/ETF that you should hold during a ‘Sell,’ however, once we drop into bear territory, we may discover upward momentum in certain areas, which I plan on taking advantage of. But it’s too early to tell ahead of time; we have to get there first before we can make that determination.
———————————————————-
WOULD YOU LIKE TO HAVE YOUR INVESTMENTS PROFESSIONALLY MANAGED?
Do you have the time to follow our investment plans yourself? If you are a busy professional who would like to have his portfolio managed using our methodology, please contact me directly or get more details at:
https://theetfbully.com/personal-investment-management/
———————————————————
Back issues of the ETF/No Load Fund Tracker are available on the web at:
https://theetfbully.com/newsletter-archives/

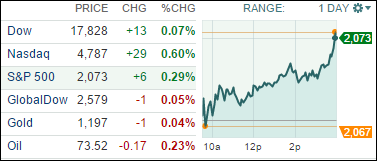
 Black-Friday might be an interesting event to measure consumer confidence in the US and increasingly in Europe, but it’s the central banks that investors really need to watch, said Niall Quinn, managing director at Eaton Vance Management.