ETF/No Load Fund Tracker Newsletter For September 12, 2014
ETF/No Load Fund Tracker StatSheet
————————————————————-
THE LINK TO OUR CURRENT ETF/MUTUAL FUND STATSHEET IS:
https://theetfbully.com/2014/09/weekly-statsheet-for-the-etfno-load-fund-tracker-newsletter-updated-through-09112014/
————————————————————
Market Commentary
Friday, September 12, 2014
INDEXES END THE WEEK LOWER ON BEARISH ENERGY STOCKS AND OUTLOOK OF FED DECISION
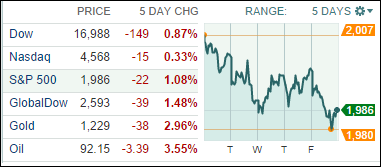
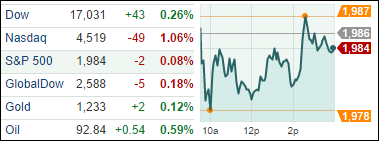
[Chart courtesy of MarketWatch.com]
1. Moving the Markets
Equities finished lower on the week, led by a decline in energy stocks. The Dow fell 0.9% to end the week at 16,988, the S&P 500 dropped 1.1%, to end at 1,986 while the Nasdaq pulled back 0.33%
It was an extremely slow week for economic data, but readings on the economy were encouraging nonetheless. Retail sales showed the consumer strengthened in August, mostly driven mostly by auto sales which rose 0.6%
All eyes will be on the Federal Reserve next Wednesday, when it will release its interest rate decision as well as its quarterly outlook. Expectations are for the Fed to reduce bond purchases by another $10 billion per month, taking current purchases down to $15 billion per month.
All of our 10 ETFs in the Spotlight slipped today but remain on the bullish side of their respective trend lines, as the table below shows.
2. ETFs in the Spotlight
In case you missed the announcement and description of this section, you can read it here again.
It features 10 broadly diversified ETFs from my HighVolume list as posted every Monday. Furthermore, they are screened for the lowest MaxDD% number meaning they have been showing better resistance to temporary sell offs than all others over the past year.
Here are the 10 candidates:
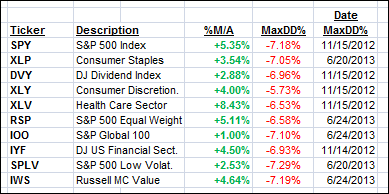
All of them are currently in “buy” mode, meaning their prices are above their respective long term trend lines by the percentage indicated (%M/A).
Year to date, here’s how the above candidates have fared so far:
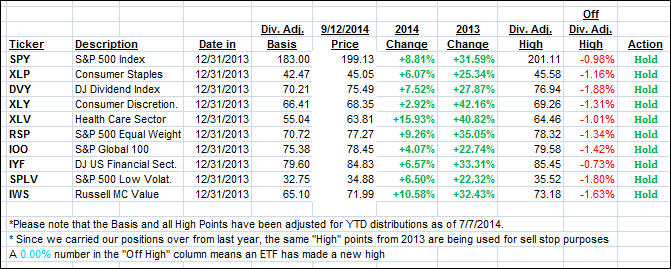
To be clear, the first table above shows the position of the various ETFs in relation to their respective long term trend lines (%M/A), while the second one tracks their trailing sell stops in the “Off High” column. The “Action” column will signal a “Sell” once the -7.5% point is taken out in the “Off High” column.
3. Domestic Trend Tracking Indexes (TTIs)
Our Trend Tracking Indexes (TTIs) headed south for the week and closed as follows:
Domestic TTI: +2.14% (last Friday +3.00%)
International TTI: +1.60% (last Friday +2.69%)
Have a nice weekend.
Ulli…
Disclosure: I am obliged to inform you that I, as well as advisory clients of mine, own some of these listed ETFs. Furthermore, they do not represent a specific investment recommendation for you, they merely show which ETFs from the universe I track are falling within the guidelines specified.
————————————————————-
READER Q & A FOR THE WEEK
All Reader Q & A’s are listed at our web site!
Check it out at:
http://www.successful-investment.com/q&a.php
Reader Cole:
Q: Ulli: Regarding the 2 tables above, you mention that “All of them are currently in “buy” mode, meaning their prices are above their respective long term trend lines by the percentage indicated (%M/A).
However in the “Action” column, they are all listed as a “Hold”. Would you recommend putting new money to work in the current lofty market?
Thanks for this fantastic website and all your valuable insight!
A: Cole: If you currently own any of the listed ETFs, they are considered to be in “Hold” mode as opposed to “Sell” mode, which occurs once they drop off their highs by 7.5%. The “Action” column will reflect such a change.
For new money, I recommend the use of my incremental buying procedure as described in the following video:
https://www.youtube.com/watch?v=9bMzdkYY-hk
———————————————————-
WOULD YOU LIKE TO HAVE YOUR INVESTMENTS PROFESSIONALLY MANAGED?
Do you have the time to follow our investment plans yourself? If you are a busy professional who would like to have his portfolio managed using our methodology, please contact me directly or get more details at:
https://theetfbully.com/personal-investment-management/
———————————————————
Back issues of the ETF/No Load Fund Tracker are available on the web at:
https://theetfbully.com/newsletter-archives/