ETFs/Mutual Funds On The Cutline – Updated Through 1/23/2015

Ulli ETFs on the Cutline Contact

Below are the latest ETF Cutline reports, which show how far above or below their respective long-term trend lines (39 week SMA) my currently tracked ETFs/MFs are positioned.

The first report covers the ETF Master List from Thursday’s StatSheet and includes 410 ETFs, of which currently 244 (last week 217) are hovering in bullish territory.

The second report includes only High Volume ETFs. To clarify, High Volume (HV) ETFs are defined as those with an average daily volume of $10 million or higher.

These ETFs are generated from my selected list of some 97 that I use in my advisor practice. It cuts out the “noise,” which simply means it eliminates those ETFs that I would never buy because of their volume limitations. 41 ETFs (last week 38) have managed to remain in bullish territory after the recent market volatility.

The third report covers Mutual Funds on the Cutline. There are currently 291 (last week 223) above the line and 529 below it out of the 846 that I follow.

Take a look:

1. ETF Master Cutline Report

2. ETF High Volume Cutline Report

3. MF Cutline Report

In case you are not familiar with some of the terminology used in the reports, please read the Glossary of Terms.

If you missed the original post about the Cutline approach, you can read it here.

One Man’s Opinion: Will Europe’s Banking System Remain Weak?

Ulli Market Review Contact

92835431The one thing that stood out in Thursday’s QE announcement by the European Central Bank was how they managed market expectations, said Bob Parker, senior Advisor at Credit Suisse Asset Management.

There was fear in the markets that the ECB would fail to meet expectations, but the central bank managed them very well. They came out with a program, which was well in excess of market expectations. That explains the drop in bond yields on Thursday and Friday.

Ten-year yields in Italy and Spain fell below 1.5 percent, and they are likely to stay there for some time in future. Also, the ECB may be very careful about what it says in public, but it must be very happy with the devaluation of the euro in private, given the fact the euro has come down to about $1.13 now from $1.39-$1.40 in last May-June, he added.

Read More

New ETFs On The Block: Cambria Global Asset Allocation ETF (GAA)

Ulli Bond ETFs Contact

104394781

Cambria Investment Management, the CA-based exchange-traded fund issuer better known for its alternative investment strategies (or Alts), did an encore recently by taking the “low-fee” concept a step further: it launched a zero-fee fund.

Cambria’s latest product – Cambria Global Asset Allocation ETF (GAA), charges 0.00 percent in management fees. Rather, it charges a modest 0.29 percent for meeting annual operating expenses to cover the average expense-ratio of the underlying 29 ETFs held by the portfolio.

GAA is essentially a “fund of funds” that invests in other ETFs. The actively-managed fund seeks to replicate the performance of a truly diversified global portfolio and invests in a basket of US and foreign equities, bonds, REITs, currencies and commodities.

Read More

01-23-2015

Ulli Newsletter Archives Contact

ETF/No Load Fund Tracker Newsletter For January 23, 2015

ETF/No Load Fund Tracker StatSheet

————————————————————-

THE LINK TO OUR CURRENT ETF/MUTUAL FUND STATSHEET IS:

https://theetfbully.com/2015/01/weekly-statsheet-for-the-etfno-load-fund-tracker-newsletter-updated-through-01222015/

————————————————————

Market Commentary

Friday, January 23, 2015

A DISAPPOINTING FINISH TO A FRUITFUL WEEK
Fri pic

[Chart courtesy of MarketWatch.com]

1. Moving the Markets

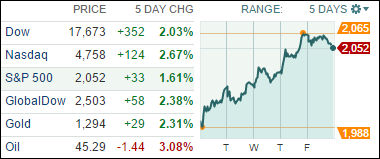
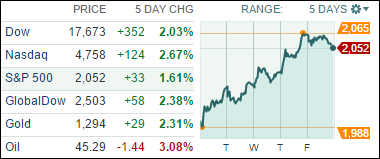
Stocks ended lower today but higher on the week, led primarily by the technology sector. Pushing markets higher in general was news from the European Central Bank. Earlier this week the ECB announced a larger-than-expected asset purchase (bond buying) program. The ECB plans to purchase at least €1.1 trillion (about $1.3 trillion) in investment-grade bonds and asset-backed securities from the secondary market, at least until September 2016. This is an attempt to spur economic growth to increase low inflation to the ECB’s 2% target.

In IPO news today, shares of online file sharing service Box (BOX) jumped more than 65% in their first day of trading. The initial price of the 12.5 million shares that were sold was set at $14 a share; however, the deal had been delayed for months. The company raised $175 million from its IPO and has clients such as General Electric (GE).

The highlight of the upcoming week will arrive on Wednesday, as the Federal Reserve FOMC two-day policy meeting ends and is followed by an announcement. The Fed has recently stated it would remain “patient” in increasing short-term policy rates as global economic growth has slowed and as inflation has stalled due to declining energy prices. Expectations are still for a midyear rate increase. Wall Street will certainly be looking for any change in the Fed’s statement.

All of our 10 ETFs in the Spotlight slipped today but most gained for the week. 6 of our funds remain on the plus side YTD as section 2 shows.

2. ETFs in the Spotlight

In case you missed the announcement and description of this section, you can read it here again.

It features 10 broadly diversified ETFs from my HighVolume list as posted every Monday. Furthermore, they are screened for the lowest MaxDD% number meaning they have been showing better resistance to temporary sell offs than all others over the past year.

Here are the 10 candidates:
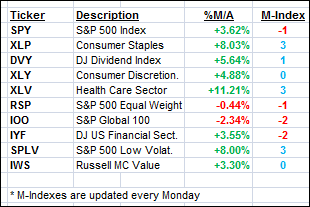
MaxDD

The above table simply demonstrates the magnitude with which some of the ETFs are fluctuating in regards to their positions above or below their respective individual trend lines (%M/A). A break below, represented by a negative number, shows weakness, while a break above, represented by a positive percentage, shows strength.

For more ETF/Mutual fund choices, be sure to reference Thursday’s StatSheet.

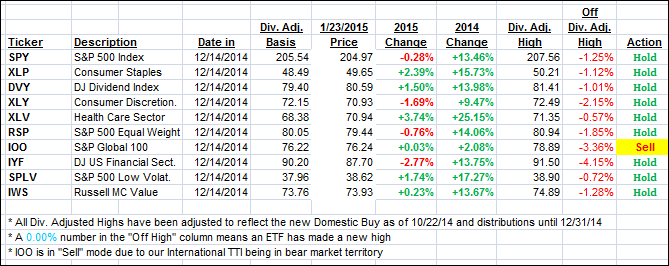
Year to date, here’s how the above candidates have fared so far:
YTD

Again, the first table above shows the position of the various ETFs in relation to their respective long term trend lines (%M/A), while the second one tracks their trailing sell stops in the “Off High” column. The “Action” column will signal a “Sell” once the -7.5% point has been taken out in the “Off High” column.

3. Trend Tracking Indexes (TTIs)

Our Trend Tracking Indexes (TTIs) improved as this week’s rebound gathered steam. Today’s close was weak and can likely be attributed to some jitteriness ahead of the Greek elections this weekend.

Here’s how we ended up:

Domestic TTI: +2.81% (last Friday +2.20%)—Buy signal since 10/22/2014

International TTI: -0.47% (last Friday -1.93%)—Sell signal effective 12/15/14

Have a nice weekend.

Ulli…

Disclosure: I am obliged to inform you that I, as well as advisory clients of mine, own some of these listed ETFs. Furthermore, they do not represent a specific investment recommendation for you, they merely show which ETFs from the universe I track are falling within the guidelines specified.

————————————————————-

READER Q & A FOR THE WEEK

All Reader Q & A’s are listed at our web site!
Check it out at:

http://www.successful-investment.com/q&a.php

Reader Angela:

Q: Ulli: If I buy a stock at $50.00 and then, the stock goes up to $70.00, then it starts sliding down; if I am using a 7% SELL STOP, then I will be getting out at $65.10. This is all good, but my problem is that I don’t have the time, discipline to track and execute this transaction.

However, I have an option through my brokerage account to place a trade called “trailing stop on quote.”

I could place this type of order when the price of the stock reaches $70.00. There are two trail options, one is a percentage or points (price). Which one should I use?  What do you thing about using this type of trade to track by sell stops.

Thanks for your help.

A: Angela: There are various issues here.

First, my sell stop discipline does not work with individual stocks very well, since they are too volatile. My exit strategy is designed to be applied to broadly diversified mutual funds and ETFs.

Second, you need to track the high prices of your ETF/mutual fund every day. Say, you reach the $70 level, and then the price slips to $68 before resuming its trend and touching $72. Then $72 becomes your new high price from which to calculate your sell stop. You can’t do that with an automated system such as you describe.

Third, as I posted on various occasions, we only used day-ending prices for our calculations in order to avoid intra-day whipsaw signals and/or market manipulation.

Having said that, you should be able to take a couple minutes at night to see if your sell stop, based on that day’s closing price, has been triggered or not. If it has, then you can place your order the next morning.

Hope this helps.

———————————————————-

WOULD YOU LIKE TO HAVE YOUR INVESTMENTS PROFESSIONALLY MANAGED?

Do you have the time to follow our investment plans yourself? If you are a busy professional who would like to have his portfolio managed using our methodology, please contact me directly or get more details at:

https://theetfbully.com/personal-investment-management/

———————————————————

Back issues of the ETF/No Load Fund Tracker are available on the web at:

https://theetfbully.com/newsletter-archives/

ETF/No Load Fund Tracker Newsletter For January 23, 2015

Ulli ETF Tracker Contact

ETF/No Load Fund Tracker StatSheet

————————————————————-

THE LINK TO OUR CURRENT ETF/MUTUAL FUND STATSHEET IS:

https://theetfbully.com/2015/01/weekly-statsheet-for-the-etfno-load-fund-tracker-newsletter-updated-through-01222015/

————————————————————

Market Commentary

Friday, January 23, 2015

A DISAPPOINTING FINISH TO A FRUITFUL WEEK

Fri pic

[Chart courtesy of MarketWatch.com]

1. Moving the Markets

Stocks ended lower today but higher on the week, led primarily by the technology sector. Pushing markets higher in general was news from the European Central Bank. Earlier this week the ECB announced a larger-than-expected asset purchase (bond buying) program. The ECB plans to purchase at least €1.1 trillion (about $1.3 trillion) in investment-grade bonds and asset-backed securities from the secondary market, at least until September 2016. This is an attempt to spur economic growth to increase low inflation to the ECB’s 2% target.

In IPO news today, shares of online file sharing service Box (BOX) jumped more than 65% in their first day of trading. The initial price of the 12.5 million shares that were sold was set at $14 a share; however, the deal had been delayed for months. The company raised $175 million from its IPO and has clients such as General Electric (GE).

The highlight of the upcoming week will arrive on Wednesday, as the Federal Reserve FOMC two-day policy meeting ends and is followed by an announcement. The Fed has recently stated it would remain “patient” in increasing short-term policy rates as global economic growth has slowed and as inflation has stalled due to declining energy prices. Expectations are still for a midyear rate increase. Wall Street will certainly be looking for any change in the Fed’s statement.

All of our 10 ETFs in the Spotlight slipped today but most gained for the week. 6 of our funds remain on the plus side YTD as section 2 shows.

Read More

Weekly StatSheet For The ETF/No Load Fund Tracker Newsletter – Updated Through 01/22/2015

Ulli ETF StatSheet Contact

ETF/Mutual Fund Data updated through Thursday, January 22, 2015

TOC 121514

If you are not familiar with some of the terminology used, please see the Glossary of Terms.


1. DOMESTIC EQUITY MUTUAL FUNDS/ETFs: BUY — since 10/22/2014

TTI

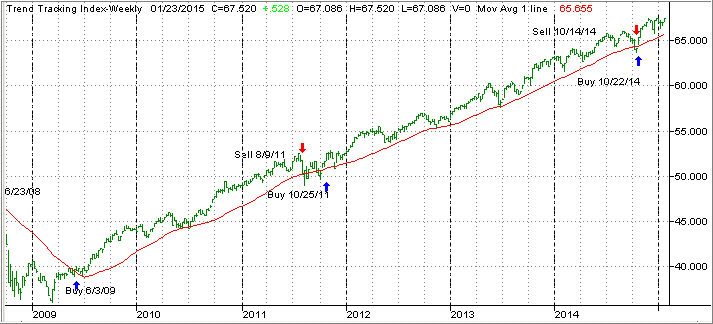
Our main directional indicator, the Domestic Trend Tracking Index (TTI), broke through its long-term trend line generating a “Sell” for this arena effective 10/14/2014, which was followed by a violent break back above the line on 10/22/14 generating a new “Buy.” It was a classic whipsaw signal, and you can read more on my blog as to the events as they were unfolding.

As of today, our TTI (green line in above chart) is positioned above its long term trend line (red) by +3.01% keeping us in the market with our established positions.

Read More