
1. Moving the Markets
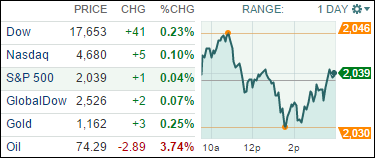
Stocks are back on track this Thursday after dropping slightly yesterday. The Dow was able to post another record high-water mark at the close of trading today, finishing up 0.23%. The S&P 500 gained 0.04% and the Nasdaq stood at an 0.10% gain at closing.
The gain in the Dow was largely attributed to Walmart posting better-than-expected earnings, however, plunging oil prices erased most of the index’s gains. As you know, oil prices have been dropping over the past two months, and today prices fell below $75 a barrel for the first time in four years. The benchmark U.S. crude oil index is down 31% since late June. Exxon Mobil (XOM) and Chevron (CVX) took notable hits among energy stocks.
In M&A news, Berkshire Hathaway (BRKA) announced today that it will buy Duracell Batteries from Procter & Gamble (PG). This small transaction is valued at a mere $4.7 billion. We also heard today that Dreamworks Animation (DWA) is in talks to buy the toymaker Hasbro (HAS), though no tentative purchase price was mentioned. Dreamworks stock closed 14% higher on the day.
The Q3 earnings reporting season is not quite over yet, so let’s stay tuned to see how the numbers will look from a number of firms on Friday.
4 of our 10 ETFs in the Spotlight gained with 2 of them making new highs as the YTD table below shows.
2. ETFs in the Spotlight
In case you missed the announcement and description of this section, you can read it here again.
It features 10 broadly diversified ETFs from my HighVolume list as posted every Monday. Furthermore, they are screened for the lowest MaxDD% number meaning they have been showing better resistance to temporary sell offs than all others over the past year.
Here are the 10 candidates:
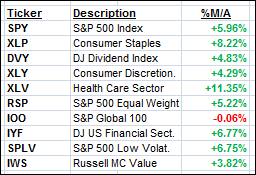
The above table simply demonstrates the magnitude with which some of the ETFs are fluctuating in regards to their positions above or below their respective individual trend lines (%M/A). A break below, represented by a negative number, shows weakness, while a break above, represented by a positive percentage, shows strength.
Year to date, here’s how the above candidates have fared so far:
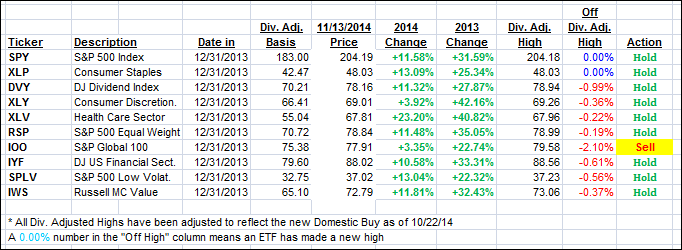
Again, the first table above shows the position of the various ETFs in relation to their respective long term trend lines (%M/A), while the second one tracks their trailing sell stops in the “Off High” column. The “Action” column will signal a “Sell” once the -7.5% point has been taken out in the “Off High” column.
3. Trend Tracking Indexes (TTIs)
Our Trend Tracking Indexes (TTIs) were again mixed and changed only immaterially. The International one continues to bounce around its trend line without clear direction.
Here’s how we closed:
Domestic TTI: +3.29% (last close +3.34%)—Buy signal since 10/22/2014
International TTI: +0.09% (last close -0.02%)—Sell signal since 10/1/2014
Disclosure: I am obliged to inform you that I, as well as advisory clients of mine, own some of these listed ETFs. Furthermore, they do not represent a specific investment recommendation for you, they merely show which ETFs from the universe I track are falling within the guidelines specified.
Contact Ulli
Comments 2
Hi Ulli, Thanks so much for the information that you share. It has helped me tremendously and freed up a lot of time, to boot.
I am wondering what your thoughts are re: buying put options to help protect profits – along with your stop loss rules, of course. It seems that this might help to preserve profits in the event of a down turn. I am thinking of puts that would be about 6 or 8 weeks out, and perhaps of protecting a part of my holdings.
Thanks again,
Larry
Larry,
Sure, you can buy put options on the indexes to protect part of your assets from a sudden decline. Your timing has to be pretty good, otherwise the cost of the put options will eat into your gains.
Ulli…