
1. Moving the Markets
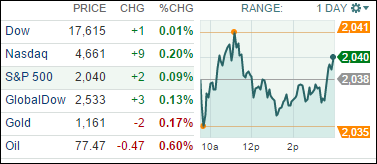
The bond markets were closed in observance of Veteran’s Day, so trading in equities was thin, which may have contributed to the continuation of the rally.
It was a see-saw session, as the chart above shows, but the major indexes managed to close in the green despite no economic data points. In individual stock news, Alibaba stole the show after its big online shopping day, called “Singles Day,” which procured more than $2 billion in sales in one hour.
6 of our 10 ETFs in the Spotlight closed up as well with 3 of them making new highs as the YTD table below shows.
2. ETFs in the Spotlight
In case you missed the announcement and description of this section, you can read it here again.
It features 10 broadly diversified ETFs from my HighVolume list as posted every Monday. Furthermore, they are screened for the lowest MaxDD% number meaning they have been showing better resistance to temporary sell offs than all others over the past year.
Here are the 10 candidates:
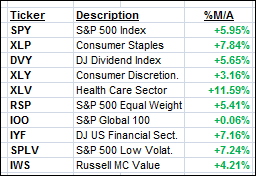
The above table simply demonstrates the magnitude with which some of the ETFs are fluctuating in regards to their positions above or below their respective individual trend lines (%M/A). A break below, represented by a negative number, shows weakness, while a break above, represented by a positive percentage, shows strength.
Year to date, here’s how the above candidates have fared so far:
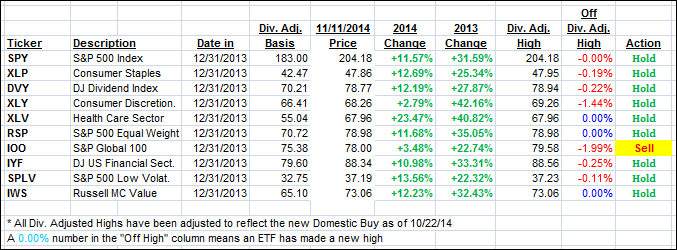
Again, the first table above shows the position of the various ETFs in relation to their respective long term trend lines (%M/A), while the second one tracks their trailing sell stops in the “Off High” column. The “Action” column will signal a “Sell” once the -7.5% point has been taken out in the “Off High” column.
3. Trend Tracking Indexes (TTIs)
Our Trend Tracking Indexes (TTIs) inched higher and the International one continues to nibble on the bullish side of the trend line. As I said yesterday, I like to see some staying power above the line before I consider this bearish period to be over.
Here’s how we closed:
Domestic TTI: +3.27% (last close +3.20%)—Buy signal since 10/22/2014
International TTI: +0.27% (last close +0.01%)—Sell signal since 10/1/2014
Disclosure: I am obliged to inform you that I, as well as advisory clients of mine, own some of these listed ETFs. Furthermore, they do not represent a specific investment recommendation for you, they merely show which ETFs from the universe I track are falling within the guidelines specified.
Contact Ulli