
1. Moving the Markets
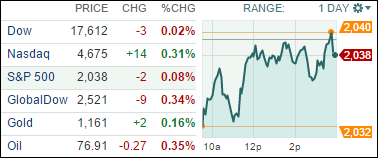
Stocks pulled back from record highs today, dragged down mostly by the financial sector after hearing today that six big banks were fined $4.3 billion in a settlement over foreign exchange manipulation charges. The S&P 500 and Dow both closed a tad lower, which snapped a 6-day streak of daily gains. The Nasdaq moved in the opposite direction today, gaining 0.3%.
Citibank (C), JPMorgan Chase Bank (JPM), Royal Bank of Scotland (RBS), HSBC Bank (HSBC) and UBS (UBS) are among the banks being fined. However, the investigation is not over apparently, as Barclays (BCS) is also anticipated to settle on a fine amount.
Retail stocks were back in focus today. With the holiday season just around the corner, Wall Street is closely watching large retailers such as Macy’s (M) and J.C. Penny (JCP) and Wal-Mart (WMT). Macy’s stock got a 5% pop today after reporting earnings that topped analyst estimates. J.C Penny reports after the bell today and both Wal-Mart and Kohl’s are expected to report on Thursday, so keep an eye out!
And finally, oil prices just keep on sliding down. The U.S. crude oil benchmark was down another 1.5% today to $76.81 a barrel. The news is good for your wallet at the pump, but maybe not for your oil investments.
3 of our 10 ETFs in the Spotlight gained with 1 of them making new highs as the YTD table below shows.
2. ETFs in the Spotlight
In case you missed the announcement and description of this section, you can read it here again.
It features 10 broadly diversified ETFs from my HighVolume list as posted every Monday. Furthermore, they are screened for the lowest MaxDD% number meaning they have been showing better resistance to temporary sell offs than all others over the past year.
Here are the 10 candidates:
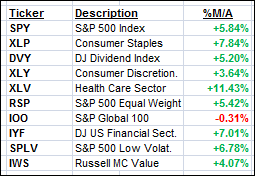
The above table simply demonstrates the magnitude with which some of the ETFs are fluctuating in regards to their positions above or below their respective individual trend lines (%M/A). A break below, represented by a negative number, shows weakness, while a break above, represented by a positive percentage, shows strength.
Year to date, here’s how the above candidates have fared so far:
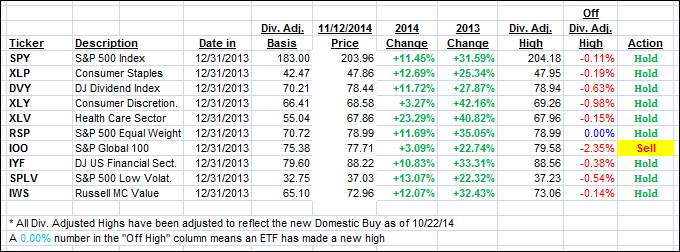
Again, the first table above shows the position of the various ETFs in relation to their respective long term trend lines (%M/A), while the second one tracks their trailing sell stops in the “Off High” column. The “Action” column will signal a “Sell” once the -7.5% point has been taken out in the “Off High” column.
3. Trend Tracking Indexes (TTIs)
Our Trend Tracking Indexes (TTIs) were mixed with the Domestic one gaining slightly and the Internatonal one dropping back below its long trem trend line.
Here’s how we closed:
Domestic TTI: +3.34% (last close +3.27%)—Buy signal since 10/22/2014
International TTI: -0.02% (last close +0.27%)—Sell signal since 10/1/2014
Disclosure: I am obliged to inform you that I, as well as advisory clients of mine, own some of these listed ETFs. Furthermore, they do not represent a specific investment recommendation for you, they merely show which ETFs from the universe I track are falling within the guidelines specified.
Contact Ulli