ETF/No Load Fund Tracker Newsletter For November 7, 2014
ETF/No Load Fund Tracker StatSheet
————————————————————-
THE LINK TO OUR CURRENT ETF/MUTUAL FUND STATSHEET IS:
https://theetfbully.com/2014/11/weekly-statsheet-for-the-etfno-load-fund-tracker-newsletter-updated-through-11062014/
————————————————————
Market Commentary
Friday, November 7, 2014
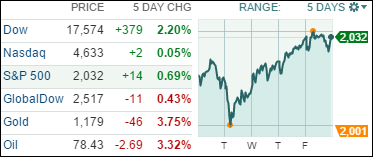
STOCKS INCH OUT GAINS AND FINISH THE WEEK ON SOLID GROUND

[Chart courtesy of MarketWatch.com]
1. Moving the Markets
Stocks inched higher again today to close out the week at record highs, continuing their rebound from the mid-October pullback. Solid employment figures supported the improving economic outlook, while largely positive corporate earnings announcements and further commentary on potential monetary policy stimulus in Europe also contributed to the week’s gain.
Wall Street sentiment got a bullish swing earlier this week after the Republican Party took over the Senate. As I mentioned in yesterday’s piece, historically markets have performed very well during periods when the GOP controls the senate. Also pushing markets a bit higher today was the news that the unemployment rate has dropped to 5.8%, however, the number of newly created jobs did miss expectations.
There is not much anticipation of major market moving events in the upcoming week. Q3 earnings season is winding down, and the results have been encouraging for the most part. Of the 90% of companies in the S&P that have reported, 75% beat expectations.
8 of our 10 ETFs in the Spotlight managed to close up while 6 of them made new highs as the YTD table below shows.
2. ETFs in the Spotlight
In case you missed the announcement and description of this section, you can read it here again.
It features 10 broadly diversified ETFs from my HighVolume list as posted every Monday. Furthermore, they are screened for the lowest MaxDD% number meaning they have been showing better resistance to temporary sell offs than all others over the past year.
Here are the 10 candidates:
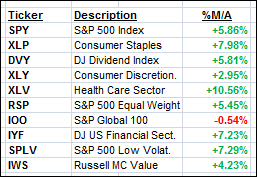
The above table simply demonstrates the magnitude with which some of the ETFs are fluctuating in regards to their positions above or below their respective individual trend lines (%M/A). A break below, represented by a negative number, shows weakness, while a break above, represented by a positive percentage, shows strength.
Year to date, here’s how the above candidates have fared so far:
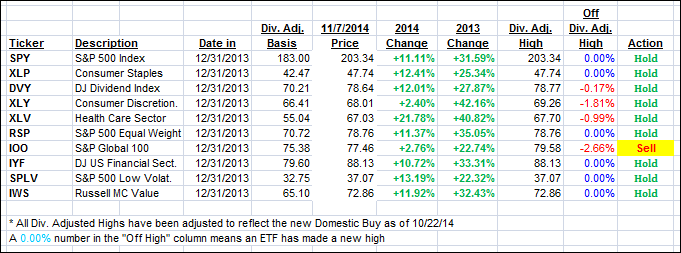
Again, the first table above shows the position of the various ETFs in relation to their respective long term trend lines (%M/A), while the second one tracks their trailing sell stops in the “Off High” column. The “Action” column will signal a “Sell” once the -7.5% point has been taken out in the “Off High” column.
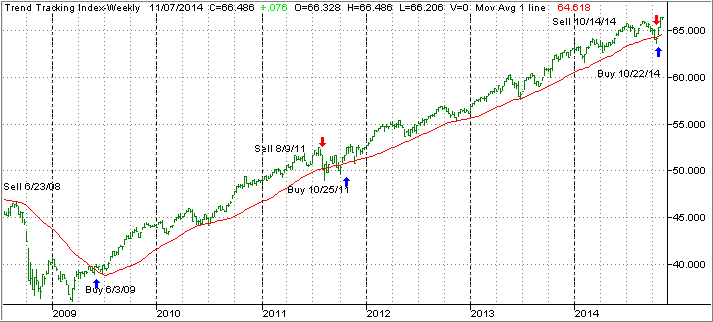
3. Trend Tracking Indexes (TTIs)
Our Trend Tracking Indexes (TTIs) improved during this week with the Domestic one settling deeper on the bullish side while the International one is attempting to move out of its bear market position:
Here’s how we ended the week:
Domestic TTI: +3.09% (last Friday +2.93%)—Buy signal since 10/22/2014
International TTI: -0.30% (last Friday -0.39%)—Sell signal since 10/1/2014
Have a nice weekend.
Ulli…
Disclosure: I am obliged to inform you that I, as well as advisory clients of mine, own some of these listed ETFs. Furthermore, they do not represent a specific investment recommendation for you, they merely show which ETFs from the universe I track are falling within the guidelines specified.
————————————————————-
READER Q & A FOR THE WEEK
All Reader Q & A’s are listed at our web site!
Check it out at:
http://www.successful-investment.com/q&a.php
Reader John:
Q: Ulli: I have been reading your newsletter and find the information valuable and informative. Your approach to stop loss orders is interesting. Have you back tested this approach?
My real question is what to do when you are between a buy and a TBD sell point when you have new money to put in the market? Do you have some guidelines on the equity – fixed income split?
A: John: I have done some back testing but most has been real life experience. Whenever you have new money to deploy, your risk tolerance should be your guide. I talk about that in a short video, which you can watch at:
http://www.youtube.com/user/theetfbully
———————————————————-
WOULD YOU LIKE TO HAVE YOUR INVESTMENTS PROFESSIONALLY MANAGED?
Do you have the time to follow our investment plans yourself? If you are a busy professional who would like to have his portfolio managed using our methodology, please contact me directly or get more details at:
https://theetfbully.com/personal-investment-management/
———————————————————
Back issues of the ETF/No Load Fund Tracker are available on the web at:
https://theetfbully.com/newsletter-archives/