ETF/No Load Fund Tracker Newsletter For February 27, 2015
ETF/No Load Fund Tracker StatSheet
————————————————————-
THE LINK TO OUR CURRENT ETF/MUTUAL FUND STATSHEET IS:
https://theetfbully.com/2015/02/weekly-statsheet-for-the-etfno-load-fund-tracker-newsletter-updated-through-02262015/
————————————————————
Market Commentary
Friday, February 27, 2015
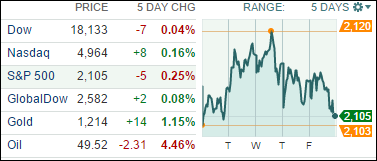
STOCKS FALL FRIDAY, BUT POST IMPRESSIVE MONTHLY RESULT
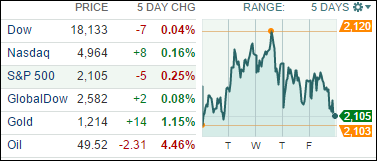
[Chart courtesy of MarketWatch.com]
1. Moving the Markets
Stocks fell Friday, but the major indexes were little changed on the week. Consumer staples lead the gainers, while energy shares declined along with oil prices. Friday’s trading officially rounded out the month of February, which was perhaps the best month for major indexes since October of 2011. For the month, the S&P 500 rose 5.5%, the Dow gained 5.6% and the Nasdaq surged 7.1%, despite horrific economic data, which missed 90% of expectations.
Fed Chair Janet Yellen provided two days of testimony to Congress this week. The primary takeaway was that inflation and wage growth remain low enough that a rate hike is unlikely in the next couple of months, but the Fed continues to monitor for improving conditions that would warrant a tightening of policy.
Economic data for this week was mixed overall, but allegedly continues to point toward growth of 2.5% to 3% for 2015 in the U.S., which is a stronger pace than most developed economies around the globe. Gross domestic product (GDP) growth was revised downward to 2.2% from the initial estimate of 2.6%. The downward revision was slightly smaller than expected; however, consumer spending was the strongest driver of economic growth in the quarter, growing 4.2%, which is the fastest pace since the first quarter of 2006.
9 of our 10 ETFs in the Spotlight slipped today with one them moving into the red YTD, as table 2 below shows.
2. ETFs in the Spotlight
In case you missed the announcement and description of this section, you can read it here again.
It features 10 broadly diversified ETFs from my HighVolume list as posted every Monday. Furthermore, they are screened for the lowest MaxDD% number meaning they have been showing better resistance to temporary sell offs than all others over the past year.
Here are the 10 candidates:
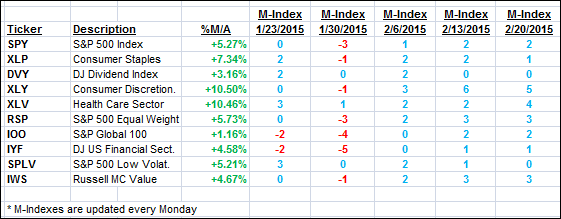
The above table simply demonstrates the magnitude with which some of the ETFs are fluctuating in regards to their positions above or below their respective individual trend lines (%M/A). A break below, represented by a negative number, shows weakness, while a break above, represented by a positive percentage, shows strength.
For hundreds of ETF/Mutual fund choices, be sure to reference Thursday’s StatSheet.
Year to date, here’s how the above candidates have fared so far:
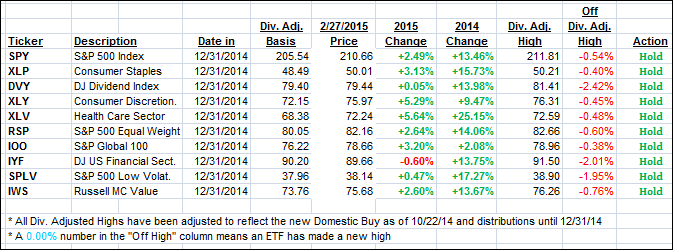
Again, the first table above shows the position of the various ETFs in relation to their respective long term trend lines (%M/A), while the second one tracks their trailing sell stops in the “Off High” column. The “Action” column will signal a “Sell” once the -7.5% point has been taken out in the “Off High” column.
3. Trend Tracking Indexes (TTIs)
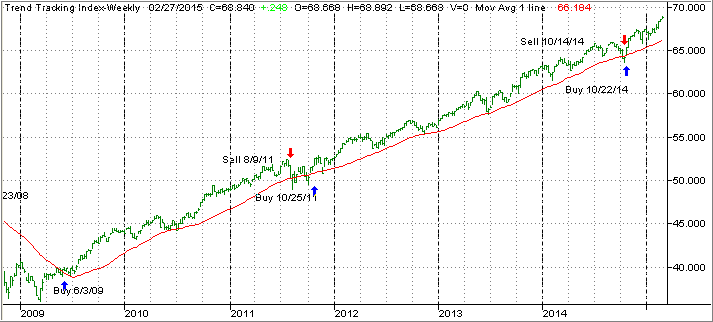
Our Trend Tracking Indexes (TTIs) changed only immaterially during this non-directional week.
Here’s how we ended up:
Domestic TTI: +3.84% (last Friday +3.80%)—Buy signal effective 10/22/2014
International TTI: +3.76% (last Friday +3.79%)—Buy signal effective 2/13/2015
Have a nice weekend.
Ulli…
Disclosure: I am obliged to inform you that I, as well as advisory clients of mine, own some of these listed ETFs. Furthermore, they do not represent a specific investment recommendation for you, they merely show which ETFs from the universe I track are falling within the guidelines specified.
————————————————————-
READER Q & A FOR THE WEEK
All Reader Q & A’s are listed at our web site!
Check it out at:
http://www.successful-investment.com/q&a.php
Reader Ed:
Q: Ulli: In looking at the data you have for the ETFS/Funds, what would be the best way to use the data to come up with potential ETF/Fund buys or conversely sells.
I’m not asking for a recommendation, just the process used to pick the best ETF’s/Funds listed. I mostly use Vanguard ETF’s and funds. If you think I should try other fund families, can you tell me the process to find the best ones?
I don’t like funds with high fees or restrictions in trading, although I don’t do that much, other than to balance my holdings. I’d very much the input you can provide.
A: Ed: While there are many ways to use the ETF/MF tables, I personally prefer to select a mix of funds, preference being ETFs, which demonstrate good upward momentum yet have shown historically some decent resistance to market pullbacks.
You can do that by dropping down the ranking list from the top a few spots, which would eliminate those high performers that tend to collapse quickly during corrections. Our goal is to remain invested as long as possible during up trends while minimizing any potential whip-saw signals.
To make it even easier, I selected 10 ETFs in the Spotlight, which are featured and updated in my daily market commentary. They were chosen based on performance and above average resistance to sell offs along with the fact that they are all trading in high volume. Times change and ETF performance rotates, but you can select from that list and/or find the equivalent at Vanguard, if you prefer.
Hope that helps.
———————————————————-
WOULD YOU LIKE TO HAVE YOUR INVESTMENTS PROFESSIONALLY MANAGED?
Do you have the time to follow our investment plans yourself? If you are a busy professional who would like to have his portfolio managed using our methodology, please contact me directly or get more details at:
https://theetfbully.com/personal-investment-management/
———————————————————
Back issues of the ETF/No Load Fund Tracker are available on the web at:
https://theetfbully.com/newsletter-archives/

 Despite weak credit conditions, lower oil and a slumping euro, Goldman Sachs is optimistic about the region’s growth prospect this year, said Kevin Daly, Senior European economist at Goldman Sachs.