
1. Moving the Markets
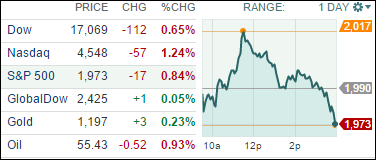
Stocks were up and down substantially throughout the day, but ultimately closed lower across the board, marking losses for the six of the past seven days. The Dow dropped 0.7%, the S&P 500 fell 0.8% and the Nasdaq ended 1.2% lower. West Texas Intermediate crude oil dropped to $53.60 a barrel early in the day, but trimmed losses by closing up 2 cents to $55.93 a barrel.
As equities continue to sell off, spooked by sliding oil prices, investors have moved to the perceived safe havens of U.S. government bonds. As a result, the yield on the 10-year Treasury fell to 2.05% from a close of 2.12% Monday. It is odd, given the fact that falling oil prices are actually a good thing for U.S. and global consumers, manufacturers and airlines.
Apparently, there has been a lot focus on the tumbling Russian ruble over the past two days. At its lowest today, the currency was down 23.2% vs the USD which marked an all-time record low. The turmoil has largely been due to the fact that Russia’s central bank suddenly sharply raised interest rates.
Given today’s roller coaster ride, it’s no surprise that 9 out of our 10 ETFs in the Spotlight closed lower. No sell stops were triggered as you can see in section 3 below.
2. ETFs in the Spotlight
In case you missed the announcement and description of this section, you can read it here again.
It features 10 broadly diversified ETFs from my HighVolume list as posted every Monday. Furthermore, they are screened for the lowest MaxDD% number meaning they have been showing better resistance to temporary sell offs than all others over the past year.
Here are the 10 candidates:
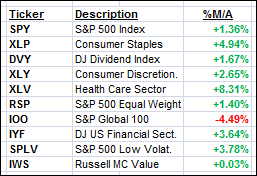
The above table simply demonstrates the magnitude with which some of the ETFs are fluctuating in regards to their positions above or below their respective individual trend lines (%M/A). A break below, represented by a negative number, shows weakness, while a break above, represented by a positive percentage, shows strength.
For additional ETF selections please review my weekly StatSheet, which is updated and posted every Thursday night.
Year to date, here’s how the above candidates have fared so far:
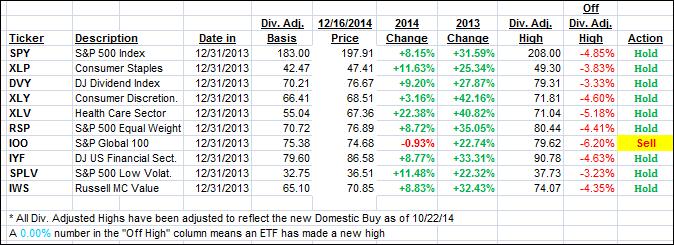
Again, the first table above shows the position of the various ETFs in relation to their respective long term trend lines (%M/A), while the second one tracks their trailing sell stops in the “Off High” column. The “Action” column will signal a “Sell” once either the -7.5% point has been taken out in the “Off High” column or the respective Trend Tracking Index has moved into bear market territory.
3. Trend Tracking Indexes (TTIs)
Our Trend Tracking Indexes (TTIs) were mixed today with the International one improving slightly while the Domestic one slipped a bit.
Here’s how we ended this volatile day:
Domestic TTI: +1.17% (last close +1.27%)—Buy signal since 10/22/2014
International TTI: -2.48% (last close -2.70%)—New Sell signal effective 12/15/14
Disclosure: I am obliged to inform you that I, as well as advisory clients of mine, own some of these listed ETFs. Furthermore, they do not represent a specific investment recommendation for you, they merely show which ETFs from the universe I track are falling within the guidelines specified.
Contact Ulli